423 Leathertree Ln · Blythewood, SC
Flood risk No data
- FEMA flood zone
- —
- Chance of flooding over 30 yrs
- —
- Est. flood insurance / yr
- —
Fire risk No data
- Est. fire insurance / yr
- —
Heat risk No data
- Hot days now (above threshold)
- —
- Hot days in 30 yrs
- —
Wind risk No data
- Chance of severe wind over 30 yrs
- —
Air-quality risk No data
- Unhealthy air days now
- —
- Unhealthy air days in 30 yrs
- —
Risk factors via First Street. Map © Google.
Why this score? — see what drove the C- grade
The composite is a weighted blend of 9 inputs, each scored 0–100. Each bar is that input's sub-score; the figure is the points it added to the 100-point composite (weight × sub-score).
- Cash flow +19.5/30.0
- ARV discount +7.5/15.0
- DSCR +6.2/10.0
- 1% rule +5.3/10.0
- Condition / age +5.0/5.0
- Schools +3.6/10.0
- Livability +3.5/5.0
- Rent growth +2.5/5.0
- Appreciation +0.0/10.0
$369,990
🖨 Deal sheet 📄 Offer letter ✓ Due diligence
Listing remarks
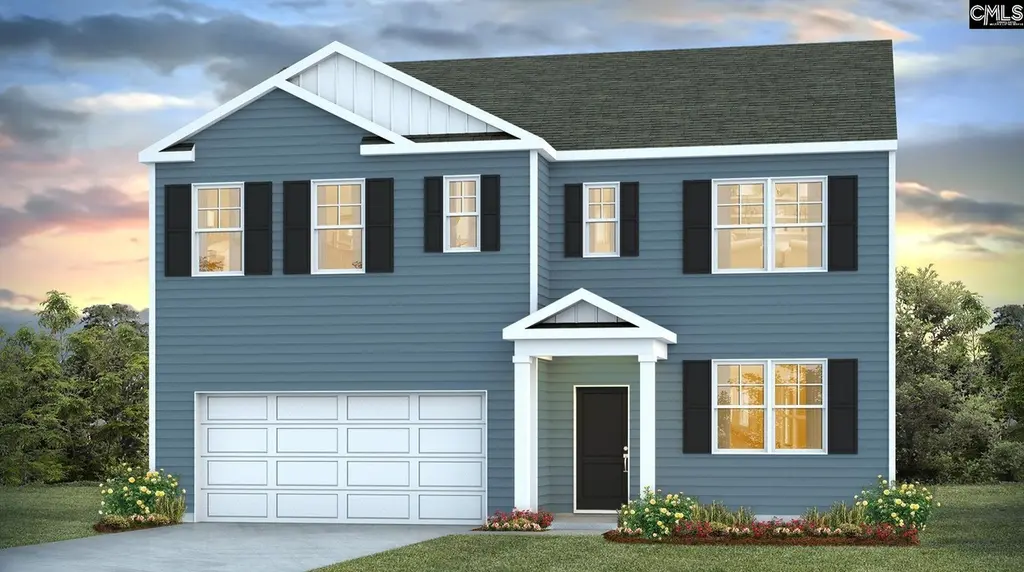
Unlock your dream home at 423 Leathertree Lane, a new construction two-story home in Blythewood, SC with durable Hardie Plank siding. This home sits on a spacious lot and features a covered back patio to enjoy the peaceful atmosphere of Leatherstone from. Inside, this Hayden floorplan offers 5 bedrooms, 3 bathrooms, a first-floor flex space, and a 2-car garage. The primary bedroom can be found upstairs and is connected to the spacious primary bathroom and a walk-in closet. Bedroom 2 is downstairs along with a full bathroom, while the remaining 4 bedrooms are upstairs. The kitchen space is open concept and features a floating island, beautiful quartz countertops, backsplash, and gray shaker-
Key facts
- Hardie plank siding
- Open concept kitchen
- Floating island
Tags
Neighborhood map
What this means for you Summary
Snapshot
- This is a 5-bed/3.0-bath single-family listed at $370k. Condition is rated excellent.
Deal economics
- At list price, monthly cash flow is $420 ($5k/yr) — positive.
- The deal already cash-flows at list — no discount required.
- Meets the 1% rule at list price ($4k rent vs $370k).
Location & tenants
- Location reads 70/100 on livability (#58 in SC) — a middle-class / working-renter tenant base. Strengths: crime A+, employment A+, housing A+; Watch: amenities F, commute F, health & safety F.
- Richland 02 (suburban): math 35% / reading 47% proficiency, ranked #29 of 80 in SC (top 36%) — families likely to look elsewhere, expect single-tenant / working-renter base with shorter leases.
- Zoned schools: Bethel-Hanberry Elementary (math 48% / reading 49%, grade D, #193 of 597 statewide, top 33%, 759 students, 56% FRL); Westwood High (math 47% / reading 87%, grade B, #73 of 196 statewide, top 41%, 1,684 students, 66% FRL) — zoned schools average 61% FRL vs 38% district-wide (23 pts higher); higher-poverty schools than district average — tighter screening recommended.
- Zoned-school proficiency averages 58% at this address vs 41% district-wide (+17 pts) — the actual schools serving this property are materially stronger than the Richland 02 average implies; a family-tenant draw the district grade alone would hide.
- Market conditions: 650 active listings in the ZIP; 2 comparable units currently listed for rent nearby; solid renter incomes; 3,472 units permitted in Richland County in 2024 (1,096 in 5+ unit buildings).
- At $3,820/mo this rent would consume 48% of the median local household income ($95k/yr) (locally 559% of renters already pay >50% of income on rent) — very limited rent-growth headroom before tenants either downsize or default.
Forward outlook
- Local home prices are declining (-3.0%/yr); year-one equity from $3k of loan paydown is wiped out by about $11k of value loss. Plan a longer hold.
- Richland County population projected at +30% by 2050 — long-run rental-demand tailwind backs the buy-and-hold thesis.
Negotiation context
- Only 12 days on market — expect competitive offers; lowballing is unlikely to land.
Questions for the listing agent
- What does the HOA fee cover, when was the last increase, and are there any pending special assessments or reserve-fund shortfalls?
- Is there a deadline driving the sale (1031 exchange, divorce, estate, relocation)? That informs how much negotiation room exists.
- Schools are B-rated — typically a magnet for longer-tenancy family renters. What's the average tenant stay here, and is there a school-zone premium baked into asking?
- What's the average days-on-market for RENTAL listings here right now (not sales)? A rising rental-DOM trend means longer vacancies and softer asking-rent achievability than the comps imply.
- What's the recent tenant-quality profile in this submarket — average credit score on applications, eviction rate, late-payment / NSF rate, and stable-employment percentage? A property-management company in the area should have these aggregated.
- How much new for-sale + rental construction is in the pipeline within 1–3 miles? Heavy new supply typically softens prices + rents 12–24 months out; constrained supply supports both.
Investment metrics
- 1% rule
- 1.03% ✓
- Cap rate
- 7.66%
- Cash-on-cash
- 4.87%
- DSCR
- 1.22
- GRM
- 8.1
CMA / ARV
No comps found within radius.
Projected returns pro-forma
-3.0% appreciation · 3.0% rent growth · sell at horizon
- IRR
- -8.7%
- Equity multiple
- 0.68×
- Total profit
- $-33,117
- Equity at exit
- $55,167
- IRR
- 0.8%
- Equity multiple
- 1.06×
- Total profit
- $5,949
- Equity at exit
- $31,990
Cash invested: $103,597 (down + closing). Projections, not guarantees.
Landlord ↔ Tenant lean methodology
- Overall (STATE)
- 90 Strongly Landlord-Friendly
- State South Carolina
- 90 Strongly Landlord-Friendly · R+6
- County
- — inherits STATE
- City
- — inherits STATE
ZIP-level market 29016
- Home prices YoY
- -26.3%
- Active inventory
- 650
- Price-to-rent
- 8.1×
Monthly cashflow live
- Estimated rent
- $3,820 medium interval (Pro) →
- Mortgage (P&I)
- −$1,940
- Tax est. 1.5%
- −$462 /mo · $5,550/yr
- Insurance
- −$154
- HOA
- −$41
- Vacancy / Maint / Mgmt
- −$802
- Net cashflow
- $420
Break-even live
UW: 25.0% down · 7.5% · 30yr · 1.5% tax · 5.0% vac · 8.0% maint · 8.0% mgmt
Financing live
Cash to close
- Down payment
- $92,498
- Closing costs
- $11,100
- Reserves months
- —
- Total cash needed
- —
Loan-product check · same deal, 3 products live
Conventional
25% down · 7.5% · 30yr
- Down + closing
- —
- Monthly P&I
- —
- Monthly cashflow
- —
- DSCR
- —
- Eligible?
- —
Personal DTI + credit; lowest rate.
DSCR
20% down · 8.5% · 30yr
- Down + closing
- —
- Monthly P&I
- —
- Monthly cashflow
- —
- DSCR
- —
- Eligible?
- —
No personal income docs; deal must DSCR.
Hard money
10% down · 12.0% · 12mo
- Down + closing
- —
- Monthly P&I
- —
- Monthly cashflow
- —
- DSCR
- —
- Eligible?
- —
Short-term bridge; refi at stabilization.
Rent comps 2 comps
| Address | Beds | Baths | Sqft | Rent | $/sqft | DOM | Units | Dist |
|---|---|---|---|---|---|---|---|---|
| 563 Roseridge Dr Blythewood, SC | 5.0 | 3.0 | 2555 | $3,619 | $1.42 | 2d | 1 | 0.44mi |
| 434 Rocky Bark Ln Blythewood, SC | 5.0 | 2.5 | 3200 | $3,200 | $1.00 | 3d | 1 | 1.04mi |
HOA detail
- Monthly dues
- $41 · $492/yr
Listing history 10 events
-
2026-06-09status $369,990 Pending 12 DOM
-
2026-06-08days on market $369,990 Active 12 DOM
-
2026-06-07days on market $369,990 Active 11 DOM
-
2026-06-05days on market $369,990 Active 8 DOM
-
2026-06-03days on market $369,990 Active 7 DOM
-
2026-06-03days on market $369,990 Active 6 DOM
-
2026-06-01days on market $369,990 Active 5 DOM
-
2026-05-31days on market $369,990 Active 4 DOM
-
2026-03-18status Pending
-
2026-03-16$365,000 Active
ⓘ Source: listings_history table (triggers on properties + properties_extension) + one-shot
backfill from property_details.listing_events for pre-trigger history.
Nearby sold comps map
Loading sold comps map…
Walkable amenities ~0.75 mi
Loading nearby amenities…
Taxation est. · year 1
- Rental income
- $45,843
- − Mortgage interest
- −$20,725
- − Property taxes
- −$5,550
- − Insurance
- −$1,850
- − Repairs & maintenance
- −$3,667
- − Management
- −$3,667
- − HOA
- −$492
- − Depreciation
- −$10,763
- Taxable loss
- −$872
- Est. tax savings @ 24.0%
- +$209
- After-tax cash flow
- $5,250/yr
For passive investors: Depreciation is non-cash, so a rental often shows a tax loss while cash-flowing — sheltering income. Rental losses are passive: they offset passive income freely, and up to $25,000/yr can offset ordinary (W-2) income if you actively participate and your MAGI is under $100k (phasing out to $0 by $150k); unused losses carry forward. On sale, claimed depreciation is recaptured at up to 25%, and gains may owe capital-gains tax (a 1031 exchange can defer both). Figures are a year-1 estimate at your 24.0% rate — not tax advice; consult a CPA.
Condition & rehab AI · 12 photos
This new construction home in Blythewood, SC is move-in ready with excellent condition and modern features. It offers spacious living areas, multiple bathrooms, and a well-maintained exterior. Potential buyers and renters will appreciate the home's curb appeal and interior aesthetics.
Value-add opportunities
- Resale Paint interior walls — Fresh paint can enhance curb appeal and interior aesthetics.
- Both Replace carpet with hardwood in bedrooms — Hardwood floors are more durable and can increase both resale and rental value.
- Both Install modern light fixtures throughout — Modern lighting can improve the home's curb appeal and interior ambiance.
- Both Add smart home features — Smart home features can increase both resale and rental value by making the home more convenient and energy-efficient.
Renovation cost estimate screening
Value-add ROI direction
- Resale Paint interior walls — Fresh paint can enhance curb appeal and interior aesthetics. ↑
- Both Replace carpet with hardwood in bedrooms — Hardwood floors are more durable and can increase both resale and rental value. ↑
- Both Install modern light fixtures throughout — Modern lighting can improve the home's curb appeal and interior ambiance. ↑
- Both Add smart home features — Smart home features can increase both resale and rental value by making the home more convenient and energy-efficient. ↑
ⓘ Cost ranges are severity-bucket heuristics (US national rule-of-thumb). Get contractor quotes + a written scope before underwriting a rehab budget.
Schools (NCES district)
- District
- Richland 02
- NCES district ID
- 4503390
- Math proficiency
- 35% ▼ -15.00%
- Reading proficiency
- 47% ▼ -5.00%
- Median HH income
- $59,684
- Composite
- 36.2/100
- National rank
- #4730
- State rank
- #29 of 80 in SC
Livability — Blythewood
- Score
- 70/100
- State rank
- #58
- US rank
- #7406
Category grades
Schools grade is shown separately in the Schools card above.
Census & demographics
- County
- Richland County · 389,530 people
- City population
- 30,454
- Metro
- Columbia, SC
- Population (ZIP)
- 30,454
- Household income
- $95,082
- Rent vs Own
- Severe rent burden
- 559.0
Population outlook (Richland County) Hauer SSP2
- Today (2025)
- 459,667 people
- By 2030
- 487,524 · +6.1%
- By 2040
- 542,035 · +17.9%
- By 2050
- 595,371 · +29.5%
- By 2075
- 732,998 · +59.5%
- By 2100
- 820,415 · +78.5%
Race, ethnicity, and origin ACS 2023
- Neighborhood character
- Diverse neighborhood (Simpson 0.64)
- Race & ethnicity
- Black 43% White 42% Two or more races 7% Hispanic / Latino 7% Asian 3%
- Hispanic origin (detail)
- Mexican 1% Puerto Rican 2%
- Common ancestry
- Lithuanian 2% Romanian 2% Slovak 2%
- Foreign-born
- 5% · Canada, China
- Languages at home
- 90% English-only · Spanish 5% Other Indo-European 1% German/W. Germanic 1%
Political lean MEDSL · Richland
- 2024 margin
- Solid D (+34.6) · D 66.4% · R 31.8% · Other 1.8%
- 2008→2024 swing
- +5.7pp toward D · 2008: 28.9pp · 2024: 34.6pp
- All cycles
- 2024: D+34.6 2020: D+38.3 2016: D+32.9 2012: D+33.3 2008: D+28.9
Not yet ingested
- Civics
- —
Market trends
- HPI YoY
- ▼ -65.48%
- Current HPI
- 183.5933
- Rent YoY
- —
- Metro
- Columbia, SC
- State GDP YoY
- ▲ 4.51%
- F500 in state
- 2
Industry mix (Fortune 500 HQ in SC)
| Industry | F500 HQs | Revenue |
|---|---|---|
| Packaging | 1 | $7B |
|
||
Price history
2 events — show timeline
- 2026-03-18 Pending — Consolidated MLS
- 2026-03-16 Listed $365,000 Consolidated MLS
Cash-flow waterfall
monthlySold comps — $/sqft
last 12 mo · ≤1 miLoading sold comps…