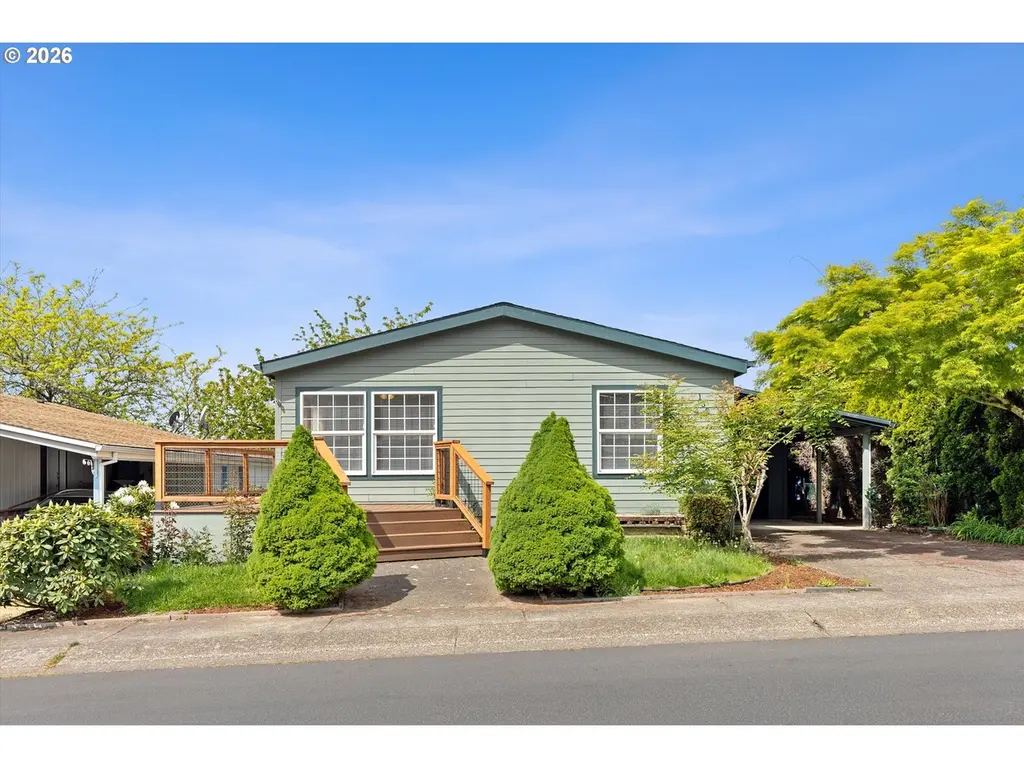
8300 NE Quatama St #133 · Hillsboro, OR
Flood risk 1/10 · Minimal
- FEMA flood zone
- X (unshaded)
- Chance of flooding over 30 yrs
- 0.0%
- Est. flood insurance / yr
- $507 – $1,088
Fire risk 1/10 · Minimal
- Est. fire insurance / yr
- $498 – $926
Heat risk 3/10 · Minor
- Hot days now (above 92°F)
- 7 days/yr
- Hot days in 30 yrs
- 14 days/yr
Wind risk 1/10 · Minimal
- Chance of severe wind over 30 yrs
- —
Air-quality risk 8/10 · Major
- Unhealthy air days now
- 11 days/yr
- Unhealthy air days in 30 yrs
- 11 days/yr
Risk factors via First Street. Map © Google.
Why this score? — see what drove the B- grade
The composite is a weighted blend of 9 inputs, each scored 0–100. Each bar is that input's sub-score; the figure is the points it added to the 100-point composite (weight × sub-score).
- Cash flow +30.0/30.0
- 1% rule +10.0/10.0
- DSCR +10.0/10.0
- Livability +4.4/5.0
- Schools +3.7/10.0
- ARV discount +2.5/15.0
- Condition / age +2.5/5.0
- Rent growth +2.1/5.0
- Appreciation +0.0/10.0
$130,000
🖨 Deal sheet 📄 Offer letter ✓ Due diligence
Listing remarks
This lovely well maintained home in desirable all age park is waiting for you. The Ensuite bath off the Primary Bedroom has a walk in shower and floor to ceiling linen closet. The Primary bedroom has additional floor to ceiling cabinet for extra storage. Both bedrooms have walk in closets. the roomy Kitchen has a wrap around peninsula with a breakfast bar. The spacious Dining area is open to the kitchen and the living room giving ample room for entertaining. This comfortable home is near the lite rail and shopping as well as a walking/bike trail. There is a playground and a large field area in the park. A Must see at this price and location.
Key facts
- Ensuite bath
- Walk in closets
- Walk in shower
Tags
Property features AI
Finance
- Other: Land lease not indicated; Unit dimensions: 50 ft long by 24 ft wide
- Financial info: Monthly lot rent: $970
- HOA & community: Community commons area; Park name: Creekside Hillsboro; Park approval required; application available upon request; Pet policy: one pet up to 25 pounds
Exterior
- Parking: Covered carport
- Security: Sidewalk (listed under security features)
- Utilities: Public water; Public sewer; Electric service (fuel: electricity)
- Home design: Manufactured home in park (not attached); Single-story (main level living); Built in 1994; Approximately 1,188 square feet (main level area total)
- Construction: Composition roof; Block foundation
- Exterior features: Deck; Fenced yard; Front porch; Tool shed; Workshop; Cement siding; Private road access; Paved road
Interior
- Kitchen: Dishwasher; Disposal; Free-standing range; Free-standing refrigerator; Range hood; Double sinks; Eat bar
- Bedrooms: Primary bedroom on main level with ensuite, vaulted ceiling, walk-in closet, and walk-in shower; Second bedroom on main level with vaulted ceiling and walk-in closet
- Flooring: Laminate flooring in bedrooms, kitchen, dining, living and other main areas
- Bathrooms: Two full bathrooms on the main level; One bathroom features a bathtub; one features a walk-in shower
- Heating & cooling: Forced air heating; Heat exchanger cooling; Electric hot water
- Interior features: Laminate flooring throughout main living areas; Vaulted ceilings; Ceiling fan(s) in living room; Double-pane windows with vinyl frames; Crawl space foundation; Accessibility features including parking and a walk-in shower
- Laundry & utility: Main-level laundry room with laminate flooring and washer/dryer hookups (washer/dryer present)
Neighborhood map
What this means for you Summary
Snapshot
- This is a 2-bed/2.0-bath manufactured listed at $130k.
Deal economics
- At list price, monthly cash flow is $807 ($10k/yr) — positive.
- The deal already cash-flows at list — no discount required.
- Meets the 1% rule at list price ($2k rent vs $130k).
- Recommended offer: $126k (3.0% below list) — sets the bar for market timing.
- Cap rate 13.7% vs local median 2.9% in Hillsboro — top-decile yield for the area; either an underpriced asset or a hidden risk that comps aren't pricing in. Stress-test before assuming the spread holds.
Location & tenants
- Location reads 87/100 on livability (#13 in OR, #282 nationally) — a professional / high-income tenant draw. Strengths: amenities A+, commute A+, employment A+; Watch: crime D+, cost of living F.
- Hillsboro SD 1J (urban): math 35% / reading 46% proficiency, ranked #13 of 58 in OR (top 22%) — families likely to look elsewhere, expect single-tenant / working-renter base with shorter leases.
- Zoned schools: Orenco Elementary School (math 42% / reading 52%, grade D-, #132 of 412 statewide, top 34%, 476 students, 37% FRL); J W Poynter Middle School (math 42% / reading 62%, grade C+, #25 of 128 statewide, top 19%, 654 students, 62% FRL); Liberty High School (math 50% / reading 70%, grade C+, #23 of 143 statewide, top 19%, 1,454 students, 46% FRL).
- Zoned-school proficiency averages 53% at this address vs 40% district-wide (+12 pts) — the actual schools serving this property are materially stronger than the Hillsboro SD 1J average implies; a family-tenant draw the district grade alone would hide.
- Market conditions: Rents soft (-1.6%/yr); 245 active listings in the ZIP; 40 comparable units currently listed for rent nearby; rentals at typical pace (median 15d on market — plan ~3-4 weeks tenant-placement turnaround); solid renter incomes; 2,224 units permitted in Washington County in 2024 (242 in 5+ unit buildings).
Forward outlook
- Local home prices are declining (-3.0%/yr); year-one equity from $899 of loan paydown is wiped out by about $4k of value loss. Plan a longer hold.
- Washington County population projected at +33% by 2050 — long-run rental-demand tailwind backs the buy-and-hold thesis.
- At projected returns (-3.0% appreciation + 0.0% rent growth), your $36k cash investment doubles in ~6 years — after that, you're playing with house money.
Negotiation context
- It's been on market 39 days — a 3% lower offer ($126k) is reasonable based on typical stale-listing flexibility.
- 2 sale attempts; this cycle's ask has dropped $15k (10%) from the opening price — seller is motivated, your offer sets the floor, not the list.
Questions for the listing agent
- It's been on market 39 days. Have you received any prior offers? Is the seller open to a 3% concession, seller financing, or rate buy-down credit?
- Is there a deadline driving the sale (1031 exchange, divorce, estate, relocation)? That informs how much negotiation room exists.
- Crime grade is D in this area — have there been break-ins, vandalism, or insurance claims at this property in the last 3 years? What carrier currently insures it and at what premium?
- What's the average days-on-market for RENTAL listings here right now (not sales)? A rising rental-DOM trend means longer vacancies and softer asking-rent achievability than the comps imply.
- What's the recent tenant-quality profile in this submarket — average credit score on applications, eviction rate, late-payment / NSF rate, and stable-employment percentage? A property-management company in the area should have these aggregated.
- How much new for-sale + rental construction is in the pipeline within 1–3 miles? Heavy new supply typically softens prices + rents 12–24 months out; constrained supply supports both.
Investment metrics
- 1% rule
- 1.57% ✓
- Cap rate
- 13.74%
- Cash-on-cash
- 26.59%
- DSCR
- 2.18
- GRM
- 5.3
CMA / ARV
- ARV (median comp)
- $117,031
- List price
- $130,000
- Delta
- 11.08%
- Verdict
- OVERPRICED
- Comps
- 11 within 1.0 mi
Show comp detail 12 sales within ~0.75 mi
| Address | Dist | Beds/Ba | Sqft | Sold | Price | $/sf | Match |
|---|---|---|---|---|---|---|---|
| 8300 NE Quatama St #76 | 0.14mi | 2/2.0 | 1,114 (-6%) | 1mo | $107,000 | $96 | 82 |
| 8300 NE Quatama St #102 | 0.00mi | 3/2.0 (+1) | 1,236 (+4%) | 10mo | $140,000 | $113 | 80 |
| 8300 NE Quatama St #152 | 0.00mi | 3/2.0 (+1) | 1,188 (0%) | 19mo | $203,000 | $171 | 79 |
| 8300 NE Quatama St #48 | 0.15mi | 3/2.0 (+1) | 1,232 (+4%) | 14mo | $169,000 | $137 | 70 |
| 8300 NE Quatama St #171 | 0.00mi | 3/2.0 (+1) | 1,296 (+9%) | 14mo | $185,500 | $143 | 68 |
| 560 SW Sutherland Way | 0.38mi | 3/2.0 (+1) | 1,188 (0%) | 19mo | $375,000 | $316 | 61 |
| 100 SW 195th Ave #71 | 0.53mi | 2/2.0 | 1,248 (+5%) | 8mo | $126,000 | $101 | 60 |
| 8300 NE Quatama St #91 | 0.14mi | 3/2.0 (+1) | 1,296 (+9%) | 18mo | $125,000 | $96 | 58 |
| 100 SW 195th Ave #199 | 0.53mi | 2/2.0 | 1,248 (+5%) | 11mo | $107,000 | $86 | 58 |
| 100 SW 195th Ave #45 | 0.53mi | 2/2.0 | 1,248 (+5%) | 14mo | $148,000 | $119 | 55 |
| 100 SW 195th Ave #104 | 0.41mi | 3/2.0 (+1) | 1,296 (+9%) | 12mo | $130,000 | $100 | 50 |
| 100 SW 195th Ave #3 | 0.53mi | 3/2.0 (+1) | 1,296 (+9%) | 16mo | $157,000 | $121 | 41 |
Match score weights: distance 35% · size 25% · config 20% · recency 20%. Top-matched comps best support the ARV.
Projected returns pro-forma
-3.0% appreciation · 0.0% rent growth · sell at horizon
- IRR
- 17.2%
- Equity multiple
- 1.67×
- Total profit
- $24,298
- Equity at exit
- $19,383
- IRR
- 23.5%
- Equity multiple
- 2.76×
- Total profit
- $64,075
- Equity at exit
- $11,240
Cash invested: $36,400 (down + closing). Projections, not guarantees.
Landlord ↔ Tenant lean methodology
- Overall (STATE)
- 28 Tenant-Leaning
- State Oregon
- 28 Tenant-Leaning · D+6
- County
- — inherits STATE
- City
- — inherits STATE
ZIP-level market 97006
- Rents YoY
- -1.6%
- Active inventory
- 245
- Price-to-rent
- 5.3×
Monthly cashflow live
- Estimated rent
- $2,043 high interval (Pro) →
- Mortgage (P&I)
- −$682
- Tax from tax record
- −$71 /mo · $853/yr
- Insurance
- −$54
- HOA
- −$0
- Vacancy / Maint / Mgmt
- −$429
- Net cashflow
- $807
Break-even live
UW: 25.0% down · 7.5% · 30yr · 1.5% tax · 5.0% vac · 8.0% maint · 8.0% mgmt
Financing live
Cash to close
- Down payment
- $32,500
- Closing costs
- $3,900
- Reserves months
- —
- Total cash needed
- —
Loan-product check · same deal, 3 products live
Conventional
25% down · 7.5% · 30yr
- Down + closing
- —
- Monthly P&I
- —
- Monthly cashflow
- —
- DSCR
- —
- Eligible?
- —
Personal DTI + credit; lowest rate.
DSCR
20% down · 8.5% · 30yr
- Down + closing
- —
- Monthly P&I
- —
- Monthly cashflow
- —
- DSCR
- —
- Eligible?
- —
No personal income docs; deal must DSCR.
Hard money
10% down · 12.0% · 12mo
- Down + closing
- —
- Monthly P&I
- —
- Monthly cashflow
- —
- DSCR
- —
- Eligible?
- —
Short-term bridge; refi at stabilization.
Rent comps 40 comps
| Address | Beds | Baths | Sqft | Rent | $/sqft | DOM | Units | Dist |
|---|---|---|---|---|---|---|---|---|
| 8515 NE Quatama St Hillsboro, OR | 2.0 | 2.0 | 862 | $1,725 | $2.00 | 7d | 1 | 0.22mi |
| 472 NE Patricia Ann Pl Beaverton, OR | 2.0 | 2.5 | 1422 | $2,350 | $1.65 | 20d | 1 | 0.23mi |
| 331 NE 79th Ave Unit 337/204 Hillsboro, OR | 2.0 | 2.0 | 1056 | $1,799 | $1.70 | 3d | 1 | 0.26mi |
| 20642 SW Bingo Ln Beaverton, OR | 3.0 | 2.5 | 1364 | $2,325 | $1.70 | 43d | 1 | 0.27mi |
| 43 SW 206th Ave Beaverton, OR | 3.0 | 2.5 | 1240 | $2,350 | $1.90 | 4d | 1 | 0.27mi |
| 399 NE 79th Ave Beaverton, OR | 2.0 | 2.0 | 1000 | $1,799 | $1.80 | 7d | 1 | 0.28mi |
| 57 SW 206th Ave Beaverton, OR | 3.0 | 3.0 | 1200 | $2,450 | $2.04 | 14d | 1 | 0.28mi |
| 248 NW Prescott Pl Beaverton, OR | 3.0 | 3.0 | 1238 | $2,149 | $1.74 | 24d | 1 | 0.28mi |
| 421 NE 80th Ave Hillsboro, OR | 1.0–2.0 | 1.0–2.0 | 842 | $1,899 | $2.25 | 1d | 19 | 0.28mi |
| 657 NE Garswood Ln Beaverton, OR | 2.0 | 1.0 | 772 | $1,595 | $2.07 | 14d | 1 | 0.33mi |
| 630 NE Garswood Ln Beaverton, OR | 2.0 | 2.5 | 1249 | $1,999 | $1.60 | 21d | 1 | 0.33mi |
| 131 NE 79th Ave Beaverton, OR | 2.0 | 3.0 | 1488 | $2,300 | $1.55 | 43d | 1 | 0.34mi |
| 380 NW Gina Way Beaverton, OR | 1.0–3.0 | 1.0–2.0 | 927 | $1,835 | $1.98 | 3d | 17 | 0.34mi |
| 640 NE Garswood Ln Beaverton, OR | 2.0 | 1.0 | 710 | $1,595 | $2.25 | 43d | 1 | 0.35mi |
| 8650 NE Trailwalk Dr Hillsboro, OR | 1.0–3.0 | 1.0–2.0 | 963 | $1,772 | $1.84 | 1d | 29 | 0.35mi |
| 20674 SW Nantucket Ln Beaverton, OR | 3.0 | 2.5 | 1184 | $2,299 | $1.94 | 16d | 1 | 0.40mi |
| 965 NE Wheelock Pl Beaverton, OR | 2.0 | 2.5 | 1227 | $2,395 | $1.95 | 43d | 1 | 0.40mi |
| 690 NE Adwick Dr Beaverton, OR | 2.0 | 1.0 | 772 | $1,400 | $1.81 | 3d | 1 | 0.40mi |
| 577 SW 207th Ave Beaverton, OR | 3.0 | 2.5 | 1196 | $2,389 | $2.00 | 3d | 1 | 0.41mi |
| 7414 NE Shaleen St Hillsboro, OR | 3.0 | 2.5 | 1419 | $2,400 | $1.69 | 10d | 1 | 0.45mi |
| 1107 NE Station Ct Beaverton, OR | 3.0 | 2.5 | 1400 | $2,200 | $1.57 | 43d | 1 | 0.49mi |
| 1001 NW Briarcreek Way Hillsboro, OR | 1.0–2.0 | 1.0–2.0 | 712 | $1,682 | $2.36 | 2d | 15 | 0.49mi |
| 762 SW 206th Pl Beaverton, OR | 2.0 | 1.5 | 1018 | $1,690 | $1.66 | 43d | 1 | 0.53mi |
| 8646 NE Trafalgar Ln Beaverton, OR | 3.0 | 2.0 | 1200 | $2,145 | $1.79 | 43d | 1 | 0.53mi |
| 8641 NE Trafalgar Ln Beaverton, OR | 3.0 | 2.0 | 1156 | $1,945 | $1.68 | 43d | 1 | 0.55mi |
| 1101 NE 89th Ave Hillsboro, OR | 1.0–3.0 | 1.0–2.0 | 1020 | $2,065 | $2.02 | 2d | 19 | 0.56mi |
| 1090 NE 91st Ave Hillsboro, OR | 1.0–2.0 | 1.0–2.0 | 823 | $2,270 | $2.76 | 3d | 16 | 0.60mi |
| 719 SW Backcourt Pl Aloha, OR | 3.0 | 2.0 | 1384 | $2,325 | $1.68 | 43d | 1 | 0.61mi |
| 650 201st Ave Aloha, OR | 2.0 | 2.0 | 985 | $1,688 | $1.71 | 3d | 5 | 0.63mi |
| 545 SW 201st Ave Beaverton, OR | 1.0–3.0 | 1.0–2.0 | 898 | $1,948 | $2.17 | 1d | 19 | 0.64mi |
| 20849 SW Longacre St Beaverton, OR | 3.0 | 2.0 | 1160 | $2,399 | $2.07 | 43d | 1 | 0.69mi |
| 720 SE Oak Glen Way Hillsboro, OR | 1.0–3.0 | 1.0–2.0 | 855 | $1,770 | $2.07 | 4d | 7 | 0.71mi |
| 7261 NE Stoneybrook St Hillsboro, OR | 2.0 | 2.5 | 1213 | $2,200 | $1.81 | 24d | 1 | 0.75mi |
| 20018 SW Monson St Beaverton, OR | 3.0 | 2.5 | 1484 | $2,395 | $1.61 | 43d | 1 | 0.79mi |
| 1250 NE Compton Dr Hillsboro, OR | 2.0 | 2.0 | 996 | $2,379 | $2.39 | 11d | 1 | 0.79mi |
| 7399 NE Stonewater St Hillsboro, OR | 2.0 | 2.0 | 1118 | $2,245 | $2.01 | 24d | 1 | 0.80mi |
| 1390 NE Compton Dr Hillsboro, OR | 1.0–2.0 | 1.0–2.0 | 862 | $3,060 | $3.55 | 1d | 344 | 0.81mi |
| 9950 NE Gibbs Dr Hillsboro, OR | 4.0 | 1.0–2.0 | 1299 | $2,783 | $2.14 | 3d | 62 | 0.85mi |
| 9250 NE Rockspring St Hillsboro, OR | 3.0 | 1.0–2.0 | 966 | $2,314 | $2.40 | 1d | 22 | 0.86mi |
| 7146 NE Cherry Dr Hillsboro, OR | 2.0 | 2.5 | 1185 | $2,250 | $1.90 | 24d | 1 | 0.90mi |
Listing history 15 events
-
2026-06-18days on market $130,000 Active 39 DOM
-
2026-06-17days on market $130,000 Active 38 DOM
-
2026-06-16days on market $130,000 Active 37 DOM
-
2026-06-15days on market $130,000 Active 36 DOM
-
2026-06-13days on market $130,000 Active 34 DOM
-
2026-06-09days on market $130,000 Active 30 DOM
-
2026-06-08days on market $130,000 Active 29 DOM
-
2026-06-07days on market $130,000 Active 28 DOM
-
2026-06-05days on market $130,000 Active 25 DOM
-
2026-06-03days on market $130,000 Active 24 DOM
-
2026-06-02days on market $130,000 Active 23 DOM
-
2026-06-01days on market $130,000 Active 22 DOM
-
2026-05-31days on market $130,000 Active 21 DOM
-
2026-05-12price $135,000 650-char remark
-
2026-05-02$145,000 Active 650-char remark
ⓘ Source: listings_history table (triggers on properties + properties_extension) + one-shot
backfill from property_details.listing_events for pre-trigger history.
Tax reassessment forecast OR · Resets to sale price
- Current annual tax
- $853 · $71/mo
- Projected year-2 tax
- $1,261 · $105/mo
- Expected delta
- +$408/yr (+$34/mo · 47.8%)
ⓘ Screening estimate from a state-policy table — verify with the county assessor before closing.
Climate risk First Street
- Flood 1/10 Low FEMA zone X (unshaded) · 0% chance over 30 yrs
- Wildfire 1/10 Low
- Heat 3/10 Moderate 7 d/yr ≥92°F today · 14 d/yr by 30 yrs out
- Wind 1/10 Low
- Air quality 8/10 Severe 11 unhealthy d/yr today · 11 by 30 yrs out
Nearby sold comps map
Loading sold comps map…
Walkable amenities ~0.75 mi
Loading nearby amenities…
Taxation est. · year 1
- Rental income
- $24,510
- − Mortgage interest
- −$7,282
- − Property taxes
- −$853
- − Insurance
- −$650
- − Repairs & maintenance
- −$1,961
- − Management
- −$1,961
- − Depreciation
- −$3,782
- Taxable income
- $8,022
- Est. tax owed @ 24.0%
- −$1,925
- After-tax cash flow
- $7,754/yr
For passive investors: Depreciation is non-cash, so a rental often shows a tax loss while cash-flowing — sheltering income. Rental losses are passive: they offset passive income freely, and up to $25,000/yr can offset ordinary (W-2) income if you actively participate and your MAGI is under $100k (phasing out to $0 by $150k); unused losses carry forward. On sale, claimed depreciation is recaptured at up to 25%, and gains may owe capital-gains tax (a 1031 exchange can defer both). Figures are a year-1 estimate at your 24.0% rate — not tax advice; consult a CPA.
Schools (NCES district)
- District
- Hillsboro SD 1J
- NCES district ID
- 4100023
- Math proficiency
- 35% ▼ -4.00%
- Reading proficiency
- 46% ▼ -7.00%
- Median HH income
- $68,587
- Composite
- 36.64/100
- National rank
- #4617
- State rank
- #13 of 58 in OR
Livability — Hillsboro
- Score
- 87/100
- State rank
- #13
- US rank
- #282
Category grades
Schools grade is shown separately in the Schools card above.
Census & demographics
- County
- Washington County · 583,254 people
- City population
- 102,767
- Metro
- Portland-Vancouver-Hillsboro, OR-WA
- Population (ZIP)
- 46,463
- Household income
- $104,790
- Rent vs Own
- Severe rent burden
- 2200.0
Population outlook (Washington County) Hauer SSP2
- Today (2025)
- 674,042 people
- By 2030
- 721,804 · +7.1%
- By 2040
- 812,732 · +20.6%
- By 2050
- 895,143 · +32.8%
- By 2075
- 1,058,806 · +57.1%
- By 2100
- 1,131,692 · +67.9%
Race, ethnicity, and origin ACS 2023
- Neighborhood character
- Diverse neighborhood (Simpson 0.66)
- Race & ethnicity
- White 52% Asian 21% Hispanic / Latino 16% Two or more races 12% Black 3%
- Hispanic origin (detail)
- Mexican 12%
- Common ancestry
- Italian 4% Portuguese 3% Lithuanian 3%
- Foreign-born
- 22% · Canada, China, Vietnam
- Languages at home
- 71% English-only · Spanish 8% Other Asian/Pacific 6% Other Indo-European 5%
Political lean MEDSL · Washington
- 2024 margin
- Solid D (+34.0) · D 65.3% · R 31.3% · Other 3.4%
- 2008→2024 swing
- +11.8pp toward D · 2008: 22.1pp · 2024: 34.0pp
- All cycles
- 2024: D+34.0 2020: D+34.6 2016: D+26.7 2012: D+17.5 2008: D+22.1
Not yet ingested
- Civics
- —
Market trends
- HPI YoY
- ▼ -344.27%
- Current HPI
- 304.041
- Rent YoY
- ▼ -1.58%
- Metro
- Portland-Vancouver-Hillsboro, OR-WA
- State GDP YoY
- ▲ 2.05%
- F500 in state
- 2
Industry mix (Fortune 500 HQ in OR)
| Industry | F500 HQs | Revenue |
|---|---|---|
| Consumer Goods | 1 | $51B |
|
||
Price history
-10.3% since first listed5 events — show timeline
- 2026-05-28 Relisted — RMLS
- 2026-05-28 Price Changed $130,000 RMLS
- 2026-05-20 Pending — RMLS
- 2026-05-12 Price Changed $135,000 RMLS
- 2026-05-02 Listed $145,000 RMLS
Property tax history
+4.4%/yrLatest (2025): $853 · +1.7% YoY. Source: county tax records.
Cash-flow waterfall
monthlySold comps — $/sqft
last 12 mo · ≤1 miLoading sold comps…