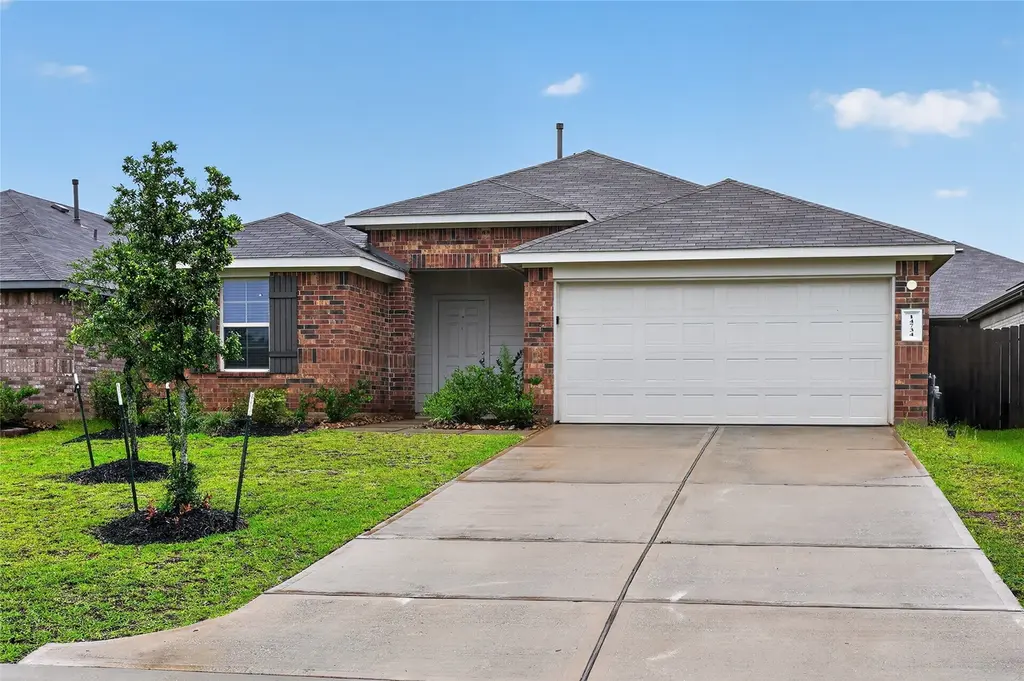
14734 Blackbrush Mnr · Magnolia, TX
Flood risk 1/10 · Minimal
- FEMA flood zone
- X (unshaded)
- Chance of flooding over 30 yrs
- 0.0%
- Est. flood insurance / yr
- $507 – $1,088
Fire risk 4/10 · Minor
- Est. fire insurance / yr
- $1,222 – $2,270
Heat risk 8/10 · Major
- Hot days now (above 111°F)
- 7 days/yr
- Hot days in 30 yrs
- 24 days/yr
Wind risk 8/10 · Major
- Chance of severe wind over 30 yrs
- 99.0%
Air-quality risk 2/10 · Minimal
- Unhealthy air days now
- 2 days/yr
- Unhealthy air days in 30 yrs
- 2 days/yr
Risk factors via First Street. Map © Google.
Why this score? — see what drove the D grade
The composite is a weighted blend of 9 inputs, each scored 0–100. Each bar is that input's sub-score; the figure is the points it added to the 100-point composite (weight × sub-score).
- Appreciation +10.0/10.0
- ARV discount +8.0/15.0
- Cash flow +6.2/30.0
- Schools +3.9/10.0
- Livability +3.7/5.0
- 1% rule +2.9/10.0
- Rent growth +2.6/5.0
- Condition / age +2.2/5.0
- DSCR +0.5/10.0
$289,900
🖨 Deal sheet (PDF) 📄 Offer letter ✓ Due diligence
Listing remarks MLS
TAKE ADVANTAGE of this NEW HOME OPPORTUNIY -- located in the new MILL CREEK community just minutes from the Aggie Expressway/Hwy 249 and easy access to shopping & dining. Zoned for MAGNLOLIA ISD schools! Community offers walking trails, park, splashpad, and more! This 3 bed, 2 bath DR HORTON home is STUNNING and LOADED w/ luxury features. Enjoy a GRANITE ISLAND kitchen with breakfast bar, stainless steel appliances, and rich cabinetry. Kitchen opens to dining and family room. Stunning vinyl plank wood flooring in main living areas, Smart home package, Tankless water heater, and full sprinkler system. Spacious secondary bedrooms along with your very own private primary retreat w/ dual vanities, shower, and walk-in closet. Covered back patio and much more!! This community will be selling fast!! Home to be completed by end of month for early March move-in.
Key facts
- Smart home package
- Gas range
- 6,486 sq ft lot
Tags
Property features AI
Finance
- HOA & community: Community managed by Inframark Processing Center; HOA fee $750 semi-annually
Exterior
- Parking: Attached 2-car garage
- Utilities: Public water service; Public sewer service
- Home design: Residential property; Single-story (entry level: first floor); Full ownership
- Construction: Built in 2022; Brick construction; Composition roof; Slab foundation
- Exterior features: Lot with other landscaping/features; Public water; Public sewer
Interior
- Bedrooms: Three bedrooms on the first floor (approx. 10x13, 10x14, 13x16)
- Bathrooms: 2 full bathrooms
- Heating & cooling: Central heating (electric); Central air conditioning (gas)
- Interior features: 3 total rooms
Neighborhood map
What this means for you Summary
Snapshot
- This is a 3-bed/2.0-bath single-family listed at $290k. Condition is rated fair.
Deal economics
- At list price, monthly cash flow is $-525 ($-6k/yr) — negative.
- To cash-flow at today's rent, offer at most $197k (32.0% below list).
- To meet the 1% rule (rent ≥ 1% of price), the offer needs to be $230k (20.5% below list).
- Recommended offer: $197k (32.0% below list) — sets the bar for cash-flow.
- Cap rate 4.1% vs local median 3.4% in Magnolia — meaningfully above typical; check what's discounted (condition, days-on-market, listing class) to confirm the premium yield is real.
Location & tenants
- Location reads 73/100 on livability (#222 in TX) — a middle-class / working-renter tenant base. Strengths: crime A+, cost of living A+, housing A+; Watch: amenities F, commute F.
- Magnolia ISD (rural): math 42% / reading 45% proficiency, ranked #247 of 826 in TX (top 30%) — families likely to look elsewhere, expect single-tenant / working-renter base with shorter leases.
- Zoned schools: Willie E Williams El (math 46% / reading 41%, grade F, #1,269 of 4,322 statewide, top 30%, 869 students, 70% FRL); Magnolia J H (math 35% / reading 37%, grade F, #805 of 1,662 statewide, top 50%, 1,103 students, 57% FRL); Magnolia H S (math 47% / reading 62%, grade C-, #379 of 1,632 statewide, top 26%, 2,248 students, 31% FRL).
- Market conditions: Rents flat; 1622 active listings in the ZIP; 7 comparable units currently listed for rent nearby; rentals lingering (median 46d on market — plan ~5-8 weeks vacancy on turnover, expect pricing pressure); 57% of comp listings sitting > 30 days — soft ceiling on asking rent; high-income renter base; 13,259 units permitted in Montgomery County in 2024 (1,402 in 5+ unit buildings).
Forward outlook
- In year one you build about $31k of equity ($2k loan paydown + $29k appreciation (10.0% local appreciation)).
- Montgomery County population projected at +65% by 2050 — long-run rental-demand tailwind backs the buy-and-hold thesis.
- By year 2, paydown + projected appreciation supports a ~$50k cash-out refi (75% LTV) — recoverable capital for the next deal without selling this one.
Negotiation context
- It's been on market 19 days — a 2% lower offer ($286k) is reasonable based on typical stale-listing flexibility.
- 4 sale attempts since 4y ago with the ask held roughly flat each time — persistent listings suggest the price (not the market) is what's stuck; bring a comps-based counter.
Risks & watch-outs
- Climate carrying-cost: severe wind risk, 99% chance of damaging wind over 30y; extreme-heat days projected 7→24/yr by 2055 (HVAC capex compounding) — expect insurance premiums to compound above CPI over the hold.
Questions for the listing agent
- What do current leases actually rent for vs. the listed asking? Can we see a recent rent roll and the last 12 months of T-12 income?
- Have any recent inspections been done? Can we get a copy of the seller's disclosures and any deferred-maintenance estimates?
- What does the HOA fee cover, when was the last increase, and are there any pending special assessments or reserve-fund shortfalls?
- Is there a deadline driving the sale (1031 exchange, divorce, estate, relocation)? That informs how much negotiation room exists.
- Schools are D-rated, which usually means shorter tenancies and higher turnover. Who's the typical renter profile here, and what's been the actual vacancy rate?
- The area grade is low — what's the realistic commute time and amenity access for the typical tenant pool here? Any planned neighborhood developments (good or bad) we should know about?
- What's the average days-on-market for RENTAL listings here right now (not sales)? A rising rental-DOM trend means longer vacancies and softer asking-rent achievability than the comps imply.
- What's the recent tenant-quality profile in this submarket — average credit score on applications, eviction rate, late-payment / NSF rate, and stable-employment percentage? A property-management company in the area should have these aggregated.
- How much new for-sale + rental construction is in the pipeline within 1–3 miles? Heavy new supply typically softens prices + rents 12–24 months out; constrained supply supports both.
Investment metrics
- 1% rule
- 0.79% ✗
- Cap rate
- 4.12%
- Cash-on-cash
- -7.76%
- DSCR
- 0.65
- GRM
- 10.5
CMA / ARV
- ARV (on-the-fly)
- $292,988
- Comps found
- 12
Show comp detail 12 sales within ~0.75 mi
| Address | Dist | Beds/Ba | Sqft | Sold | Price | $/sf | Match |
|---|---|---|---|---|---|---|---|
| 15214 Black Scoter Ct | 0.28mi | 3/2.0 | 1,614 (-2%) | 6mo | $299,900 | $186 | 79 |
| 41018 Riverside Meadows Dr | 0.35mi | 3/2.0 | 1,620 (-2%) | 3mo | $329,990 | $204 | 78 |
| 40742 Barley Straw Dr | 0.36mi | 3/2.0 | 1,575 (-4%) | 2mo | $279,990 | $178 | 74 |
| 15122 Rose Willow Ln | 0.43mi | 3/2.0 | 1,575 (-4%) | 2mo | $279,990 | $178 | 71 |
| 15315 Mountain Plover Pl | 0.36mi | 4/2.5 (+1) | 1,689 (+3%) | 1mo | $299,990 | $178 | 71 |
| 40654 Balsam Run Ln | 0.53mi | 3/2.0 | 1,575 (-4%) | 0mo | $287,490 | $183 | 68 |
| 40739 Barley Straw Dr | 0.37mi | 4/2.0 (+1) | 1,750 (+6%) | 3mo | $292,490 | $167 | 65 |
| 40418 Winding Way Ct | 0.60mi | 3/2.0 | 1,605 (-2%) | 5mo | $350,000 | $218 | 64 |
| 40710 Barley Straw Dr | 0.41mi | 4/2.0 (+1) | 1,750 (+6%) | 2mo | $286,490 | $164 | 63 |
| 40838 Hawthorne Glades St | 0.47mi | 4/2.0 (+1) | 1,573 (-4%) | 5mo | $253,990 | $161 | 61 |
| 40731 Barley Straw | 0.43mi | 4/2.0 (+1) | 1,476 (-10%) | 2mo | $264,990 | $180 | 56 |
| 40835 Hawthorne Glades St | 0.46mi | 3/2.5 | 1,470 (-11%) | 6mo | $253,990 | $173 | 54 |
Match score weights: distance 35% · size 25% · config 20% · recency 20%. Top-matched comps best support the ARV.
Projected returns pro-forma
10.0% appreciation · 0.32% rent growth · sell at horizon
- IRR
- 18.0%
- Equity multiple
- 2.46×
- Total profit
- $118,663
- Equity at exit
- $261,165
- IRR
- 16.3%
- Equity multiple
- 5.50×
- Total profit
- $365,225
- Equity at exit
- $563,212
Cash invested: $81,172 (down + closing). Projections, not guarantees.
Landlord ↔ Tenant lean methodology
- Overall (STATE)
- 87 Strongly Landlord-Friendly
- State Texas
- 87 Strongly Landlord-Friendly · R+5
- County
- — inherits STATE
- City
- — inherits STATE
ZIP-level market 77354
- Home prices YoY
- 2.4%
- Rents YoY
- 0.3%
- Active inventory
- 1622
- Price-to-rent
- 10.5×
Monthly cashflow live
- Estimated rent
- $2,304 high interval (Pro) →
- Mortgage (P&I)
- −$1,520
- Tax from tax record
- −$579 /mo · $6,946/yr
- Insurance
- −$121
- HOA
- −$125
- Vacancy / Maint / Mgmt
- −$484
- Net cashflow
- $-525
Break-even live
Sensitivity live
| Price | -10% $-361 | -5% $-443 | +0% $-525 | +5% $-607 | +10% $-689 |
|---|---|---|---|---|---|
| Rent | -10% $-707 | -5% $-616 | +0% $-525 | +5% $-434 | +10% $-343 |
| Rate | -1.0pp $-379 | -0.5pp $-451 | base $-525 | +0.5pp $-600 | +1.0pp $-676 |
UW: 25.0% down · 7.5% · 30yr · 1.5% tax · 5.0% vac · 8.0% maint · 8.0% mgmt
Financing live
Cash to close
- Down payment
- $72,475
- Closing costs
- $8,697
- Reserves months
- —
- Total cash needed
- —
Loan-product check · same deal, 3 products live
Conventional
25% down · 7.5% · 30yr
- Down + closing
- —
- Monthly P&I
- —
- Monthly cashflow
- —
- DSCR
- —
- Eligible?
- —
Personal DTI + credit; lowest rate.
DSCR
20% down · 8.5% · 30yr
- Down + closing
- —
- Monthly P&I
- —
- Monthly cashflow
- —
- DSCR
- —
- Eligible?
- —
No personal income docs; deal must DSCR.
Hard money
10% down · 12.0% · 12mo
- Down + closing
- —
- Monthly P&I
- —
- Monthly cashflow
- —
- DSCR
- —
- Eligible?
- —
Short-term bridge; refi at stabilization.
Rent comps 7 comps
| Address | Beds | Baths | Sqft | Rent | $/sqft | DOM | Units | Dist |
|---|---|---|---|---|---|---|---|---|
| 14983 Clay Harvest Rdg Magnolia, TX | 4.0 | 3.0 | 2173 | $2,375 | $1.09 | 45d | 1 | 0.19mi |
| 14541 Montclair Way Montgomery, TX | 4.0 | 3.0 | 2170 | $2,200 | $1.01 | 0d | 1 | 0.21mi |
| 14727 Band Tailed Pigeon Ct Magnolia, TX | 4.0 | 3.0 | 1942 | $2,700 | $1.39 | 45d | 1 | 0.41mi |
| 40839 Hawthorne Glades St Magnolia, TX | 3.0 | 2.0 | 1156 | $2,100 | $1.82 | 45d | 1 | 0.47mi |
| 39899 Mill Creek Rd Magnolia, TX | 1.0–3.0 | 1.0–2.0 | 1104 | $2,726 | $2.47 | 0d | 40 | 0.67mi |
| 40547 Berylline Ln Magnolia, TX | 4.0 | 2.0 | 1753 | $2,300 | $1.31 | 45d | 1 | 0.87mi |
| 40558 Berylline Ln Unit NA Magnolia, TX | 3.0 | 2.0 | 1499 | $2,150 | $1.43 | 26d | 1 | 0.89mi |
HOA detail
- Monthly dues
- $125 · $1,500/yr
- Likely covers
- water
Listing history 12 events
-
2026-06-21days on market $289,900 Active 19 DOM
-
2026-06-18days on market $289,900 Active 16 DOM
-
2026-06-17days on market $289,900 Active 15 DOM
-
2026-06-16days on market $289,900 Active 14 DOM
-
2026-06-15days on market $289,900 Active 13 DOM
-
2026-06-13days on market $289,900 Active 11 DOM
-
2026-06-09days on market $289,900 Active 7 DOM
-
2026-06-08days on market $289,900 Active 6 DOM
-
2026-06-07days on market $289,900 Active 5 DOM
-
2026-06-04days on market $289,900 Active 2 DOM
-
2026-06-02remarks 632-char remark
-
2026-06-02$289,900 Active 1 DOM
ⓘ Source: listings_history table (triggers on properties + properties_extension) + one-shot
backfill from property_details.listing_events for pre-trigger history.
Tax reassessment forecast TX · Resets to sale price
- Current annual tax
- $6,946 · $579/mo
- Projected year-2 tax
- $6,946 · $579/mo
- Expected delta
- $0/yr ($0/mo · 0.0%)
ⓘ Screening estimate from a state-policy table — verify with the county assessor before closing.
Climate risk First Street
- Flood 1/10 Low FEMA zone X (unshaded) · 0% chance over 30 yrs
- Wildfire 4/10 Moderate
- Heat 8/10 Severe 7 d/yr ≥111°F today · 24 d/yr by 30 yrs out
- Wind 8/10 Severe 99% chance of damaging wind over 30 yrs
- Air quality 2/10 Low 2 unhealthy d/yr today · 2 by 30 yrs out
Nearby sold comps map
Loading sold comps map…
Walkable amenities ~0.75 mi
Loading nearby amenities…
Taxation est. · year 1
- Rental income
- $27,649
- − Mortgage interest
- −$16,239
- − Property taxes
- −$6,946
- − Insurance
- −$1,450
- − Repairs & maintenance
- −$2,212
- − Management
- −$2,212
- − HOA
- −$1,500
- − Depreciation
- −$8,433
- Taxable loss
- −$11,343
- Est. tax savings @ 24.0%
- +$2,722
- After-tax cash flow
- $-3,574/yr
For passive investors: Depreciation is non-cash, so a rental often shows a tax loss while cash-flowing — sheltering income. Rental losses are passive: they offset passive income freely, and up to $25,000/yr can offset ordinary (W-2) income if you actively participate and your MAGI is under $100k (phasing out to $0 by $150k); unused losses carry forward. On sale, claimed depreciation is recaptured at up to 25%, and gains may owe capital-gains tax (a 1031 exchange can defer both). Figures are a year-1 estimate at your 24.0% rate — not tax advice; consult a CPA.
Condition & rehab AI · 12 photos
This 3-bedroom, 2-bathroom home requires moderate repairs and maintenance, with potential for significant value increase through updates.
Repairs flagged
- Minor Landscaping — Some areas of the yard appear overgrown
- Minor Driveway — Some cracks in the concrete
Value-add opportunities
- Resale Paint interior walls — Fresh paint can make a home more appealing
- Both Replace carpet with hardwood flooring — Hardwood flooring is more durable and can increase both resale and rental value
- Both Landscaping and yard maintenance — A well-maintained yard can increase curb appeal and property value
Renovation cost estimate screening
| Repair item | Severity | Est. cost |
|---|---|---|
| Landscaping · Some areas of the yard appear overgrown | Minor | $500–3,000 |
| Driveway · Some cracks in the concrete | Minor | $500–3,000 |
| Total estimated repair cost · 2 items | $1,000–6,000 |
Value-add ROI direction
- Resale Paint interior walls — Fresh paint can make a home more appealing ↑
- Both Replace carpet with hardwood flooring — Hardwood flooring is more durable and can increase both resale and rental value ↑
- Both Landscaping and yard maintenance — A well-maintained yard can increase curb appeal and property value ↑
ⓘ Cost ranges are severity-bucket heuristics (US national rule-of-thumb). Get contractor quotes + a written scope before underwriting a rehab budget.
Schools (NCES district)
- District
- Magnolia ISD
- NCES district ID
- 4828740
- Math proficiency
- 42% ▼ -7.00%
- Reading proficiency
- 45% ▼ -4.00%
- Median HH income
- $71,692
- Composite
- 39.46/100
- National rank
- #3958
- State rank
- #247 of 826 in TX
Livability — Magnolia
- Score
- 73/100
- State rank
- #222
- US rank
- #5442
Category grades
Schools grade is shown separately in the Schools card above.
Census & demographics
- County
- Montgomery County · 663,713 people
- City population
- 32,847
- Metro
- Houston-The Woodlands-Sugar Land, TX
- Population (ZIP)
- 44,900
- Household income
- $112,504
- Rent vs Own
- Severe rent burden
- 586.0
Population outlook (Montgomery County) Hauer SSP2
- Today (2025)
- 713,896 people
- By 2030
- 805,263 · +12.8%
- By 2040
- 992,708 · +39.1%
- By 2050
- 1,179,590 · +65.2%
- By 2075
- 1,628,084 · +128.1%
- By 2100
- 1,937,880 · +171.5%
Race, ethnicity, and origin ACS 2023
- Neighborhood character
- Predominantly White (66%)
- Race & ethnicity
- White 66% Hispanic / Latino 25% Two or more races 18% Black 3% Asian 1%
- Hispanic origin (detail)
- Mexican 14% Puerto Rican 1%
- Common ancestry
- Lithuanian 4% Slovak 2% Italian 2%
- Foreign-born
- 11% · Canada, Vietnam
- Languages at home
- 83% English-only · Spanish 15% Other Indo-European 1% German/W. Germanic 1%
Political lean MEDSL · Montgomery
- 2024 margin
- Solid R (+45.5) · D 26.8% · R 72.3%
- 2008→2024 swing
- +7.2pp toward D · 2008: -52.7pp · 2024: -45.5pp
- All cycles
- 2024: R+45.5 2020: R+43.8 2016: R+51.4 2012: R+60.7 2008: R+52.7
Not yet ingested
- Civics
- —
Market trends
- HPI YoY
- ▲ 12.09%
- Current HPI
- 512.87
- Rent YoY
- ▲ 0.32%
- Metro
- Houston-The Woodlands-Sugar Land, TX
- State GDP YoY
- ▲ 3.95%
- F500 in state
- 110
Industry mix (Fortune 500 HQ in TX)
| Industry | F500 HQs | Revenue |
|---|---|---|
| Energy | 16 | $1,198B |
|
||
| Technology | 5 | $198B |
|
||
| Engineering / Construction | 4 | $72B |
|
||
| Energy Services | 3 | $60B |
|
||
| Utilities | 3 | $41B |
|
||
| Healthcare | 2 | $330B |
|
||
Price history
+1.5% since first listed14 events — show timeline
- 2026-06-02 Listed $289,900 HARMLS
- 2023-03-03 Sold (MLS) — HARMLS
- 2023-02-14 Pending — HARMLS
- 2023-02-14 Listed $277,890 HARMLS
- 2023-02-13 Listing Removed — HARMLS
- 2023-02-01 Price Changed $277,890 HARMLS
- 2023-01-04 Price Changed $275,890 HARMLS
- 2023-01-04 Relisted — HARMLS
- 2022-12-01 Pending — HARMLS
- 2022-11-07 Price Changed $270,990 HARMLS
- 2022-10-20 Price Changed $290,990 HARMLS
- 2022-07-12 Price Changed $290,490 HARMLS
- 2022-06-13 Price Changed $288,490 HARMLS
- 2022-06-08 Listed $285,490 HARMLS
Property tax history
+64.6%/yrLatest (2025): $6,946 · -10.6% YoY. Source: county tax records.
Cash-flow waterfall
monthlySold comps — $/sqft
last 12 mo · ≤1 miLoading sold comps…