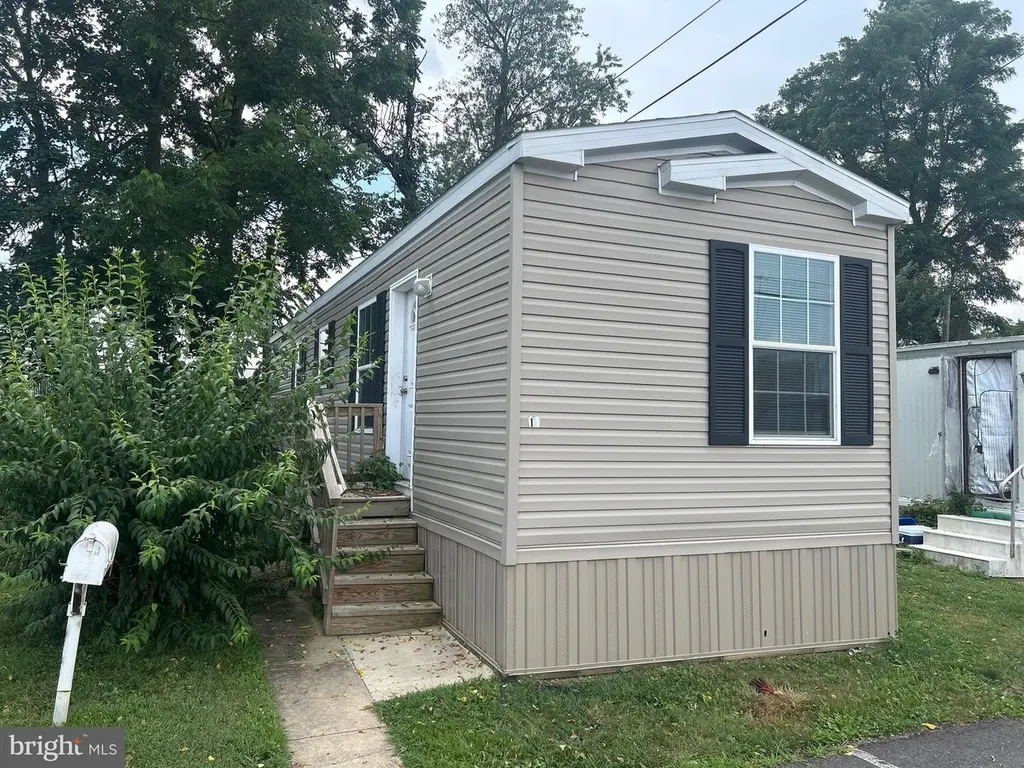
134 Lincoln Hwy #11 · Falls, PA
Flood risk 1/10 · Minimal
- FEMA flood zone
- X (unshaded)
- Chance of flooding over 30 yrs
- 0.0%
- Est. flood insurance / yr
- $507 – $1,088
Fire risk 1/10 · Minimal
- Est. fire insurance / yr
- $511 – $949
Heat risk 6/10 · Moderate
- Hot days now (above 102°F)
- 7 days/yr
- Hot days in 30 yrs
- 15 days/yr
Wind risk 6/10 · Moderate
- Chance of severe wind over 30 yrs
- 27.0%
Air-quality risk 5/10 · Moderate
- Unhealthy air days now
- 7 days/yr
- Unhealthy air days in 30 yrs
- 8 days/yr
Risk factors via First Street. Map © Google.
Why this score? — see what drove the D+ grade
The composite is a weighted blend of 9 inputs, each scored 0–100. Each bar is that input's sub-score; the figure is the points it added to the 100-point composite (weight × sub-score).
- Cash flow +15.0/30.0
- ARV discount +7.5/15.0
- Schools +5.2/10.0
- 1% rule +5.0/10.0
- DSCR +5.0/10.0
- Rent growth +2.5/5.0
- Livability +2.5/5.0
- Condition / age +2.5/5.0
- Appreciation +0.0/10.0
$35,000
🖨 Deal sheet 📄 Offer letter ✓ Due diligence
Listing remarks
Home must be removed (at the buyers expense) from the park as this will no longer be a mobile home park.
Key facts
- Built 2021
- Listed 28 days
Property features AI
Finance
- Financial info: Lease not considered
Exterior
- Utilities: Propane (leased) heating fuel; Electric service for cooling and hot water
- Home design: Manufactured single-wide home; Shingle roof
- Construction: Vinyl siding; Estimated year built; Shingle roof; Above-grade construction
- Exterior features: Not in a federal flood zone; Ground rent paid annually; No tidal water on the lot; Other above-grade structures
Interior
- Bedrooms: Two bedrooms on the main level
- Bathrooms: Two full bathrooms on the main level
- Heating & cooling: Forced air heating; Electric cooling; Electric hot water
- Interior features: Estimated living area; No basement
Neighborhood map
What this means for you Summary
Snapshot
- This is a 2-bed/2.0-bath single-family listed at $35k.
Deal economics
- At list price, monthly cash flow is $2k ($19k/yr) — positive.
- The deal already cash-flows at list — no discount required.
- Meets the 1% rule at list price ($2k rent vs $35k).
- Recommended offer: $34k (1.5% below list) — sets the bar for market timing.
Location & tenants
- Location reads: area grade D — affects rentability + tenant quality, not the cash-flow math above.
- Pennsbury SD (suburban): math 46% / reading 69% proficiency, ranked #67 of 539 in PA (top 12%) — acceptable for families but not a draw, mixed tenant base, ~2y average lease; only 15% free/reduced lunch — higher-income household profile.
- Market conditions: 33 active listings in the ZIP; 3 comparable units currently listed for rent nearby; rentals leasing fast (median 3d on market — plan ~1-2 weeks tenant-placement turnaround); solid renter incomes; 663 units permitted in Bucks County in 2024 (106 in 5+ unit buildings).
Forward outlook
- Local home prices are declining (-3.0%/yr); year-one equity from $242 of loan paydown is wiped out by about $1k of value loss. Plan a longer hold.
- Bucks County population projected to shrink 7% by 2050 — rents likely to lag national; underwrite the cash flow, not the appreciation.
- At projected returns (-3.0% appreciation + 3.0% rent growth), your $10k cash investment doubles in ~1 year — after that, you're playing with house money.
Negotiation context
- It's been on market 28 days — a 2% lower offer ($34k) is reasonable based on typical stale-listing flexibility.
- 2 sale attempts with the ask held roughly flat each time — persistent listings suggest the price (not the market) is what's stuck; bring a comps-based counter.
Risks & watch-outs
- Climate carrying-cost: major wind risk, 27% chance of damaging wind over 30y; extreme-heat days projected 7→15/yr by 2055 (HVAC capex compounding) — expect insurance premiums to compound above CPI over the hold.
Questions for the listing agent
- Is there a deadline driving the sale (1031 exchange, divorce, estate, relocation)? That informs how much negotiation room exists.
- The area grade is low — what's the realistic commute time and amenity access for the typical tenant pool here? Any planned neighborhood developments (good or bad) we should know about?
- What's the average days-on-market for RENTAL listings here right now (not sales)? A rising rental-DOM trend means longer vacancies and softer asking-rent achievability than the comps imply.
- What's the recent tenant-quality profile in this submarket — average credit score on applications, eviction rate, late-payment / NSF rate, and stable-employment percentage? A property-management company in the area should have these aggregated.
- How much new for-sale + rental construction is in the pipeline within 1–3 miles? Heavy new supply typically softens prices + rents 12–24 months out; constrained supply supports both.
Investment metrics
- 1% rule
- 6.67% ✓
- Cap rate
- 61.20%
- Cash-on-cash
- 196.11%
- DSCR
- 9.73
- GRM
- 1.2
CMA / ARV
No comps found within radius.
Projected returns pro-forma
-3.0% appreciation · 3.0% rent growth · sell at horizon
- IRR
- —
- Equity multiple
- 10.83×
- Total profit
- $96,366
- Equity at exit
- $5,219
- IRR
- —
- Equity multiple
- 22.98×
- Total profit
- $215,401
- Equity at exit
- $3,026
Cash invested: $9,800 (down + closing). Projections, not guarantees.
Landlord ↔ Tenant lean methodology
- Overall (STATE)
- 62 Landlord-Friendly
- State Pennsylvania
- 62 Landlord-Friendly · EVEN
- County
- — inherits STATE
- City
- — inherits STATE
ZIP-level market 19030
- Active inventory
- 33
- Price-to-rent
- 1.2×
Monthly cashflow live
- Estimated rent
- $2,333 medium interval (Pro) →
- Mortgage (P&I)
- −$184
- Tax est. 1.5%
- −$44 /mo · $525/yr
- Insurance
- −$15
- HOA
- −$0
- Vacancy / Maint / Mgmt
- −$490
- Net cashflow
- $1,602
Break-even live
UW: 25.0% down · 7.5% · 30yr · 1.5% tax · 5.0% vac · 8.0% maint · 8.0% mgmt
Financing live
Cash to close
- Down payment
- $8,750
- Closing costs
- $1,050
- Reserves months
- —
- Total cash needed
- —
Loan-product check · same deal, 3 products live
Conventional
25% down · 7.5% · 30yr
- Down + closing
- —
- Monthly P&I
- —
- Monthly cashflow
- —
- DSCR
- —
- Eligible?
- —
Personal DTI + credit; lowest rate.
DSCR
20% down · 8.5% · 30yr
- Down + closing
- —
- Monthly P&I
- —
- Monthly cashflow
- —
- DSCR
- —
- Eligible?
- —
No personal income docs; deal must DSCR.
Hard money
10% down · 12.0% · 12mo
- Down + closing
- —
- Monthly P&I
- —
- Monthly cashflow
- —
- DSCR
- —
- Eligible?
- —
Short-term bridge; refi at stabilization.
Rent comps 3 comps
| Address | Beds | Baths | Sqft | Rent | $/sqft | DOM | Units | Dist |
|---|---|---|---|---|---|---|---|---|
| 251 S Olds Blvd Fairless Hills, PA | 1.0–2.0 | 1.0 | 800 | $2,185 | $2.73 | 3d | 1 | 0.87mi |
| 100 Harpers Xing Langhorne, PA | 1.0–3.0 | 1.0–2.0 | 1071 | $2,722 | $2.54 | 1d | 29 | 1.31mi |
| 602 Hidden Forest Ct Fairless Hills, PA | 1.0–2.0 | 1.0 | 799 | $1,750 | $2.19 | 3d | 18 | 1.32mi |
Listing history 20 events
-
2026-06-18days on market $35,000 Active 28 DOM
-
2026-06-17days on market $35,000 Active 27 DOM
-
2026-06-16days on market $35,000 Active 26 DOM
-
2026-06-15days on market $35,000 Active 25 DOM
-
2026-06-13days on market $35,000 Active 23 DOM
-
2026-06-13days on market $35,000 Active 22 DOM
-
2026-06-09days on market $35,000 Active 19 DOM
-
2026-06-08days on market $35,000 Active 18 DOM
-
2026-06-07days on market $35,000 Active 17 DOM
-
2026-06-04days on market $35,000 Active 14 DOM
-
2026-06-03days on market $35,000 Active 13 DOM
-
2026-06-02days on market $35,000 Active 12 DOM
-
2026-06-01days on market $35,000 Active 11 DOM
-
2026-05-31days on market $35,000 Active 10 DOM
-
2026-05-21$35,000 Active
-
2026-02-01historical
-
2025-12-16price $45,000
-
2025-10-24price $47,000
-
2025-09-05price $65,000
-
2025-08-09$85,000 Active
ⓘ Source: listings_history table (triggers on properties + properties_extension) + one-shot
backfill from property_details.listing_events for pre-trigger history.
Climate risk First Street
- Flood 1/10 Low FEMA zone X (unshaded) · 0% chance over 30 yrs
- Wildfire 1/10 Low
- Heat 6/10 Major 7 d/yr ≥102°F today · 15 d/yr by 30 yrs out
- Wind 6/10 Major 27% chance of damaging wind over 30 yrs
- Air quality 5/10 Major 7 unhealthy d/yr today · 8 by 30 yrs out
Nearby sold comps map
Loading sold comps map…
Walkable amenities ~0.75 mi
Loading nearby amenities…
Taxation est. · year 1
- Rental income
- $28,001
- − Mortgage interest
- −$1,961
- − Property taxes
- −$525
- − Insurance
- −$175
- − Repairs & maintenance
- −$2,240
- − Management
- −$2,240
- − Depreciation
- −$1,018
- Taxable income
- $19,842
- Est. tax owed @ 24.0%
- −$4,762
- After-tax cash flow
- $14,456/yr
For passive investors: Depreciation is non-cash, so a rental often shows a tax loss while cash-flowing — sheltering income. Rental losses are passive: they offset passive income freely, and up to $25,000/yr can offset ordinary (W-2) income if you actively participate and your MAGI is under $100k (phasing out to $0 by $150k); unused losses carry forward. On sale, claimed depreciation is recaptured at up to 25%, and gains may owe capital-gains tax (a 1031 exchange can defer both). Figures are a year-1 estimate at your 24.0% rate — not tax advice; consult a CPA.
Schools (NCES district)
- District
- Pennsbury SD
- NCES district ID
- 4218840
- Math proficiency
- 46% ▼ -13.00%
- Reading proficiency
- 69% ▼ -8.00%
- Median HH income
- $85,495
- Composite
- 52.3/100
- National rank
- #1594
- State rank
- #67 of 539 in PA
Livability — Falls
No livability data for this city. (Only ~50 U.S. cities are tracked.)
Census & demographics
- Census place
- Fairless Hills, PA
- County
- Bucks County · 506,477 people
- Metro
- Philadelphia-Camden-Wilmington, PA-NJ-DE-MD
- Population (ZIP)
- 12,305
- Household income
- $96,603
- Rent vs Own
- Severe rent burden
- 377.0
Population outlook (Bucks County) Hauer SSP2
- Today (2025)
- 630,973 people
- By 2030
- 627,093 · -0.6%
- By 2040
- 609,680 · -3.4%
- By 2050
- 584,225 · -7.4%
- By 2075
- 539,840 · -14.4%
- By 2100
- 483,970 · -23.3%
Race, ethnicity, and origin ACS 2023
- Neighborhood character
- Predominantly White (85%)
- Race & ethnicity
- White 85% Hispanic / Latino 5% Black 5% Asian 4% Two or more races 3%
- Common ancestry
- Romanian 8% Scotch-Irish 3% Lithuanian 2%
- Foreign-born
- 9% · Canada, South Korea
- Languages at home
- 89% English-only · Other Indo-European 4% Spanish 2% Russian/Polish/Slavic 2%
Political lean MEDSL · Bucks
- 2024 margin
- Toss-up / Even · D 49.5% · R 49.5%
- 2008→2024 swing
- -8.7pp toward R · 2008: 8.7pp · 2024: -0.1pp
- All cycles
- 2024: R+0.1 2020: D+4.4 2016: D+0.6 2012: D+1.2 2008: D+8.7
Not yet ingested
- Civics
- —
Market trends
- HPI YoY
- ▼ -219.91%
- Current HPI
- 309.8975
- Rent YoY
- —
- Metro
- Philadelphia-Camden-Wilmington, PA-NJ-DE-MD
- State GDP YoY
- ▲ 1.68%
- F500 in state
- 34
Industry mix (Fortune 500 HQ in PA)
| Industry | F500 HQs | Revenue |
|---|---|---|
| Healthcare | 2 | $309B |
|
||
| Insurance | 2 | $27B |
|
||
| Telecommunications / Media | 1 | $124B |
|
||
| Industrial Distribution | 1 | $22B |
|
||
| Financial Services | 1 | $20B |
|
||
| Chemicals / Materials | 1 | $18B |
|
||
Price history
-58.8% since first listed6 events — show timeline
- 2026-05-21 Listed $35,000 BRIGHT MLS
- 2026-02-01 Listing Removed — BRIGHT MLS
- 2025-12-16 Price Changed $45,000 BRIGHT MLS
- 2025-10-24 Price Changed $47,000 BRIGHT MLS
- 2025-09-05 Price Changed $65,000 BRIGHT MLS
- 2025-08-09 Listed $85,000 BRIGHT MLS
Cash-flow waterfall
monthlySold comps — $/sqft
last 12 mo · ≤1 miLoading sold comps…