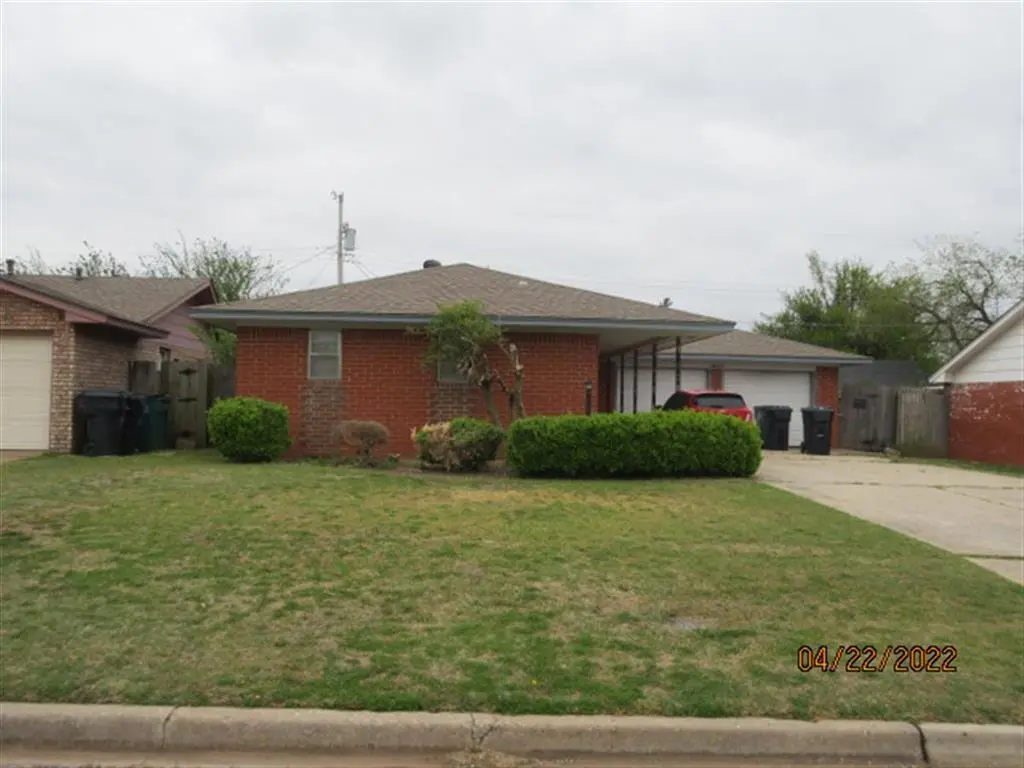
1400 NW 107 St · Oklahoma City, OK
Flood risk 1/10 · Minimal
- FEMA flood zone
- X (unshaded)
- Chance of flooding over 30 yrs
- 0.0%
- Est. flood insurance / yr
- $507 – $1,088
Fire risk 1/10 · Minimal
- Est. fire insurance / yr
- $2,463 – $4,575
Heat risk 6/10 · Moderate
- Hot days now (above 107°F)
- 7 days/yr
- Hot days in 30 yrs
- 19 days/yr
Wind risk 2/10 · Minimal
- Chance of severe wind over 30 yrs
- 2.0%
Air-quality risk 2/10 · Minimal
- Unhealthy air days now
- 2 days/yr
- Unhealthy air days in 30 yrs
- 2 days/yr
Risk factors via First Street. Map © Google.
Why this score? — see what drove the C- grade
The composite is a weighted blend of 9 inputs, each scored 0–100. Each bar is that input's sub-score; the figure is the points it added to the 100-point composite (weight × sub-score).
- Cash flow +18.1/30.0
- ARV discount +15.0/15.0
- DSCR +5.7/10.0
- 1% rule +4.3/10.0
- Livability +4.0/5.0
- Rent growth +3.4/5.0
- Condition / age +2.5/5.0
- Schools +0.7/10.0
- Appreciation +0.0/10.0
$150,000
🖨 Deal sheet 📄 Offer letter ✓ Due diligence
Listing remarks MLS
Nice home, convenient to most locations in the Metro. Open living with moc-fireplace. Inside utility closet. "TO BE SOLD AS IS" Has a Reverse Mortgage. So time is needed for approval..
Key facts
- Moc-fireplace
- Open living
- Some updating
Tags
Neighborhood map
What this means for you Summary
Snapshot
- This is a 2-bed/2.0-bath single-family listed at $150k.
Deal economics
- At list price, monthly cash flow is $132 ($2k/yr) — positive.
- The deal already cash-flows at list — no discount required.
- To meet the 1% rule (rent ≥ 1% of price), the offer needs to be $139k (7.1% below list).
- Recommended offer: $132k (12.0% below list) — sets the bar for market timing.
- Cap rate 7.4% vs local median 3.7% in Oklahoma City — top-decile yield for the area; either an underpriced asset or a hidden risk that comps aren't pricing in. Stress-test before assuming the spread holds.
Location & tenants
- Location reads 80/100 on livability (#3 in OK, #1,635 nationally) — a professional / high-income tenant draw. Strengths: amenities A+, commute A+, cost of living A+; Watch: schools F, crime F.
- Oklahoma City (urban): math 7% / reading 10% proficiency, ranked #254 of 270 in OK (top 94%) — low school quality limits family demand, transient renter base, plan for 1-2y turnover; 82% free/reduced lunch — lower-income household profile, screen leases tightly.
- Market conditions: Rents rising (+3.5%/yr); 145 active listings in the ZIP; 40 comparable units currently listed for rent nearby; rentals at typical pace (median 24d on market — plan ~3-4 weeks tenant-placement turnaround); 40% of comp listings sitting > 30 days — soft ceiling on asking rent; 5,365 units permitted in Oklahoma County in 2024 (569 in 5+ unit buildings).
- This rent runs 30% of the median local income ($55k/yr) — at the standard rent-burdened threshold; future hikes will face affordability resistance.
Forward outlook
- Local home prices are declining (-3.0%/yr); year-one equity from $1k of loan paydown is wiped out by about $4k of value loss. Plan a longer hold.
- Oklahoma County population projected at +41% by 2050 — long-run rental-demand tailwind backs the buy-and-hold thesis.
Negotiation context
- It's been on market 183 days — a 12% lower offer ($132k) is reasonable based on typical stale-listing flexibility.
- 4 sale attempts; this cycle's ask has dropped $39k (21%) from the opening price — seller is motivated, your offer sets the floor, not the list.
- Current owner paid $39k; list at $150k implies a 285% gain — meaningful room to come down on a strong offer.
Risks & watch-outs
- Climate carrying-cost: extreme-heat days projected 7→19/yr by 2055 (HVAC capex compounding) — expect insurance premiums to compound above CPI over the hold.
Questions for the listing agent
- It's been on market 183 days. Have you received any prior offers? Is the seller open to a 12% concession, seller financing, or rate buy-down credit?
- Built in 1971 — when were the roof, HVAC, electrical panel, plumbing, and water heater last replaced?
- Why hasn't it sold? Are there any deal-killer items the seller is aware of (foundation, flood, title, zoning, code violations)?
- Is there a deadline driving the sale (1031 exchange, divorce, estate, relocation)? That informs how much negotiation room exists.
- Schools are F-rated, which usually means shorter tenancies and higher turnover. Who's the typical renter profile here, and what's been the actual vacancy rate?
- Crime grade is F in this area — have there been break-ins, vandalism, or insurance claims at this property in the last 3 years? What carrier currently insures it and at what premium?
- What's the average days-on-market for RENTAL listings here right now (not sales)? A rising rental-DOM trend means longer vacancies and softer asking-rent achievability than the comps imply.
- What's the recent tenant-quality profile in this submarket — average credit score on applications, eviction rate, late-payment / NSF rate, and stable-employment percentage? A property-management company in the area should have these aggregated.
- How much new for-sale + rental construction is in the pipeline within 1–3 miles? Heavy new supply typically softens prices + rents 12–24 months out; constrained supply supports both.
Investment metrics
- 1% rule
- 0.93% ✗
- Cap rate
- 7.35%
- Cash-on-cash
- 3.79%
- DSCR
- 1.17
- GRM
- 9.0
CMA / ARV
- ARV (median comp)
- $192,563
- List price
- $150,000
- Delta
- -22.10%
- Verdict
- UNDERPRICED
- Comps
- 20 within 1.0 mi
Show comp detail 12 sales within ~0.75 mi
| Address | Dist | Beds/Ba | Sqft | Sold | Price | $/sf | Match |
|---|---|---|---|---|---|---|---|
| 10144 Wimbledon Ct | 0.31mi | 3/2.0 (+1) | 1,347 (-3%) | 2mo | $228,000 | $169 | 74 |
| 10207 Sussex Pl | 0.40mi | 3/2.0 (+1) | 1,413 (+2%) | 1mo | $233,000 | $165 | 72 |
| 9917 Essex Ave | 0.60mi | 3/2.0 (+1) | 1,375 (-1%) | 0mo | $195,000 | $142 | 65 |
| 11209 Bel Air Pl | 0.38mi | 3/2.0 (+1) | 1,483 (+7%) | 2mo | $130,000 | $88 | 64 |
| 1701 Gladstone Ter | 0.54mi | 3/2.0 (+1) | 1,440 (+4%) | 2mo | $255,000 | $177 | 61 |
| 10237 Stoneham Ave | 0.52mi | 3/2.0 (+1) | 1,479 (+7%) | 1mo | $244,500 | $165 | 59 |
| 2017 Plymouth Ln | 0.59mi | 3/2.0 (+1) | 1,326 (-4%) | 2mo | $153,000 | $115 | 59 |
| 636 NW 112th St | 0.72mi | 3/2.0 (+1) | 1,402 (+1%) | 0mo | $199,000 | $142 | 59 |
| 1037 NW 100th St | 0.61mi | 3/2.0 (+1) | 1,311 (-5%) | 2mo | $98,500 | $75 | 56 |
| 11524 N Florida Ave | 0.55mi | 3/2.0 (+1) | 1,508 (+9%) | 2mo | $205,000 | $136 | 53 |
| 1221 NW 97th St | 0.70mi | 3/2.0 (+1) | 1,464 (+6%) | 2mo | $265,000 | $181 | 51 |
| 712 NW 110th St | 0.61mi | 3/2.0 (+1) | 1,568 (+13%) | 2mo | $279,000 | $178 | 43 |
Match score weights: distance 35% · size 25% · config 20% · recency 20%. Top-matched comps best support the ARV.
Projected returns pro-forma
-3.0% appreciation · 3.47% rent growth · sell at horizon
- IRR
- -9.9%
- Equity multiple
- 0.64×
- Total profit
- $-15,228
- Equity at exit
- $22,365
- IRR
- 0.1%
- Equity multiple
- 1.01×
- Total profit
- $263
- Equity at exit
- $12,969
Cash invested: $42,000 (down + closing). Projections, not guarantees.
Landlord ↔ Tenant lean methodology
- Overall (STATE)
- 83 Strongly Landlord-Friendly
- State Oklahoma
- 83 Strongly Landlord-Friendly · R+20
- County
- — inherits STATE
- City
- — inherits STATE
ZIP-level market 73114
- Home prices YoY
- -12.5%
- Rents YoY
- 3.5%
- Active inventory
- 145
- Price-to-rent
- 9.0×
Monthly cashflow live
- Estimated rent
- $1,394 high interval (Pro) →
- Mortgage (P&I)
- −$787
- Tax from tax record
- −$119 /mo · $1,432/yr
- Insurance
- −$62
- HOA
- −$0
- Vacancy / Maint / Mgmt
- −$293
- Net cashflow
- $132
Break-even live
UW: 25.0% down · 7.5% · 30yr · 1.5% tax · 5.0% vac · 8.0% maint · 8.0% mgmt
Financing live
Cash to close
- Down payment
- $37,500
- Closing costs
- $4,500
- Reserves months
- —
- Total cash needed
- —
Loan-product check · same deal, 3 products live
Conventional
25% down · 7.5% · 30yr
- Down + closing
- —
- Monthly P&I
- —
- Monthly cashflow
- —
- DSCR
- —
- Eligible?
- —
Personal DTI + credit; lowest rate.
DSCR
20% down · 8.5% · 30yr
- Down + closing
- —
- Monthly P&I
- —
- Monthly cashflow
- —
- DSCR
- —
- Eligible?
- —
No personal income docs; deal must DSCR.
Hard money
10% down · 12.0% · 12mo
- Down + closing
- —
- Monthly P&I
- —
- Monthly cashflow
- —
- DSCR
- —
- Eligible?
- —
Short-term bridge; refi at stabilization.
Rent comps 40 comps
| Address | Beds | Baths | Sqft | Rent | $/sqft | DOM | Units | Dist |
|---|---|---|---|---|---|---|---|---|
| 1413 NW 106th St Oklahoma City, OK | 3.0 | 2.0 | 1345 | $1,495 | $1.11 | 43d | 1 | 0.04mi |
| 10905 N Brauer Ave Oklahoma City, OK | 3.0 | 1.5 | 1424 | $1,505 | $1.06 | 43d | 1 | 0.11mi |
| 1301 W Hefner Rd Oklahoma City, OK | 1.0–2.0 | 1.0–2.0 | 898 | $1,310 | $1.46 | 1d | 14 | 0.15mi |
| 10517 N McKinley Ave Oklahoma City, OK | 3.0 | 1.5 | 1219 | $1,695 | $1.39 | 3d | 1 | 0.17mi |
| 1209 W Hefner Rd Oklahoma City, OK | 1.0–2.0 | 1.0–1.5 | 852 | $1,029 | $1.21 | 23d | 3 | 0.25mi |
| 11204 Burnham Ave Oklahoma City, OK | 3.0 | 2.0 | 1335 | $1,545 | $1.16 | 43d | 1 | 0.27mi |
| 11220 Burnham Ave Unit 11222 Oklahoma City, OK | 3.0 | 2.0 | 1350 | $1,600 | $1.19 | 23d | 1 | 0.32mi |
| 10735 N Western Ave Oklahoma City, OK | 1.0–3.0 | 1.0–2.5 | 995 | $974 | $0.98 | 43d | 64 | 0.32mi |
| 10735 N Western Ave Unit 10727H Oklahoma City, OK | 2.0 | 2.0 | 935 | $949 | $1.01 | 23d | 1 | 0.32mi |
| 10735 N Western Ave Unit 10743C Oklahoma City, OK | 2.0 | 2.0 | 935 | $949 | $1.01 | 2d | 1 | 0.32mi |
| 10735 N Western Ave Oklahoma City, OK | 3.0 | 2.5 | 1250 | $1,149 | $0.92 | 21d | 1 | 0.32mi |
| 11308 Bel Air Pl Oklahoma City, OK | 3.0 | 2.0 | 1590 | $1,695 | $1.07 | 43d | 1 | 0.42mi |
| 11411 University Oklahoma City, OK | 3.0 | 2.0 | 1216 | $1,550 | $1.27 | 16d | 1 | 0.43mi |
| 11508 University Oklahoma City, OK | 3.0 | 2.0 | 1216 | $1,645 | $1.35 | 3d | 1 | 0.43mi |
| 1101 NW 103rd St Oklahoma City, OK | 3.0 | 2.0 | 1232 | $1,425 | $1.16 | 2d | 1 | 0.44mi |
| 11415 University Oklahoma City, OK | 3.0 | 2.0 | 1216 | $1,545 | $1.27 | 43d | 1 | 0.48mi |
| 11420 University Oklahoma City, OK | 3.0 | 2.0 | 1216 | $1,545 | $1.27 | 43d | 1 | 0.48mi |
| 11409 University Oklahoma City, OK | 3.0 | 2.0 | 1216 | $1,550 | $1.27 | 23d | 1 | 0.48mi |
| 1720 Castle St Oklahoma City, OK | 3.0 | 2.0 | 1428 | $1,800 | $1.26 | 43d | 1 | 0.48mi |
| 839 NW 111th St Unit 839 Oklahoma City, OK | 1.0 | 1.5 | 1121 | $1,075 | $0.96 | 23d | 1 | 0.51mi |
| 829 NW 111th St Oklahoma City, OK | 2.0 | 2.0 | 1500 | $1,200 | $0.80 | 14d | 1 | 0.52mi |
| 10104 Haverhill Pl Oklahoma City, OK | 3.0 | 2.0 | 1188 | $1,550 | $1.30 | 14d | 1 | 0.54mi |
| 910 NW 101st St Oklahoma City, OK | 3.0 | 1.0 | 1100 | $1,400 | $1.27 | 1d | 1 | 0.62mi |
| 1800 NW 115th St Oklahoma City, OK | 1.0–3.0 | 1.0–2.0 | 1019 | $1,705 | $1.67 | 2d | 8 | 0.64mi |
| 2000 Lanesboro Dr Oklahoma City, OK | 3.0 | 2.0 | 1236 | $1,550 | $1.25 | 43d | 1 | 0.67mi |
| 9721 Georgia Ave Oklahoma City, OK | 3.0 | 2.0 | 1442 | $1,685 | $1.17 | 3d | 1 | 0.73mi |
| 911 NW 98th St Oklahoma City, OK | 3.0 | 1.0 | 1122 | $1,100 | $0.98 | 1d | 1 | 0.74mi |
| 609 NW 110th St Oklahoma City, OK | 3.0 | 2.0 | 1178 | $1,345 | $1.14 | 23d | 1 | 0.75mi |
| 912 NW 98th St Oklahoma City, OK | 3.0 | 1.0 | 1364 | $1,250 | $0.92 | 43d | 1 | 0.75mi |
| 10125 N Pennsylvania Ave The Village, OK | 2.0 | 3.0 | 1680 | $1,295 | $0.77 | 43d | 1 | 0.77mi |
| 645 NW 113th St Oklahoma City, OK | 3.0 | 2.0 | 1321 | $1,395 | $1.06 | 23d | 1 | 0.78mi |
| 1417 NW 95th St Oklahoma City, OK | 2.0 | 1.0 | 916 | $1,085 | $1.18 | 23d | 1 | 0.78mi |
| 11239 N Pennsylvania Ave Oklahoma City, OK | 1.0–2.0 | 1.0–2.0 | 850 | $1,155 | $1.36 | 3d | 30 | 0.80mi |
| 11713 N Francis Ave Oklahoma City, OK | 3.0 | 2.0 | 1475 | $1,430 | $0.97 | 43d | 1 | 0.82mi |
| 11800 N Western Ave Unit 302 Oklahoma City, OK | 2.0 | 2.0 | 960 | $1,006 | $1.05 | 3d | 1 | 0.83mi |
| 11800 N Western Ave Unit 210 Oklahoma City, OK | 3.0 | 2.0 | 1120 | $1,160 | $1.04 | 3d | 1 | 0.83mi |
| 11800 N Western Ave Apt 919 Oklahoma City, OK | 3.0 | 2.0 | 1120 | $1,160 | $1.04 | 43d | 1 | 0.83mi |
| 11800 N Western Ave Apt 205 Oklahoma City, OK | 3.0 | 2.0 | 1120 | $1,100 | $0.98 | 43d | 1 | 0.83mi |
| 11800 N Western Ave Apt 601 Oklahoma City, OK | 2.0 | 2.0 | 960 | $1,006 | $1.05 | 43d | 1 | 0.83mi |
| 11800 N Western Ave Oklahoma City, OK | 3.0 | 2.0 | 1120 | $1,160 | $1.04 | 43d | 1 | 0.83mi |
Listing history 21 events
-
2026-06-17days on market $150,000 Active 183 DOM
-
2026-06-16days on market $150,000 Active 182 DOM
-
2026-06-15days on market $150,000 Active 181 DOM
-
2026-06-13days on market $150,000 Active 179 DOM
-
2026-06-09days on market $150,000 Active 175 DOM
-
2026-06-08days on market $150,000 Active 174 DOM
-
2026-06-07days on market $150,000 Active 173 DOM
-
2026-06-05days on market $150,000 Active 170 DOM
-
2026-06-03days on market $150,000 Active 169 DOM
-
2026-06-02days on market $150,000 Active 168 DOM
-
2026-06-01days on market $150,000 Active 167 DOM
-
2026-05-31days on market $150,000 Active 166 DOM
-
2026-04-13status Active 199-char remark
Show marketing remark (199 chars)
Nice home, convenient to most locations in the Metro. Open living with moc-fireplace. Inside utility closet. "TO BE SOLD AS IS" Has a Reverse Mortgage. So time is needed for approval..
-
2026-03-30historical 199-char remark
Show marketing remark (199 chars)
Nice home, convenient to most locations in the Metro. Open living with moc-fireplace. Inside utility closet. "TO BE SOLD AS IS" Has a Reverse Mortgage. So time is needed for approval..
-
2026-03-28status Active 199-char remark
Show marketing remark (199 chars)
Nice home, convenient to most locations in the Metro. Open living with moc-fireplace. Inside utility closet. "TO BE SOLD AS IS" Has a Reverse Mortgage. So time is needed for approval..
-
2026-02-20status Pending 199-char remark
Show marketing remark (199 chars)
Nice home, convenient to most locations in the Metro. Open living with moc-fireplace. Inside utility closet. "TO BE SOLD AS IS" Has a Reverse Mortgage. So time is needed for approval..
-
2026-01-09status Active 199-char remark
Show marketing remark (199 chars)
Nice home, convenient to most locations in the Metro. Open living with moc-fireplace. Inside utility closet. "TO BE SOLD AS IS" Has a Reverse Mortgage. So time is needed for approval..
-
2025-12-11status Pending 199-char remark
Show marketing remark (199 chars)
Nice home, convenient to most locations in the Metro. Open living with moc-fireplace. Inside utility closet. "TO BE SOLD AS IS" Has a Reverse Mortgage. So time is needed for approval..
-
2025-11-11price $150,000 199-char remark
Show marketing remark (199 chars)
Nice home, convenient to most locations in the Metro. Open living with moc-fireplace. Inside utility closet. "TO BE SOLD AS IS" Has a Reverse Mortgage. So time is needed for approval..
-
2025-09-24$189,000 Active 199-char remark
Show marketing remark (199 chars)
Nice home, convenient to most locations in the Metro. Open living with moc-fireplace. Inside utility closet. "TO BE SOLD AS IS" Has a Reverse Mortgage. So time is needed for approval..
-
1996-01-22soldstatus $39,000
ⓘ Source: listings_history table (triggers on properties + properties_extension) + one-shot
backfill from property_details.listing_events for pre-trigger history.
Tax reassessment forecast OK · Resets to sale price
- Current annual tax
- $1,432 · $119/mo
- Projected year-2 tax
- $1,432 · $119/mo
- Expected delta
- $0/yr ($0/mo · 0.0%)
ⓘ Screening estimate from a state-policy table — verify with the county assessor before closing.
Climate risk First Street
- Flood 1/10 Low FEMA zone X (unshaded) · 0% chance over 30 yrs
- Wildfire 1/10 Low
- Heat 6/10 Major 7 d/yr ≥107°F today · 19 d/yr by 30 yrs out
- Wind 2/10 Low 2% chance of damaging wind over 30 yrs
- Air quality 2/10 Low 2 unhealthy d/yr today · 2 by 30 yrs out
Nearby sold comps map
Loading sold comps map…
Walkable amenities ~0.75 mi
Loading nearby amenities…
Taxation est. · year 1
- Rental income
- $16,722
- − Mortgage interest
- −$8,402
- − Property taxes
- −$1,432
- − Insurance
- −$750
- − Repairs & maintenance
- −$1,338
- − Management
- −$1,338
- − Depreciation
- −$4,364
- Taxable loss
- −$901
- Est. tax savings @ 24.0%
- +$216
- After-tax cash flow
- $1,806/yr
For passive investors: Depreciation is non-cash, so a rental often shows a tax loss while cash-flowing — sheltering income. Rental losses are passive: they offset passive income freely, and up to $25,000/yr can offset ordinary (W-2) income if you actively participate and your MAGI is under $100k (phasing out to $0 by $150k); unused losses carry forward. On sale, claimed depreciation is recaptured at up to 25%, and gains may owe capital-gains tax (a 1031 exchange can defer both). Figures are a year-1 estimate at your 24.0% rate — not tax advice; consult a CPA.
Schools (NCES district)
- District
- Oklahoma City
- NCES district ID
- 4022770
- Math proficiency
- 7% ▼ -5.00%
- Reading proficiency
- 10% ▼ -6.00%
- Median HH income
- $35,606
- Composite
- 7.0/100
- National rank
- #9970
- State rank
- #254 of 270 in OK
Livability — Oklahoma City
- Score
- 80/100
- State rank
- #3
- US rank
- #1635
Category grades
Schools grade is shown separately in the Schools card above.
Census & demographics
- Census place
- Oklahoma City, OK
- County
- Oklahoma County · 771,644 people
- City population
- 498,656
- Metro
- Oklahoma City, OK
- Population (ZIP)
- 17,656
- Household income
- $54,936
- Rent vs Own
- Severe rent burden
- 1035.0
Population outlook (Oklahoma County) Hauer SSP2
- Today (2025)
- 911,875 people
- By 2030
- 982,413 · +7.7%
- By 2040
- 1,130,468 · +24.0%
- By 2050
- 1,288,422 · +41.3%
- By 2075
- 1,711,482 · +87.7%
- By 2100
- 2,088,448 · +129.0%
Race, ethnicity, and origin ACS 2023
- Neighborhood character
- Highly diverse neighborhood (Simpson 0.71)
- Race & ethnicity
- Black 41% White 29% Hispanic / Latino 20% Two or more races 12% Native American 3%
- Hispanic origin (detail)
- Mexican 16% Puerto Rican 1%
- Common ancestry
- Russian 1% Slovak 1% Italian 1%
- Foreign-born
- 12% · Canada, Jamaica
- Languages at home
- 78% English-only · Spanish 18%
Political lean MEDSL · Oklahoma
- 2024 margin
- Toss-up / Even · D 48.0% · R 49.7% · Other 2.3%
- 2008→2024 swing
- +15.1pp toward D · 2008: -16.8pp · 2024: -1.7pp
- All cycles
- 2024: R+1.7 2020: R+1.1 2016: R+10.5 2012: R+16.7 2008: R+16.8
Not yet ingested
- Civics
- —
Market trends
- HPI YoY
- ▼ -44.26%
- Current HPI
- 310.4705
- Rent YoY
- ▲ 3.47%
- Metro
- Oklahoma City, OK
- State GDP YoY
- ▲ 1.55%
- F500 in state
- 6
Industry mix (Fortune 500 HQ in OK)
| Industry | F500 HQs | Revenue |
|---|---|---|
| Energy | 3 | $48B |
|
||
Price history
+284.6% since first listed9 events — show timeline
- 2026-04-13 Relisted — MLSOK
- 2026-03-30 Listing Removed — MLSOK
- 2026-03-28 Relisted — MLSOK
- 2026-02-20 Pending — MLSOK
- 2026-01-09 Relisted — MLSOK
- 2025-12-11 Pending — MLSOK
- 2025-11-11 Price Changed $150,000 MLSOK
- 2025-09-24 Listed $189,000 MLSOK
- 1996-01-22 Sold (Public Records) $39,000 Public Records
Property tax history
+2.9%/yrLatest (2025): $1,432 · +2.4% YoY. Source: county tax records.
Cash-flow waterfall
monthlySold comps — $/sqft
last 12 mo · ≤1 miLoading sold comps…