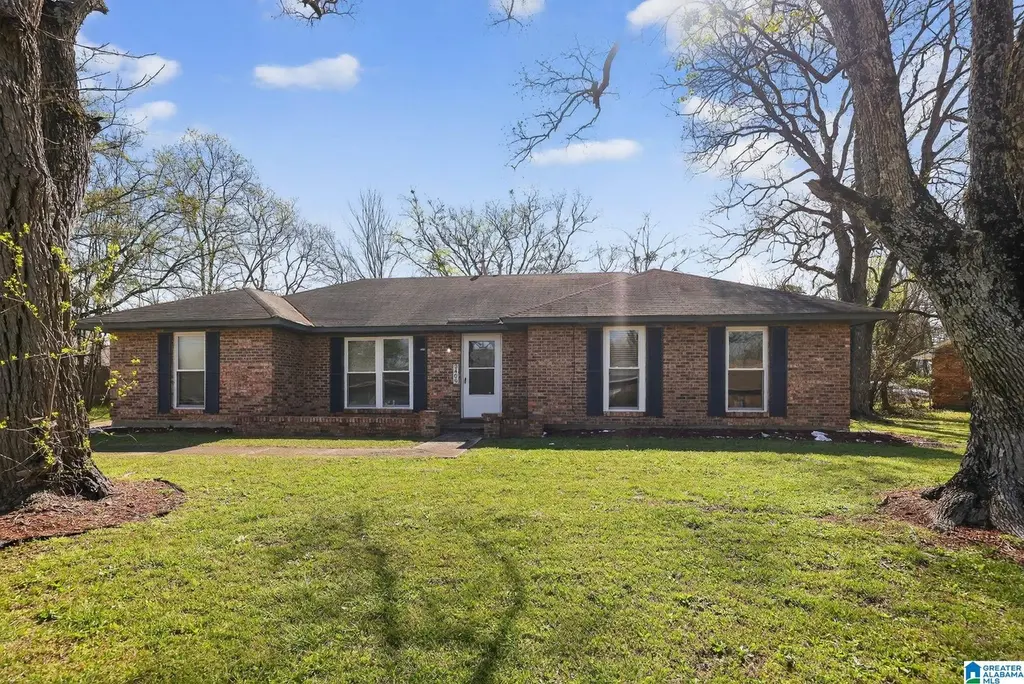
3409 Woodpark Dr · Montgomery, AL
Flood risk 1/10 · Minimal
- FEMA flood zone
- X (unshaded)
- Chance of flooding over 30 yrs
- 0.0%
- Est. flood insurance / yr
- $507 – $1,088
Fire risk 2/10 · Minimal
- Est. fire insurance / yr
- $916 – $1,700
Heat risk 7/10 · Major
- Hot days now (above 108°F)
- 7 days/yr
- Hot days in 30 yrs
- 20 days/yr
Wind risk 8/10 · Major
- Chance of severe wind over 30 yrs
- 80.0%
Air-quality risk 2/10 · Minimal
- Unhealthy air days now
- 1 days/yr
- Unhealthy air days in 30 yrs
- 1 days/yr
Risk factors via First Street. Map © Google.
Why this score? — see what drove the C grade
The composite is a weighted blend of 9 inputs, each scored 0–100. Each bar is that input's sub-score; the figure is the points it added to the 100-point composite (weight × sub-score).
- Cash flow +25.5/30.0
- DSCR +8.4/10.0
- ARV discount +7.2/15.0
- 1% rule +6.1/10.0
- Rent growth +3.9/5.0
- Livability +3.2/5.0
- Condition / age +2.5/5.0
- Schools +1.7/10.0
- Appreciation +0.0/10.0
$139,900
🖨 Deal sheet 📄 Offer letter ✓ Due diligence
Listing remarks MLS
Discover this classic 4-bedroom, 2-bathroom brick-front home offering 1,789 sq. ft. of versatile living space. The interior features hardwood flooring throughout, beginning with a well sized formal living room that flows through the formal foyer entry way into an expansive 13x21 family room complete with custom built-ins and a masonry brick fireplace. The kitchen includes a 7x9 breakfast nook that leads directly to a dedicated 7x9 laundry room for added convenience. The primary suite offers a private full bathroom. Situated on a level lot with mature trees, the exterior provides a paved driveway for off-street parking. Built in 1980, this well-maintained residence combines traditional charm with functional design.
Key facts
- 0.35 acre lot
- Built 1980
- Listed 84 days
Neighborhood map
What this means for you Summary
Snapshot
- This is a 4-bed/2.0-bath single-family listed at $140k.
Deal economics
- At list price, monthly cash flow is $324 ($4k/yr) — positive.
- The deal already cash-flows at list — no discount required.
- Meets the 1% rule at list price ($2k rent vs $140k).
- Recommended offer: $132k (6.0% below list) — sets the bar for market timing.
- Cap rate 9.1% vs local median 6.0% in Montgomery — top-decile yield for the area; either an underpriced asset or a hidden risk that comps aren't pricing in. Stress-test before assuming the spread holds.
Location & tenants
- Location reads 65/100 on livability (#138 in AL) — a middle-class / working-renter tenant base. Strengths: cost of living A+, housing A+; Watch: schools C-, employment D, crime F.
- Montgomery County (urban): math 9% / reading 31% proficiency, ranked #106 of 129 in AL (top 82%) — low school quality limits family demand, transient renter base, plan for 1-2y turnover; 70% free/reduced lunch — lower-income household profile, screen leases tightly.
- Market conditions: Rents rising fast (+5.7%/yr); 293 active listings in the ZIP; 13 comparable units currently listed for rent nearby; rentals lingering (median 44d on market — plan ~5-8 weeks vacancy on turnover, expect pricing pressure); 62% of comp listings sitting > 30 days — soft ceiling on asking rent; 460 units permitted in Montgomery County in 2024 (37 in 5+ unit buildings).
- This rent runs 34% of the median local income ($55k/yr) — at the standard rent-burdened threshold; future hikes will face affordability resistance.
Forward outlook
- Local home prices are declining (-3.0%/yr); year-one equity from $967 of loan paydown is wiped out by about $4k of value loss. Plan a longer hold.
- Montgomery County population projected to shrink 8% by 2050 — rents likely to lag national; underwrite the cash flow, not the appreciation.
- At projected returns (-3.0% appreciation + 5.7% rent growth), your $39k cash investment doubles in ~9 years — after that, you're playing with house money.
Negotiation context
- It's been on market 84 days — a 6% lower offer ($132k) is reasonable based on typical stale-listing flexibility.
Risks & watch-outs
- Climate carrying-cost: severe wind risk, 80% chance of damaging wind over 30y; extreme-heat days projected 7→20/yr by 2055 (HVAC capex compounding) — expect insurance premiums to compound above CPI over the hold.
Questions for the listing agent
- It's been on market 84 days. Have you received any prior offers? Is the seller open to a 6% concession, seller financing, or rate buy-down credit?
- Why hasn't it sold? Are there any deal-killer items the seller is aware of (foundation, flood, title, zoning, code violations)?
- Is there a deadline driving the sale (1031 exchange, divorce, estate, relocation)? That informs how much negotiation room exists.
- Crime grade is F in this area — have there been break-ins, vandalism, or insurance claims at this property in the last 3 years? What carrier currently insures it and at what premium?
- What's the average days-on-market for RENTAL listings here right now (not sales)? A rising rental-DOM trend means longer vacancies and softer asking-rent achievability than the comps imply.
- What's the recent tenant-quality profile in this submarket — average credit score on applications, eviction rate, late-payment / NSF rate, and stable-employment percentage? A property-management company in the area should have these aggregated.
- How much new for-sale + rental construction is in the pipeline within 1–3 miles? Heavy new supply typically softens prices + rents 12–24 months out; constrained supply supports both.
Investment metrics
- 1% rule
- 1.11% ✓
- Cap rate
- 9.08%
- Cash-on-cash
- 9.94%
- DSCR
- 1.44
- GRM
- 7.5
CMA / ARV
- ARV (median comp)
- $138,973
- List price
- $139,900
- Delta
- 0.67%
- Verdict
- FAIR
- Comps
- 20 within 1.0 mi
Show comp detail 12 sales within ~0.75 mi
| Address | Dist | Beds/Ba | Sqft | Sold | Price | $/sf | Match |
|---|---|---|---|---|---|---|---|
| 3425 Woodpark Dr | 0.05mi | 3/2.0 (-1) | 1,776 (-1%) | 8mo | $144,500 | $81 | 85 |
| 301 Rosedon Dr | 0.21mi | 3/2.0 (-1) | 1,775 (-1%) | 9mo | $120,000 | $68 | 77 |
| 412 Belvoir Dr | 0.18mi | 4/2.0 | 1,883 (+5%) | 9mo | $150,000 | $80 | 75 |
| 761 Spring Valley Rd | 0.42mi | 4/2.0 | 1,827 (+2%) | 3mo | $127,000 | $70 | 74 |
| 218 Rosedon Dr | 0.34mi | 4/2.0 | 1,781 (-0%) | 13mo | $135,000 | $76 | 73 |
| 642 Mayflower Dr | 0.39mi | 3/2.0 (-1) | 1,795 (+0%) | 8mo | $156,500 | $87 | 69 |
| 330 Spring Valley Rd | 0.20mi | 4/2.0 | 1,602 (-10%) | 10mo | $110,000 | $69 | 65 |
| 242 Smallbrook Dr | 0.52mi | 4/2.0 | 1,671 (-7%) | 1mo | $130,000 | $78 | 63 |
| 755 Spring Valley Rd | 0.41mi | 4/2.0 | 1,992 (+11%) | 3mo | $139,900 | $70 | 59 |
| 218 W Wilding Dr | 0.33mi | 4/2.0 | 1,525 (-15%) | 2mo | $165,000 | $108 | 58 |
| 3524 Kings Cliff Rd | 0.37mi | 3/2.0 (-1) | 1,652 (-8%) | 8mo | $165,000 | $100 | 58 |
| 260 Smallbrook Dr | 0.50mi | 3/2.0 (-1) | 1,594 (-11%) | 3mo | $125,000 | $78 | 51 |
Match score weights: distance 35% · size 25% · config 20% · recency 20%. Top-matched comps best support the ARV.
Projected returns pro-forma
-3.0% appreciation · 5.65% rent growth · sell at horizon
- IRR
- 1.5%
- Equity multiple
- 1.06×
- Total profit
- $2,234
- Equity at exit
- $20,860
- IRR
- 13.4%
- Equity multiple
- 2.20×
- Total profit
- $46,930
- Equity at exit
- $12,096
Cash invested: $39,172 (down + closing). Projections, not guarantees.
Landlord ↔ Tenant lean methodology
- Overall (STATE)
- 90 Strongly Landlord-Friendly
- State Alabama
- 90 Strongly Landlord-Friendly · R+15
- County
- — inherits STATE
- City
- — inherits STATE
ZIP-level market 36116
- Home prices YoY
- -9.7%
- Rents YoY
- 5.7%
- Active inventory
- 293
- Price-to-rent
- 7.5×
Monthly cashflow live
- Estimated rent
- $1,555 high interval (Pro) →
- Mortgage (P&I)
- −$734
- Tax from tax record
- −$112 /mo · $1,344/yr
- Insurance
- −$58
- HOA
- −$0
- Vacancy / Maint / Mgmt
- −$327
- Net cashflow
- $324
Break-even live
UW: 25.0% down · 7.5% · 30yr · 1.5% tax · 5.0% vac · 8.0% maint · 8.0% mgmt
Financing live
Cash to close
- Down payment
- $34,975
- Closing costs
- $4,197
- Reserves months
- —
- Total cash needed
- —
Loan-product check · same deal, 3 products live
Conventional
25% down · 7.5% · 30yr
- Down + closing
- —
- Monthly P&I
- —
- Monthly cashflow
- —
- DSCR
- —
- Eligible?
- —
Personal DTI + credit; lowest rate.
DSCR
20% down · 8.5% · 30yr
- Down + closing
- —
- Monthly P&I
- —
- Monthly cashflow
- —
- DSCR
- —
- Eligible?
- —
No personal income docs; deal must DSCR.
Hard money
10% down · 12.0% · 12mo
- Down + closing
- —
- Monthly P&I
- —
- Monthly cashflow
- —
- DSCR
- —
- Eligible?
- —
Short-term bridge; refi at stabilization.
Rent comps 13 comps
| Address | Beds | Baths | Sqft | Rent | $/sqft | DOM | Units | Dist |
|---|---|---|---|---|---|---|---|---|
| 3324 Cross Creek Dr Montgomery, AL | 3.0 | 2.0 | 1791 | $1,395 | $0.78 | 20d | 1 | 0.03mi |
| 654 Mayflower Dr Montgomery, AL | 3.0 | 2.0 | 1777 | $1,400 | $0.79 | 43d | 1 | 0.39mi |
| 3633 Woodley Rd Montgomery, AL | 4.0 | 2.0 | 1734 | $1,600 | $0.92 | 20d | 1 | 0.76mi |
| 3855 Woodley Rd Montgomery, AL | 4.0 | 2.0 | 1450 | $1,450 | $1.00 | 43d | 1 | 0.85mi |
| 2699 Whispering Pine Dr Montgomery, AL | 4.0 | 2.0 | 1500 | $1,500 | $1.00 | 13d | 1 | 1.04mi |
| 3252 Cheltenham Dr Montgomery, AL | 3.0 | 2.0 | 1705 | $1,200 | $0.70 | 43d | 1 | 1.06mi |
| 2724 Endicott Dr Montgomery, AL | 5.0 | 4.0 | 1857 | $1,750 | $0.94 | 43d | 1 | 1.19mi |
| 2724 Forsyth Ln Montgomery, AL | 4.0 | 2.0 | 1794 | $1,400 | $0.78 | 43d | 1 | 1.21mi |
| 1217 Woodbridge Dr Unit 1043843P Montgomery, AL | 5.0 | 2.0 | 1496 | $2,830 | $1.89 | 13d | 1 | 1.28mi |
| 4751 Queensbury Ct Montgomery, AL | 5.0 | 2.0 | 1694 | $1,750 | $1.03 | 43d | 1 | 1.33mi |
| 2619 Brantford Pl Montgomery, AL | 3.0 | 2.0 | 1323 | $1,200 | $0.91 | 43d | 1 | 1.33mi |
| 2916 Moorcroft Dr Unit 1043818P Montgomery, AL | 5.0 | 2.5 | 1496 | $5,435 | $3.63 | 13d | 1 | 1.38mi |
| 915 Queensbury Dr Montgomery, AL | 4.0 | 2.0 | 1783 | $1,500 | $0.84 | 43d | 1 | 1.46mi |
Listing history 19 events
-
2026-06-18days on market $139,900 Active 84 DOM
-
2026-06-17days on market $139,900 Active 83 DOM
-
2026-06-16days on market $139,900 Active 82 DOM
-
2026-06-15days on market $139,900 Active 81 DOM
-
2026-06-14days on market $139,900 Active 79 DOM
-
2026-06-13days on market $139,900 Active 78 DOM
-
2026-06-10days on market $139,900 Active 76 DOM
-
2026-06-09days on market $139,900 Active 75 DOM
-
2026-06-08days on market $139,900 Active 74 DOM
-
2026-06-07days on market $139,900 Active 73 DOM
-
2026-06-03days on market $139,900 Active 69 DOM
-
2026-06-02days on market $139,900 Active 68 DOM
-
2026-06-01days on market $139,900 Active 67 DOM
-
2026-05-31days on market $139,900 Active 66 DOM
-
2026-05-30days on market $139,900 Active 65 DOM
-
2026-05-15price $144,900 723-char remark
Show marketing remark (723 chars)
Discover this classic 4-bedroom, 2-bathroom brick-front home offering 1,789 sq. ft. of versatile living space. The interior features hardwood flooring throughout, beginning with a well sized formal living room that flows through the formal foyer entry way into an expansive 13x21 family room complete with custom built-ins and a masonry brick fireplace. The kitchen includes a 7x9 breakfast nook that leads directly to a dedicated 7x9 laundry room for added convenience. The primary suite offers a private full bathroom. Situated on a level lot with mature trees, the exterior provides a paved driveway for off-street parking. Built in 1980, this well-maintained residence combines traditional charm with functional design.
-
2026-03-26$149,900 Active 723-char remark
Show marketing remark (723 chars)
Discover this classic 4-bedroom, 2-bathroom brick-front home offering 1,789 sq. ft. of versatile living space. The interior features hardwood flooring throughout, beginning with a well sized formal living room that flows through the formal foyer entry way into an expansive 13x21 family room complete with custom built-ins and a masonry brick fireplace. The kitchen includes a 7x9 breakfast nook that leads directly to a dedicated 7x9 laundry room for added convenience. The primary suite offers a private full bathroom. Situated on a level lot with mature trees, the exterior provides a paved driveway for off-street parking. Built in 1980, this well-maintained residence combines traditional charm with functional design.
-
2024-09-03soldstatus $2,012,400
-
2021-09-20soldstatus $57,000
ⓘ Source: listings_history table (triggers on properties + properties_extension) + one-shot
backfill from property_details.listing_events for pre-trigger history.
Tax reassessment forecast AL · Resets to sale price
- Current annual tax
- $1,344 · $112/mo
- Projected year-2 tax
- $1,344 · $112/mo
- Expected delta
- $0/yr ($0/mo · 0.0%)
ⓘ Screening estimate from a state-policy table — verify with the county assessor before closing.
Climate risk First Street
- Flood 1/10 Low FEMA zone X (unshaded) · 0% chance over 30 yrs
- Wildfire 2/10 Low
- Heat 7/10 Severe 7 d/yr ≥108°F today · 20 d/yr by 30 yrs out
- Wind 8/10 Severe 80% chance of damaging wind over 30 yrs
- Air quality 2/10 Low 1 unhealthy d/yr today · 1 by 30 yrs out
Nearby sold comps map
Loading sold comps map…
Walkable amenities ~0.75 mi
Loading nearby amenities…
Taxation est. · year 1
- Rental income
- $18,659
- − Mortgage interest
- −$7,837
- − Property taxes
- −$1,344
- − Insurance
- −$700
- − Repairs & maintenance
- −$1,493
- − Management
- −$1,493
- − Depreciation
- −$4,070
- Taxable income
- $1,724
- Est. tax owed @ 24.0%
- −$414
- After-tax cash flow
- $3,480/yr
For passive investors: Depreciation is non-cash, so a rental often shows a tax loss while cash-flowing — sheltering income. Rental losses are passive: they offset passive income freely, and up to $25,000/yr can offset ordinary (W-2) income if you actively participate and your MAGI is under $100k (phasing out to $0 by $150k); unused losses carry forward. On sale, claimed depreciation is recaptured at up to 25%, and gains may owe capital-gains tax (a 1031 exchange can defer both). Figures are a year-1 estimate at your 24.0% rate — not tax advice; consult a CPA.
Schools (NCES district)
- District
- Montgomery County
- NCES district ID
- 0102430
- Math proficiency
- 9% ▼ -21.00%
- Reading proficiency
- 31% ▼ -1.00%
- Median HH income
- $43,902
- Composite
- 17.24/100
- National rank
- #9093
- State rank
- #106 of 129 in AL
Livability — Montgomery
- Score
- 65/100
- State rank
- #138
- US rank
- #13416
Category grades
Schools grade is shown separately in the Schools card above.
Census & demographics
- Census place
- Montgomery, AL
- County
- Montgomery County · 190,016 people
- City population
- 175,913
- Metro
- Montgomery, AL
- Population (ZIP)
- 45,250
- Household income
- $55,160
- Rent vs Own
- Severe rent burden
- 2786.0
Population outlook (Montgomery County) Hauer SSP2
- Today (2025)
- 224,008 people
- By 2030
- 221,460 · -1.1%
- By 2040
- 214,179 · -4.4%
- By 2050
- 204,912 · -8.5%
- By 2075
- 177,821 · -20.6%
- By 2100
- 145,134 · -35.2%
Race, ethnicity, and origin ACS 2023
- Neighborhood character
- Predominantly Black (80%)
- Race & ethnicity
- Black 80% White 12% Two or more races 4% Asian 3% Hispanic / Latino 2%
- Common ancestry
- Italian 1%
- Foreign-born
- 5% · Canada, South Korea
- Languages at home
- 94% English-only · Spanish 2% Other Indo-European 1% Korean 1%
Political lean MEDSL · Montgomery
- 2024 margin
- Solid D (+30.7) · D 64.8% · R 34.1% · Other 1.1%
- 2008→2024 swing
- +11.5pp toward D · 2008: 19.2pp · 2024: 30.7pp
- All cycles
- 2024: D+30.7 2020: D+31.5 2016: D+26.2 2012: D+24.3 2008: D+19.2
Not yet ingested
- Civics
- —
Market trends
- HPI YoY
- ▼ -16.31%
- Current HPI
- 151.8598
- Rent YoY
- ▲ 5.65%
- Metro
- Montgomery, AL
- State GDP YoY
- ▲ 2.94%
- F500 in state
- 4
Industry mix (Fortune 500 HQ in AL)
| Industry | F500 HQs | Revenue |
|---|---|---|
| Financial Services | 1 | $8B |
|
||
| Healthcare | 1 | $5B |
|
||
Price history
+154.2% since first listed4 events — show timeline
- 2026-05-15 Price Changed $144,900 Greater Alabama MLS
- 2026-03-26 Listed $149,900 Greater Alabama MLS
- 2024-09-03 Sold (Public Records) $2,012,400 Public Records
- 2021-09-20 Sold (Public Records) $57,000 Public Records
Property tax history
+7.1%/yrLatest (2025): $1,344 · +4.5% YoY. Source: county tax records.
Cash-flow waterfall
monthlySold comps — $/sqft
last 12 mo · ≤1 miLoading sold comps…