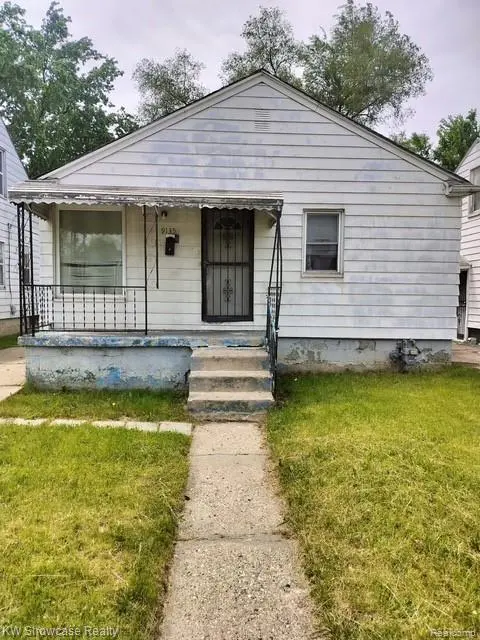
9135 Winthrop St · Detroit, MI
Flood risk 1/10 · Minimal
- FEMA flood zone
- X (unshaded)
- Chance of flooding over 30 yrs
- 0.0%
- Est. flood insurance / yr
- $473 – $860
Fire risk 1/10 · Minimal
- Est. fire insurance / yr
- $784 – $1,456
Heat risk 3/10 · Minor
- Hot days now (above 98°F)
- 7 days/yr
- Hot days in 30 yrs
- 15 days/yr
Wind risk 2/10 · Minimal
- Chance of severe wind over 30 yrs
- —
Air-quality risk 3/10 · Minor
- Unhealthy air days now
- 2 days/yr
- Unhealthy air days in 30 yrs
- 5 days/yr
Risk factors via First Street. Map © Google.
Why this score? — see what drove the B- grade
The composite is a weighted blend of 9 inputs, each scored 0–100. Each bar is that input's sub-score; the figure is the points it added to the 100-point composite (weight × sub-score).
- Cash flow +30.0/30.0
- 1% rule +10.0/10.0
- DSCR +10.0/10.0
- ARV discount +7.5/15.0
- Livability +3.7/5.0
- Condition / age +2.5/5.0
- Rent growth +1.9/5.0
- Schools +1.3/10.0
- Appreciation +0.0/10.0
$70,000
🖨 Deal sheet (PDF) 📄 Offer letter ✓ Due diligence
Listing remarks MLS
Welcome to 9135 Winthrop - a charming 2-bedroom, 1-bath range located on Detroit's desirable west side! This property offers a spacious layout with great potential for both homeowners and investors alike. Features include a functional floor plan, generous living space, and a full basement for added convenience. Situated on a quiet residential block near schools, parks, shopping, and major freeways, this home provides easy access to everything Detroit has to offer. Whether you're looking for a primary residence or your next investment opportunity, this property is full of potential. Schedule your showing today!
Key facts
- Easy access
- Full basement
- 3,485 sq ft lot
Tags
Property features AI
Exterior
- Parking: No garage; Basement parking access noted
- Utilities: Public water; Public sewer
- Home design: Single-family residence; One level; Ground-level entry with steps; Vinyl siding construction
- Construction: Block foundation
- Exterior features: Asphalt roof; Paved road access
Interior
- Bedrooms: Total of 3 rooms (includes bedrooms and living spaces)
- Bathrooms: 1 full bathroom
- Heating & cooling: Forced air heating (natural gas); No cooling
- Interior features: Unfinished basement; Awning(s)
Neighborhood map
What this means for you Summary
Snapshot
- This is a 2-bed/1.0-bath single-family listed at $70k.
Deal economics
- At list price, monthly cash flow is $426 ($5k/yr) — positive.
- The deal already cash-flows at list — no discount required.
- Meets the 1% rule at list price ($1k rent vs $70k).
- Recommended offer: $69k (1.5% below list) — sets the bar for market timing.
- Cap rate 13.6% vs local median 10.1% in Detroit — top-decile yield for the area; either an underpriced asset or a hidden risk that comps aren't pricing in. Stress-test before assuming the spread holds.
Location & tenants
- Location reads 73/100 on livability (#218 in MI) — a middle-class / working-renter tenant base. Strengths: amenities A+, commute A+, cost of living A+; Watch: schools F, crime F, employment F.
- Detroit Public Schools Community District (urban): math 10% / reading 24% proficiency, ranked #499 of 540 in MI (top 92%) — low school quality limits family demand, transient renter base, plan for 1-2y turnover; 90% free/reduced lunch — lower-income household profile, screen leases tightly.
- Market conditions: Rents soft (-2.3%/yr); 369 active listings in the ZIP; 33 comparable units currently listed for rent nearby; rentals at typical pace (median 26d on market — plan ~3-4 weeks tenant-placement turnaround); 48% of comp listings sitting > 30 days — soft ceiling on asking rent; lower-income renter base — watch delinquency; 2,639 units permitted in Wayne County in 2024 (1,216 in 5+ unit buildings).
- At $1,210/mo this rent would consume 47% of the median local household income ($31k/yr) (locally 4144% of renters already pay >50% of income on rent) — very limited rent-growth headroom before tenants either downsize or default.
Forward outlook
- Local home prices are declining (-3.0%/yr); year-one equity from $484 of loan paydown is wiped out by about $2k of value loss. Plan a longer hold.
- Wayne County population projected at -17% by 2050 — secular population decline; favor cash flow + early exit over multi-decade hold.
- At projected returns (-3.0% appreciation + 0.0% rent growth), your $20k cash investment doubles in ~6 years — after that, you're playing with house money.
Negotiation context
- It's been on market 15 days — a 2% lower offer ($69k) is reasonable based on typical stale-listing flexibility.
- 5 sale attempts since 12y ago with the ask held roughly flat each time — persistent listings suggest the price (not the market) is what's stuck; bring a comps-based counter.
- Current owner paid $4k; list at $70k implies a 1897% gain — meaningful room to come down on a strong offer.
Risks & watch-outs
- Watch-outs: built in 1946 — expect roof / HVAC / electrical / plumbing capex.
Questions for the listing agent
- Built in 1946 — when were the roof, HVAC, electrical panel, plumbing, and water heater last replaced?
- Is there a deadline driving the sale (1031 exchange, divorce, estate, relocation)? That informs how much negotiation room exists.
- Schools are F-rated, which usually means shorter tenancies and higher turnover. Who's the typical renter profile here, and what's been the actual vacancy rate?
- Crime grade is F in this area — have there been break-ins, vandalism, or insurance claims at this property in the last 3 years? What carrier currently insures it and at what premium?
- What's the average days-on-market for RENTAL listings here right now (not sales)? A rising rental-DOM trend means longer vacancies and softer asking-rent achievability than the comps imply.
- What's the recent tenant-quality profile in this submarket — average credit score on applications, eviction rate, late-payment / NSF rate, and stable-employment percentage? A property-management company in the area should have these aggregated.
- How much new for-sale + rental construction is in the pipeline within 1–3 miles? Heavy new supply typically softens prices + rents 12–24 months out; constrained supply supports both.
Investment metrics
- 1% rule
- 1.73% ✓
- Cap rate
- 13.60%
- Cash-on-cash
- 26.09%
- DSCR
- 2.16
- GRM
- 4.8
CMA / ARV
- ARV (on-the-fly)
- $46,433
- Comps found
- 12
Show comp detail 12 sales within ~0.75 mi
| Address | Dist | Beds/Ba | Sqft | Sold | Price | $/sf | Match |
|---|---|---|---|---|---|---|---|
| 9176 Winthrop St | 0.06mi | 3/1.0 (+1) | 730 (-7%) | 2mo | $30,000 | $41 | 78 |
| 9590 Sussex St | 0.45mi | 2/1.0 | 800 (+2%) | 7mo | $30,000 | $38 | 71 |
| 8283 Sussex St | 0.51mi | 2/1.0 | 777 (-1%) | 4mo | $58,000 | $75 | 70 |
| 8896 Coyle St | 0.32mi | 3/1.0 (+1) | 768 (-2%) | 9mo | $45,000 | $59 | 68 |
| 8324 Coyle St | 0.52mi | 2/1.0 | 800 (+2%) | 8mo | $48,000 | $60 | 66 |
| 10000 Montrose St | 0.55mi | 2/1.0 | 732 (-7%) | 4mo | $25,000 | $34 | 59 |
| 9580 Mansfield St | 0.43mi | 2/1.0 | 890 (+13%) | 0mo | $23,000 | $26 | 58 |
| 9965 Asbury Park | 0.68mi | 3/1.0 (+1) | 824 (+5%) | 6mo | $60,000 | $73 | 51 |
| 10017 Mansfield St | 0.62mi | 2/1.0 | 862 (+10%) | 8mo | $45,000 | $52 | 49 |
| 11360 Prest St | 0.69mi | 3/1.0 (+1) | 842 (+7%) | 3mo | $55,000 | $65 | 49 |
| 9997 Robson St | 0.64mi | 3/1.0 (+1) | 865 (+10%) | 3mo | $35,000 | $40 | 46 |
| 9910 Coyle St | 0.56mi | 3/1.0 (+1) | 904 (+15%) | 4mo | $56,000 | $62 | 41 |
Match score weights: distance 35% · size 25% · config 20% · recency 20%. Top-matched comps best support the ARV.
Projected returns pro-forma
-3.0% appreciation · 0.0% rent growth · sell at horizon
- IRR
- 16.2%
- Equity multiple
- 1.63×
- Total profit
- $12,294
- Equity at exit
- $10,437
- IRR
- 22.4%
- Equity multiple
- 2.64×
- Total profit
- $32,129
- Equity at exit
- $6,052
Cash invested: $19,600 (down + closing). Projections, not guarantees.
Landlord ↔ Tenant lean methodology
- Overall (STATE)
- 62 Landlord-Friendly
- State Michigan
- 62 Landlord-Friendly · EVEN
- County
- — inherits STATE
- City
- — inherits STATE
ZIP-level market 48228
- Rents YoY
- -2.3%
- Active inventory
- 369
- Price-to-rent
- 4.8×
Monthly cashflow live
- Estimated rent
- $1,210 high interval (Pro) →
- Mortgage (P&I)
- −$367
- Tax from tax record
- −$134 /mo · $1,607/yr
- Insurance
- −$29
- HOA
- −$0
- Vacancy / Maint / Mgmt
- −$254
- Net cashflow
- $426
Break-even live
Sensitivity live
| Price | -10% $466 | -5% $446 | +0% $426 | +5% $406 | +10% $386 |
|---|---|---|---|---|---|
| Rent | -10% $330 | -5% $378 | +0% $426 | +5% $474 | +10% $522 |
| Rate | -1.0pp $461 | -0.5pp $444 | base $426 | +0.5pp $408 | +1.0pp $389 |
UW: 25.0% down · 7.5% · 30yr · 1.5% tax · 5.0% vac · 8.0% maint · 8.0% mgmt
Financing live
Cash to close
- Down payment
- $17,500
- Closing costs
- $2,100
- Reserves months
- —
- Total cash needed
- —
Loan-product check · same deal, 3 products live
Conventional
25% down · 7.5% · 30yr
- Down + closing
- —
- Monthly P&I
- —
- Monthly cashflow
- —
- DSCR
- —
- Eligible?
- —
Personal DTI + credit; lowest rate.
DSCR
20% down · 8.5% · 30yr
- Down + closing
- —
- Monthly P&I
- —
- Monthly cashflow
- —
- DSCR
- —
- Eligible?
- —
No personal income docs; deal must DSCR.
Hard money
10% down · 12.0% · 12mo
- Down + closing
- —
- Monthly P&I
- —
- Monthly cashflow
- —
- DSCR
- —
- Eligible?
- —
Short-term bridge; refi at stabilization.
Rent comps 33 comps
| Address | Beds | Baths | Sqft | Rent | $/sqft | DOM | Units | Dist |
|---|---|---|---|---|---|---|---|---|
| 9222 Forrer St Detroit, MI | 3.0 | 1.0 | 947 | $1,450 | $1.53 | 17d | 1 | 0.18mi |
| 8604 Whitcomb St Detroit, MI | 3.0 | 2.0 | 1033 | $1,300 | $1.26 | 44d | 1 | 0.31mi |
| 9345 Rutherford St Unit 3 Detroit, MI | 2.0 | 1.0 | 850 | $1,050 | $1.24 | 25d | 1 | 0.33mi |
| 9386 Coyle St Detroit, MI | 3.0 | 1.0 | 1000 | $1,300 | $1.30 | 3d | 1 | 0.36mi |
| 9601 Greenfield Rd Detroit, MI | 1.0 | 1.0 | 500 | $725 | $1.45 | 44d | 1 | 0.41mi |
| 9546 Sussex St Detroit, MI | 3.0 | 1.0 | 1000 | $1,400 | $1.40 | 44d | 1 | 0.42mi |
| 9936 Montrose St Detroit, MI | 3.0 | 1.0 | 963 | $1,200 | $1.25 | 17d | 1 | 0.52mi |
| 9917 Sussex St Detroit, MI | 2.0 | 1.0 | 800 | $1,375 | $1.72 | 44d | 1 | 0.53mi |
| 14740 W Chicago Unit B Detroit, MI | 2.0 | 1.0 | 900 | $845 | $0.94 | 44d | 1 | 0.54mi |
| 9973 Winthrop St Detroit, MI | 3.0 | 1.0 | 960 | $1,400 | $1.46 | 44d | 1 | 0.55mi |
| 9590 Marlowe St Detroit, MI | 2.0 | 1.0 | 877 | $1,430 | $1.63 | 44d | 1 | 0.64mi |
| 10015 Robson St Detroit, MI | 3.0 | 2.0 | 1000 | $1,400 | $1.40 | 19d | 1 | 0.67mi |
| 8212 Lauder St Detroit, MI | 3.0 | 1.0 | 1026 | $1,150 | $1.12 | 44d | 1 | 0.67mi |
| 11345 Greenfield Rd Detroit, MI | 2.0 | 1.0 | 700 | $1,050 | $1.50 | 13d | 1 | 0.68mi |
| 11393 Prest St Detroit, MI | 3.0 | 1.0 | 900 | $1,550 | $1.72 | 17d | 1 | 0.73mi |
| 11397 Whitcomb St Detroit, MI | 3.0 | 1.0 | 1070 | $1,400 | $1.31 | 17d | 1 | 0.75mi |
| 8114 Marlowe St Unit home Detroit, MI | 3.0 | 1.0 | 985 | $1,350 | $1.37 | 44d | 1 | 0.77mi |
| 11634 Sussex St Detroit, MI | 3.0 | 1.0 | 1091 | $1,326 | $1.22 | 25d | 1 | 0.87mi |
| 9108 Archdale St Detroit, MI | 3.0 | 1.0 | 1000 | $1,300 | $1.30 | 6d | 1 | 0.87mi |
| 7419 Rutherford St Detroit, MI | 2.0 | 1.0 | 981 | $1,150 | $1.17 | 16d | 1 | 1.03mi |
| 8850 Rosemont Ave Detroit, MI | 3.0 | 1.0 | 933 | $1,100 | $1.18 | 19d | 1 | 1.07mi |
| 12121 Montrose St Detroit, MI | 3.0 | 1.0 | 874 | $1,373 | $1.57 | 23d | 1 | 1.07mi |
| 12039 Lauder St Detroit, MI | 3.0 | 1.5 | 1000 | $1,500 | $1.50 | 25d | 1 | 1.08mi |
| 13717 Keal St Detroit, MI | 2.0 | 1.0 | 799 | $1,000 | $1.25 | 44d | 1 | 1.13mi |
| 9340 Hartwell St Detroit, MI | 3.0 | 1.0 | 1000 | $1,364 | $1.36 | 44d | 1 | 1.14mi |
| 8451 Rosemont Ave Detroit, MI | 3.0 | 1.0 | 867 | $1,150 | $1.33 | 44d | 1 | 1.15mi |
| 8262 Rosemont Ave Detroit, MI | 3.0 | 1.0 | 836 | $1,200 | $1.44 | 6d | 1 | 1.17mi |
| 18401 Joy Rd Unit 8 Detroit, MI | 1.0 | 1.0 | 600 | $875 | $1.46 | 44d | 1 | 1.17mi |
| 18450 W Chicago Detroit, MI | 1.0–2.0 | 1.0 | 687 | $1,117 | $1.62 | 2d | 15 | 1.22mi |
| 9090 Stahelin Ave Detroit, MI | 2.0 | 1.0 | 787 | $1,250 | $1.59 | 44d | 1 | 1.37mi |
| 13310 Plymouth Rd Unit 05 Detroit, MI | 1.0 | 1.0 | 650 | $595 | $0.92 | 44d | 1 | 1.41mi |
| 13310 Plymouth Rd Unit 1 Detroit, MI | 1.0 | 1.0 | 650 | $645 | $0.99 | 44d | 1 | 1.41mi |
| 11741 Penrod St Detroit, MI | 3.0 | 1.0 | 1124 | $1,400 | $1.25 | 17d | 1 | 1.48mi |
Listing history 11 events
-
2026-06-21days on market $70,000 Active 15 DOM
-
2026-06-18days on market $70,000 Active 12 DOM
-
2026-06-17days on market $70,000 Active 11 DOM
-
2026-06-16days on market $70,000 Active 10 DOM
-
2026-06-15days on market $70,000 Active 9 DOM
-
2026-06-13days on market $70,000 Active 7 DOM
-
2026-06-13days on market $70,000 Active 6 DOM
-
2026-06-09days on market $70,000 Active 3 DOM
-
2026-06-08days on market $70,000 Active 2 DOM
-
2026-06-07remarks 617-char remark
-
2026-06-07$70,000 Active 1 DOM
ⓘ Source: listings_history table (triggers on properties + properties_extension) + one-shot
backfill from property_details.listing_events for pre-trigger history.
Tax reassessment forecast MI · Partial reset (capped growth)
- Current annual tax
- $1,607 · $134/mo
- Projected year-2 tax
- $1,607 · $134/mo
- Expected delta
- $0/yr ($0/mo · 0.0%)
ⓘ Screening estimate from a state-policy table — verify with the county assessor before closing.
Climate risk First Street
- Flood 1/10 Low FEMA zone X (unshaded) · 0% chance over 30 yrs
- Wildfire 1/10 Low
- Heat 3/10 Moderate 7 d/yr ≥98°F today · 15 d/yr by 30 yrs out
- Wind 2/10 Low
- Air quality 3/10 Moderate 2 unhealthy d/yr today · 5 by 30 yrs out
Nearby sold comps map
Loading sold comps map…
Walkable amenities ~0.75 mi
Loading nearby amenities…
Taxation est. · year 1
- Rental income
- $14,526
- − Mortgage interest
- −$3,921
- − Property taxes
- −$1,607
- − Insurance
- −$350
- − Repairs & maintenance
- −$1,162
- − Management
- −$1,162
- − Depreciation
- −$2,036
- Taxable income
- $4,287
- Est. tax owed @ 24.0%
- −$1,029
- After-tax cash flow
- $4,084/yr
For passive investors: Depreciation is non-cash, so a rental often shows a tax loss while cash-flowing — sheltering income. Rental losses are passive: they offset passive income freely, and up to $25,000/yr can offset ordinary (W-2) income if you actively participate and your MAGI is under $100k (phasing out to $0 by $150k); unused losses carry forward. On sale, claimed depreciation is recaptured at up to 25%, and gains may owe capital-gains tax (a 1031 exchange can defer both). Figures are a year-1 estimate at your 24.0% rate — not tax advice; consult a CPA.
Schools (NCES district)
- District
- Detroit Public Schools Community District
- NCES district ID
- 2601103
- Math proficiency
- 10% ▼ -2.00%
- Reading proficiency
- 24% ▲ 6.00%
- Median HH income
- $25,815
- Composite
- 13.06/100
- National rank
- #9564
- State rank
- #499 of 540 in MI
Livability — Detroit
- Score
- 73/100
- State rank
- #218
- US rank
- #5427
Category grades
Schools grade is shown separately in the Schools card above.
Census & demographics
- Census place
- Detroit, MI
- County
- Wayne County · 1,562,939 people
- City population
- 572,865
- Metro
- Detroit-Warren-Dearborn, MI
- Population (ZIP)
- 50,117
- Household income
- $30,680
- Rent vs Own
- Severe rent burden
- 4144.0
Population outlook (Wayne County) Hauer SSP2
- Today (2025)
- 1,675,273 people
- By 2030
- 1,620,300 · -3.3%
- By 2040
- 1,502,341 · -10.3%
- By 2050
- 1,384,039 · -17.4%
- By 2075
- 1,124,592 · -32.9%
- By 2100
- 881,193 · -47.4%
Race, ethnicity, and origin ACS 2023
- Neighborhood character
- Predominantly Black (71%)
- Race & ethnicity
- Black 71% White 16% Two or more races 7% Hispanic / Latino 6%
- Hispanic origin (detail)
- Mexican 3% Puerto Rican 2%
- Common ancestry
- Arab 2% Romanian 2% Lithuanian 1%
- Foreign-born
- 11% · Canada
- Languages at home
- 82% English-only · Arabic 11% Spanish 5%
Political lean MEDSL · Wayne
- 2024 margin
- Strong D (+29.0) · D 62.7% · R 33.7% · Other 3.6%
- 2008→2024 swing
- -20.5pp toward R · 2008: 49.5pp · 2024: 29.0pp
- All cycles
- 2024: D+29.0 2020: D+38.1 2016: D+37.3 2012: D+46.9 2008: D+49.5
Not yet ingested
- Civics
- —
Market trends
- HPI YoY
- ▼ -160.81%
- Current HPI
- 168.6843
- Rent YoY
- ▼ -2.30%
- Metro
- Detroit-Warren-Dearborn, MI
- State GDP YoY
- ▲ 1.37%
- F500 in state
- 28
Industry mix (Fortune 500 HQ in MI)
| Industry | F500 HQs | Revenue |
|---|---|---|
| Automotive Parts | 3 | $48B |
|
||
| Automotive | 2 | $372B |
|
||
| Chemicals | 1 | $45B |
|
||
| Automotive Retail | 1 | $29B |
|
||
| Healthcare / Medical Devices | 1 | $23B |
|
||
| Automotive Technology | 1 | $20B |
|
||
Price history
+900.0% since first listed13 events — show timeline
- 2026-06-06 Listed $70,000 REALCOMP
- 2026-06-06 Listed $70,000 MiRealSource-MiMLS
- 2014-12-11 Sold (MLS) $3,505 REALCOMP
- 2014-12-11 Sold (MLS) $3,505 MiRealSource-MiMLS
- 2014-11-24 Listing Removed — REALCOMP
- 2014-11-24 Listing Removed — MiRealSource-MiMLS
- 2014-11-18 Relisted — REALCOMP
- 2014-11-06 Listing Removed — REALCOMP
- 2014-10-21 Listed $3,500 REALCOMP
- 2014-10-21 Listed $3,500 MiRealSource-MiMLS
- 1998-01-09 Sold (Public Records) $33,000 Public Records
- 1997-07-03 Sold (Public Records) $8,000 Public Records
- 1994-05-11 Sold (Public Records) $7,000 Public Records
Property tax history
+3.1%/yrLatest (2025): $1,607 · -0.0% YoY. Source: county tax records.
Cash-flow waterfall
monthlySold comps — $/sqft
last 12 mo · ≤1 miLoading sold comps…