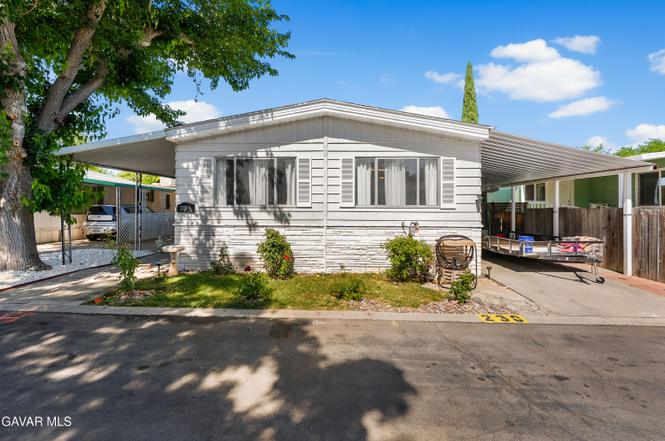
43850 E 20th St #230 · Lancaster, CA
Flood risk 1/10 · Minimal
- FEMA flood zone
- X (shaded)
- Chance of flooding over 30 yrs
- 0.0%
- Est. flood insurance / yr
- $507 – $1,088
Fire risk 6/10 · Moderate
- Est. fire insurance / yr
- $659 – $1,223
Heat risk 7/10 · Major
- Hot days now (above 101°F)
- 5 days/yr
- Hot days in 30 yrs
- 13 days/yr
Wind risk 1/10 · Minimal
- Chance of severe wind over 30 yrs
- —
Air-quality risk 8/10 · Major
- Unhealthy air days now
- 16 days/yr
- Unhealthy air days in 30 yrs
- 21 days/yr
Risk factors via First Street. Map © Google.
Why this score? — see what drove the B- grade
The composite is a weighted blend of 9 inputs, each scored 0–100. Each bar is that input's sub-score; the figure is the points it added to the 100-point composite (weight × sub-score).
- Cash flow +30.0/30.0
- 1% rule +10.0/10.0
- DSCR +10.0/10.0
- ARV discount +6.2/15.0
- Livability +3.4/5.0
- Rent growth +2.5/5.0
- Condition / age +2.5/5.0
- Schools +2.1/10.0
- Appreciation +0.0/10.0
$190,000
🖨 Deal sheet 📄 Offer letter ✓ Due diligence
Listing remarks
''Forget everything you think you know about mobile homes--this beautifully upgraded home is in a class of its own. With extensive recent improvements and meticulous maintenance, it must be seen in person to be fully appreciated!'' Pride of ownership shines throughout this beautifully maintained home! This is not your typical mobile home--it is truly a must-see. Featuring a brand-new Bosch A/C and heating system less than a year old, a newly constructed carport, new flooring and baseboards throughout, and professionally updated landscaping completed less than four months ago. Additional upgrades include new lighting fixtures with dimmer switches throughout the home and a brand-new 9,000 BTU
Key facts
- Brand-new bosch a/c
- New flooring
- New refrigerator
Tags
Property features AI
Finance
- Other: APN 2222-222-222; Serial/ID A20730306L; Label/Insignia 076914; Dec number LAY4845; New space rent and park deposit: contact manager
- HOA & community: All-ages mobile home park; Park manager on site
Exterior
- Utilities: Natural gas
- Home design: Manufactured/mobile home (Ramada); Skirted; Located in space/trailer number 230
- Construction: Composition shingle roof; Manufactured 1978; 11 ft width, 64 ft length
- Exterior features: Awning; Shed; Siding; Mobile home park recreation area; Clubhouse/rec room; Community pool; Community tennis court
Interior
- Kitchen: Dishwasher; Refrigerator
- Bathrooms: 2 full bathrooms
- Heating & cooling: Central heating (natural gas); Baseboard heating; Central air; Window AC
- Interior features: Dishwasher; Refrigerator
Neighborhood map
What this means for you Summary
Snapshot
- This is a 4-bed/2.0-bath manufactured listed at $190k.
Deal economics
- At list price, monthly cash flow is $1k ($13k/yr) — positive.
- The deal already cash-flows at list — no discount required.
- Meets the 1% rule at list price ($3k rent vs $190k).
- Cap rate 13.2% vs local median 4.3% in Lancaster — top-decile yield for the area; either an underpriced asset or a hidden risk that comps aren't pricing in. Stress-test before assuming the spread holds.
Location & tenants
- Location reads 68/100 on livability (#282 in CA) — a middle-class / working-renter tenant base. Strengths: commute A+, housing A+, amenities B+; Watch: health & safety C-, schools F, crime F.
- Eastside Union Elementary (suburban): math 15% / reading 27% proficiency, ranked #1,226 of 1,400 in CA (top 88%) — low school quality limits family demand, transient renter base, plan for 1-2y turnover; 76% free/reduced lunch — lower-income household profile, screen leases tightly.
- Market conditions: Rents flat; 1169 active listings in the ZIP; 32 comparable units currently listed for rent nearby; rentals leasing fast (median 4d on market — plan ~1-2 weeks tenant-placement turnaround); 19,697 units permitted in Los Angeles County in 2024 (9,426 in 5+ unit buildings).
- At $3,046/mo this rent would consume 52% of the median local household income ($70k/yr) (locally 2494% of renters already pay >50% of income on rent) — very limited rent-growth headroom before tenants either downsize or default.
Forward outlook
- Local home prices are declining (-3.0%/yr); year-one equity from $1k of loan paydown is wiped out by about $6k of value loss. Plan a longer hold.
- Los Angeles County population projected at +9% by 2050 — modest demand growth; plan on rents tracking national, not racing it.
- At projected returns (-3.0% appreciation + 0.1% rent growth), your $53k cash investment doubles in ~6 years — after that, you're playing with house money.
Negotiation context
- Only 7 days on market — expect competitive offers; lowballing is unlikely to land.
- 5 sale attempts since 20y ago with the ask held roughly flat each time — persistent listings suggest the price (not the market) is what's stuck; bring a comps-based counter.
Risks & watch-outs
- Climate carrying-cost: major wildfire risk; extreme-heat days projected 5→13/yr by 2055 (HVAC capex compounding) — expect insurance premiums to compound above CPI over the hold.
Questions for the listing agent
- Built in 1978 — when were the roof, HVAC, electrical panel, plumbing, and water heater last replaced?
- Is there a deadline driving the sale (1031 exchange, divorce, estate, relocation)? That informs how much negotiation room exists.
- Schools are F-rated, which usually means shorter tenancies and higher turnover. Who's the typical renter profile here, and what's been the actual vacancy rate?
- Crime grade is F in this area — have there been break-ins, vandalism, or insurance claims at this property in the last 3 years? What carrier currently insures it and at what premium?
- What's the average days-on-market for RENTAL listings here right now (not sales)? A rising rental-DOM trend means longer vacancies and softer asking-rent achievability than the comps imply.
- What's the recent tenant-quality profile in this submarket — average credit score on applications, eviction rate, late-payment / NSF rate, and stable-employment percentage? A property-management company in the area should have these aggregated.
- How much new for-sale + rental construction is in the pipeline within 1–3 miles? Heavy new supply typically softens prices + rents 12–24 months out; constrained supply supports both.
Investment metrics
- 1% rule
- 1.60% ✓
- Cap rate
- 13.20%
- Cash-on-cash
- 24.66%
- DSCR
- 2.10
- GRM
- 5.2
CMA / ARV
- ARV (on-the-fly)
- $184,800
- Comps found
- 12
Show comp detail 12 sales within ~0.75 mi
| Address | Dist | Beds/Ba | Sqft | Sold | Price | $/sf | Match |
|---|---|---|---|---|---|---|---|
| 43850 20th St E #276 | 0.00mi | 4/2.0 | 1,690 (+1%) | 20mo | $185,000 | $109 | 82 |
| 2330 E Avenue J8 #245 | 0.28mi | 3/2.0 (-1) | 1,680 (0%) | 5mo | $170,000 | $101 | 78 |
| 43850 N 20th Street East #238 | 0.11mi | 4/2.0 | 1,500 (-11%) | 5mo | $175,000 | $117 | 73 |
| 43850 E 20th St #42 | 0.00mi | 4/2.0 | 1,536 (-9%) | 17mo | $165,000 | $107 | 72 |
| 43850 E 20th St Spc 114 | 0.11mi | 4/2.0 | 1,440 (-14%) | 1mo | $129,900 | $90 | 70 |
| 2330 E Avenue J8 #178 | 0.29mi | 3/2.0 (-1) | 1,536 (-9%) | 7mo | $158,000 | $103 | 62 |
| 43850 20th St E #231 | 0.00mi | 4/3.0 | 1,440 (-14%) | 15mo | $129,000 | $90 | 60 |
| 43850 E 20 St #251 | 0.18mi | 4/2.0 | 1,440 (-14%) | 13mo | $180,000 | $125 | 57 |
| 43850 E 20th St St E #248 | 0.15mi | 3/2.0 (-1) | 1,440 (-14%) | 15mo | $165,000 | $115 | 52 |
| 2330 E Avenue J8 Spc 55 | 0.28mi | 4/2.0 | 1,456 (-13%) | 15mo | $160,000 | $110 | 52 |
| 43850 20th St E #157 | 0.18mi | 3/2.0 (-1) | 1,440 (-14%) | 15mo | $170,000 | $118 | 50 |
| 2330 E Avenue J 8 #87 | 0.28mi | 3/2.0 (-1) | 1,450 (-14%) | 20mo | $175,000 | $121 | 43 |
Match score weights: distance 35% · size 25% · config 20% · recency 20%. Top-matched comps best support the ARV.
Projected returns pro-forma
-3.0% appreciation · 0.14% rent growth · sell at horizon
- IRR
- 14.8%
- Equity multiple
- 1.57×
- Total profit
- $30,367
- Equity at exit
- $28,330
- IRR
- 21.2%
- Equity multiple
- 2.57×
- Total profit
- $83,267
- Equity at exit
- $16,428
Cash invested: $53,200 (down + closing). Projections, not guarantees.
Landlord ↔ Tenant lean methodology
- Overall (STATE)
- 18 Strongly Tenant-Friendly
- State California
- 18 Strongly Tenant-Friendly · D+13
- County
- — inherits STATE
- City
- — inherits STATE
ZIP-level market 93535
- Home prices YoY
- -24.3%
- Rents YoY
- 0.1%
- Active inventory
- 1169
- Price-to-rent
- 5.2×
Monthly cashflow live
- Estimated rent
- $3,046 high interval (Pro) →
- Mortgage (P&I)
- −$996
- Tax est. 1.5%
- −$238 /mo · $2,850/yr
- Insurance
- −$79
- HOA
- −$0
- Vacancy / Maint / Mgmt
- −$640
- Net cashflow
- $1,093
Break-even live
UW: 25.0% down · 7.5% · 30yr · 1.5% tax · 5.0% vac · 8.0% maint · 8.0% mgmt
Financing live
Cash to close
- Down payment
- $47,500
- Closing costs
- $5,700
- Reserves months
- —
- Total cash needed
- —
Loan-product check · same deal, 3 products live
Conventional
25% down · 7.5% · 30yr
- Down + closing
- —
- Monthly P&I
- —
- Monthly cashflow
- —
- DSCR
- —
- Eligible?
- —
Personal DTI + credit; lowest rate.
DSCR
20% down · 8.5% · 30yr
- Down + closing
- —
- Monthly P&I
- —
- Monthly cashflow
- —
- DSCR
- —
- Eligible?
- —
No personal income docs; deal must DSCR.
Hard money
10% down · 12.0% · 12mo
- Down + closing
- —
- Monthly P&I
- —
- Monthly cashflow
- —
- DSCR
- —
- Eligible?
- —
Short-term bridge; refi at stabilization.
Rent comps 32 comps
| Address | Beds | Baths | Sqft | Rent | $/sqft | DOM | Units | Dist |
|---|---|---|---|---|---|---|---|---|
| 43837 David St Lancaster, CA | 3.0 | 2.0 | 1300 | $2,450 | $1.88 | 1d | 1 | 0.18mi |
| 43658 Rogier St Lancaster, CA | 3.0 | 2.0 | 1424 | $2,450 | $1.72 | 1d | 1 | 0.41mi |
| 43833 Serenity Ct Lancaster, CA | 3.0 | 2.0 | 1080 | $2,470 | $2.29 | 10d | 1 | 0.44mi |
| 43833 Serenity Ct Lancaster, CA | 3.0 | 2.0 | 1080 | $2,470 | $2.29 | 1d | 1 | 0.44mi |
| 43501 Oleander St Lancaster, CA | 3.0–4.0 | 2.0–3.0 | 1477 | $4,007 | $2.71 | 1d | 1 | 0.56mi |
| 1743 , CA | 1.0–4.0 | 1.0–2.0 | 934 | $2,464 | $2.64 | 1d | 17 | 0.59mi |
| 43739 27th St E Lancaster, CA | 4.0 | 2.0 | 1494 | $3,500 | $2.34 | 3d | 1 | 0.65mi |
| 5806 Unit K Lancaster, CA | 3.0 | 2.0 | 1541 | $2,699 | $1.75 | 10d | 1 | 0.67mi |
| 1545 E Avenue J5 Lancaster, CA | 3.0 | 2.0 | 1741 | $2,899 | $1.67 | 1d | 1 | 0.68mi |
| 2500 Topaz Ln Lancaster, CA | 3.0 | 2.0 | 1274 | $2,800 | $2.20 | 24d | 1 | 0.76mi |
| 43770 Santa Rosa Cir Lancaster, CA | 3.0 | 2.0 | 1551 | $3,200 | $2.06 | 1d | 1 | 0.78mi |
| 43770 Santa Rosa Cir Lancaster, CA | 3.0 | 2.0 | 1551 | $3,200 | $2.06 | 2d | 1 | 0.78mi |
| 43702 Rembrandt St Lancaster, CA | 3.0 | 2.0 | 1272 | $2,500 | $1.97 | 19d | 1 | 0.82mi |
| 2826 San Ramon Dr Lancaster, CA | 4.0 | 2.0 | 1658 | $2,975 | $1.79 | 19d | 1 | 0.85mi |
| 4364 East Avenue J6 Unit J6 Lancaster, CA | 4.0 | 3.0 | 2020 | $3,000 | $1.49 | 5d | 1 | 0.86mi |
| 2835 La Vida Dr Lancaster, CA | 3.0 | 2.0 | 1206 | $2,750 | $2.28 | 22d | 1 | 0.86mi |
| 43632 San Francisco Ave Lancaster, CA | 3.0 | 2.0 | 1130 | $2,500 | $2.21 | 1d | 1 | 0.89mi |
| 1647 Orchid Ln Lancaster, CA | 3.0 | 3.0 | 1084 | $1,950 | $1.80 | 22d | 1 | 0.98mi |
| 2624 Via Verona Lancaster, CA | 3.0 | 2.5 | 1563 | $2,900 | $1.86 | 1d | 1 | 1.01mi |
| 2636 Via Verona Lancaster, CA | 5.0 | 2.5 | 2019 | $3,800 | $1.88 | 4d | 1 | 1.02mi |
| 3145 E Avenue K2 Lancaster, CA | 4.0 | 3.0 | 2098 | $3,400 | $1.62 | 3d | 1 | 1.20mi |
| 1253 Morven St Lancaster, CA | 4.0 | 2.0 | 1813 | $2,995 | $1.65 | 15d | 1 | 1.20mi |
| 43516 32nd St E Lancaster, CA | 3.0 | 2.0 | 1280 | $2,600 | $2.03 | 11d | 1 | 1.22mi |
| 44707 Cerisa St Lancaster, CA | 4.0 | 2.0 | 1714 | $3,000 | $1.75 | 10d | 1 | 1.23mi |
| 44709 26th St E Lancaster, CA | 3.0 | 2.0 | 1316 | $2,300 | $1.75 | 18d | 1 | 1.26mi |
| 1734 Lightcap St Lancaster, CA | 3.0 | 2.0 | 1467 | $2,700 | $1.84 | 1d | 1 | 1.28mi |
| 44243 Mahogany St Lancaster, CA | 3.0 | 2.0 | 1800 | $950 | $0.53 | 22d | 1 | 1.34mi |
| 718 E Avenue J4 Lancaster, CA | 4.0 | 2.0 | 1738 | $2,885 | $1.66 | 1d | 1 | 1.41mi |
| 44732 12th St E Lancaster, CA | 3.0 | 2.0 | 1426 | $2,600 | $1.82 | 15d | 1 | 1.43mi |
| 3264 Topaz Ln Lancaster, CA | 3.0 | 2.0 | 1750 | $3,299 | $1.89 | 1d | 1 | 1.44mi |
| 44755 Jefferson Ct Lancaster, CA | 5.0 | 2.0 | 1405 | $4,100 | $2.92 | 1d | 1 | 1.46mi |
| 766 E Pillsbury St Lancaster, CA | 5.0 | 2.0 | 1604 | $2,500 | $1.56 | 11d | 1 | 1.50mi |
Listing history 3 events
-
2026-06-18days on market $190,000 Active 7 DOM
-
2026-06-17remarks 699-char remark
-
2026-06-17$190,000 Active 6 DOM
ⓘ Source: listings_history table (triggers on properties + properties_extension) + one-shot
backfill from property_details.listing_events for pre-trigger history.
Climate risk First Street
- Flood 1/10 Low FEMA zone X (shaded) · 0% chance over 30 yrs
- Wildfire 6/10 Major
- Heat 7/10 Severe 5 d/yr ≥101°F today · 13 d/yr by 30 yrs out
- Wind 1/10 Low
- Air quality 8/10 Severe 16 unhealthy d/yr today · 21 by 30 yrs out
Nearby sold comps map
Loading sold comps map…
Walkable amenities ~0.75 mi
Loading nearby amenities…
Taxation est. · year 1
- Rental income
- $36,552
- − Mortgage interest
- −$10,643
- − Property taxes
- −$2,850
- − Insurance
- −$950
- − Repairs & maintenance
- −$2,924
- − Management
- −$2,924
- − Depreciation
- −$5,527
- Taxable income
- $10,733
- Est. tax owed @ 24.0%
- −$2,576
- After-tax cash flow
- $10,543/yr
For passive investors: Depreciation is non-cash, so a rental often shows a tax loss while cash-flowing — sheltering income. Rental losses are passive: they offset passive income freely, and up to $25,000/yr can offset ordinary (W-2) income if you actively participate and your MAGI is under $100k (phasing out to $0 by $150k); unused losses carry forward. On sale, claimed depreciation is recaptured at up to 25%, and gains may owe capital-gains tax (a 1031 exchange can defer both). Figures are a year-1 estimate at your 24.0% rate — not tax advice; consult a CPA.
Schools (NCES district)
- District
- Eastside Union Elementary
- NCES district ID
- 0611910
- Math proficiency
- 15% ▲ 1.00%
- Reading proficiency
- 27% ▲ 3.00%
- Median HH income
- $44,840
- Composite
- 21.43/100
- National rank
- #13636
- State rank
- #1226 of 1400 in CA
Livability — Lancaster
- Score
- 68/100
- State rank
- #282
- US rank
- #9504
Category grades
Schools grade is shown separately in the Schools card above.
Census & demographics
- Census place
- Lancaster, CA
- County
- Los Angeles County · 9,444,647 people
- City population
- 194,251
- Metro
- Los Angeles-Long Beach-Anaheim, CA
- Population (ZIP)
- 79,409
- Household income
- $70,360
- Rent vs Own
- Severe rent burden
- 2494.0
Population outlook (Los Angeles County) Hauer SSP2
- Today (2025)
- 10,940,515 people
- By 2030
- 11,256,481 · +2.9%
- By 2040
- 11,729,929 · +7.2%
- By 2050
- 11,948,407 · +9.2%
- By 2075
- 11,818,114 · +8.0%
- By 2100
- 10,842,928 · -0.9%
Race, ethnicity, and origin ACS 2023
- Neighborhood character
- Diverse neighborhood (Simpson 0.63)
- Race & ethnicity
- Hispanic / Latino 55% Two or more races 25% Black 21% White 17% Asian 2% Native American 1%
- Hispanic origin (detail)
- Mexican 42%
- Common ancestry
- Romanian 1% Italian 1% Lithuanian 1%
- Foreign-born
- 13% · Canada
- Languages at home
- 60% English-only · Spanish 37% Tagalog/Filipino 1% Other Indo-European 1%
Political lean MEDSL · Los Angeles
- 2024 margin
- Solid D (+32.9) · D 64.8% · R 31.9% · Other 3.3%
- 2008→2024 swing
- -7.4pp toward R · 2008: 40.4pp · 2024: 32.9pp
- All cycles
- 2024: D+32.9 2020: D+44.2 2016: D+48.0 2012: D+40.0 2008: D+40.4
Not yet ingested
- Civics
- —
Market trends
- HPI YoY
- ▼ -144.13%
- Current HPI
- 449.4494
- Rent YoY
- ▲ 0.14%
- Metro
- Los Angeles-Long Beach-Anaheim, CA
- State GDP YoY
- ▲ 3.21%
- F500 in state
- 116
Industry mix (Fortune 500 HQ in CA)
| Industry | F500 HQs | Revenue |
|---|---|---|
| Technology | 27 | $1,492B |
|
||
| Financial Services | 3 | $174B |
|
||
| Retail | 3 | $44B |
|
||
| Insurance | 3 | $26B |
|
||
| Media / Entertainment | 2 | $115B |
|
||
| Pharmaceuticals / Biotech | 2 | $62B |
|
||
Price history
+115.9% since first listed9 events — show timeline
- 2026-06-11 Listed $190,000 AVMLS
- 2019-03-01 Listing Removed — AVMLS
- 2019-02-17 Relisted — AVMLS
- 2019-02-07 Pending — AVMLS
- 2019-01-11 Listed $59,000 AVMLS
- 2015-03-27 Listing Removed — AVMLS
- 2007-02-17 Listing Removed — CRMLS
- 2006-04-24 Listed $88,000 AVMLS
- 2006-04-24 Listed $88,000 CRMLS
Cash-flow waterfall
monthlySold comps — $/sqft
last 12 mo · ≤1 miLoading sold comps…