79 3rd St · Dearborn Heights, MI
Flood risk No data
- FEMA flood zone
- —
- Chance of flooding over 30 yrs
- —
- Est. flood insurance / yr
- —
Fire risk No data
- Est. fire insurance / yr
- —
Heat risk No data
- Hot days now (above threshold)
- —
- Hot days in 30 yrs
- —
Wind risk No data
- Chance of severe wind over 30 yrs
- —
Air-quality risk No data
- Unhealthy air days now
- —
- Unhealthy air days in 30 yrs
- —
Risk factors via First Street. Map © Google.
Why this score? — see what drove the B grade
The composite is a weighted blend of 9 inputs, each scored 0–100. Each bar is that input's sub-score; the figure is the points it added to the 100-point composite (weight × sub-score).
- Cash flow +30.0/30.0
- 1% rule +10.0/10.0
- DSCR +10.0/10.0
- ARV discount +7.5/15.0
- Livability +4.0/5.0
- Condition / age +4.0/5.0
- Schools +2.8/10.0
- Rent growth +2.6/5.0
- Appreciation +0.0/10.0
$64,900
🖨 Deal sheet 📄 Offer letter ✓ Due diligence
Listing remarks MLS
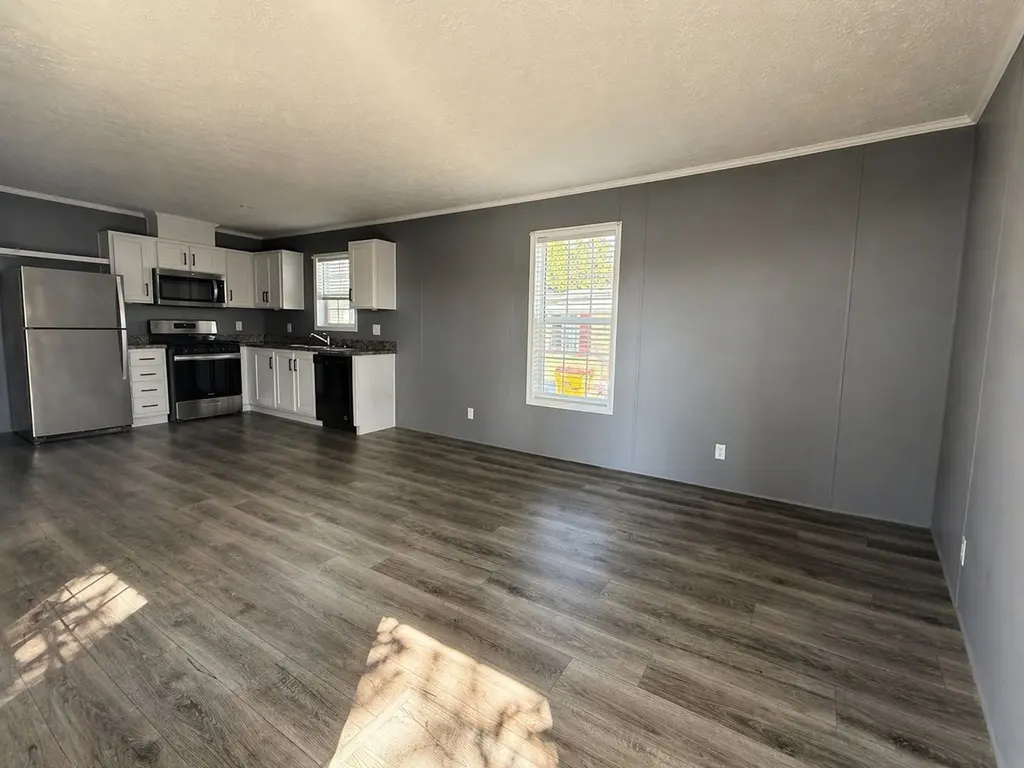
Welcome home to easy, comfortable living in this well kept two bedroom space! Located toward the edge of the community, you will love the open layout and all the natural light that makes the home feel bright and welcoming perfect for relaxing or having friends over. The kitchen is a standout, with plenty of counter space and a clean, modern look that makes cooking and gathering simple. Plus, you will have access to great community perks like a pool, clubhouse, and a quiet, well-maintained neighborhood. Come see it for yourself, schedule a tour!
Key facts
- Open floor plan
- Generous living area
- Sleek cabinetry
Tags
Neighborhood map
What this means for you Summary
Snapshot
- This is a 2-bed/1.0-bath manufactured listed at $65k. Condition is rated good.
Deal economics
- At list price, monthly cash flow is $671 ($8k/yr) — positive.
- The deal already cash-flows at list — no discount required.
- Meets the 1% rule at list price ($1k rent vs $65k).
- Recommended offer: $57k (12.0% below list) — sets the bar for market timing.
- Cap rate 18.7% vs local median 5.5% in Dearborn Heights — top-decile yield for the area; either an underpriced asset or a hidden risk that comps aren't pricing in. Stress-test before assuming the spread holds.
Location & tenants
- Location reads 79/100 on livability (#82 in MI, #1,885 nationally) — a middle-class / working-renter tenant base. Strengths: commute A+, cost of living A+, housing A+; Watch: schools C-, crime D+, employment D+.
- Dearborn City School District (urban): math 26% / reading 39% proficiency, ranked #325 of 540 in MI (top 60%) — families likely to look elsewhere, expect single-tenant / working-renter base with shorter leases; 66% free/reduced lunch — lower-income household profile, screen leases tightly.
- Market conditions: Rents flat; 143 active listings in the ZIP; 13 comparable units currently listed for rent nearby; rentals at typical pace (median 18d on market — plan ~3-4 weeks tenant-placement turnaround); 2,639 units permitted in Wayne County in 2024 (1,216 in 5+ unit buildings).
Forward outlook
- Local home prices are declining (-3.0%/yr); year-one equity from $449 of loan paydown is wiped out by about $2k of value loss. Plan a longer hold.
- Wayne County population projected at -17% by 2050 — secular population decline; favor cash flow + early exit over multi-decade hold.
- At projected returns (-3.0% appreciation + 0.4% rent growth), your $18k cash investment doubles in ~3 years — after that, you're playing with house money.
Negotiation context
- It's been on market 242 days — a 12% lower offer ($57k) is reasonable based on typical stale-listing flexibility.
- 2 sale attempts with the ask held roughly flat each time — persistent listings suggest the price (not the market) is what's stuck; bring a comps-based counter.
Questions for the listing agent
- It's been on market 242 days. Have you received any prior offers? Is the seller open to a 12% concession, seller financing, or rate buy-down credit?
- Why hasn't it sold? Are there any deal-killer items the seller is aware of (foundation, flood, title, zoning, code violations)?
- Is there a deadline driving the sale (1031 exchange, divorce, estate, relocation)? That informs how much negotiation room exists.
- Crime grade is D in this area — have there been break-ins, vandalism, or insurance claims at this property in the last 3 years? What carrier currently insures it and at what premium?
- What's the average days-on-market for RENTAL listings here right now (not sales)? A rising rental-DOM trend means longer vacancies and softer asking-rent achievability than the comps imply.
- What's the recent tenant-quality profile in this submarket — average credit score on applications, eviction rate, late-payment / NSF rate, and stable-employment percentage? A property-management company in the area should have these aggregated.
- How much new for-sale + rental construction is in the pipeline within 1–3 miles? Heavy new supply typically softens prices + rents 12–24 months out; constrained supply supports both.
Investment metrics
- 1% rule
- 2.18% ✓
- Cap rate
- 18.71%
- Cash-on-cash
- 44.34%
- DSCR
- 2.97
- GRM
- 3.8
CMA / ARV
No comps found within radius.
Projected returns pro-forma
-3.0% appreciation · 0.41% rent growth · sell at horizon
- IRR
- 38.4%
- Equity multiple
- 2.58×
- Total profit
- $28,669
- Equity at exit
- $9,677
- IRR
- 43.6%
- Equity multiple
- 4.64×
- Total profit
- $66,088
- Equity at exit
- $5,611
Cash invested: $18,172 (down + closing). Projections, not guarantees.
Landlord ↔ Tenant lean methodology
- Overall (STATE)
- 62 Landlord-Friendly
- State Michigan
- 62 Landlord-Friendly · EVEN
- County
- — inherits STATE
- City
- — inherits STATE
ZIP-level market 48127
- Rents YoY
- 0.4%
- Active inventory
- 143
- Price-to-rent
- 3.8×
Monthly cashflow live
- Estimated rent
- $1,418 high interval (Pro) →
- Mortgage (P&I)
- −$340
- Tax est. 1.5%
- −$81 /mo · $974/yr
- Insurance
- −$27
- HOA
- −$0
- Vacancy / Maint / Mgmt
- −$298
- Net cashflow
- $671
Break-even live
UW: 25.0% down · 7.5% · 30yr · 1.5% tax · 5.0% vac · 8.0% maint · 8.0% mgmt
Financing live
Cash to close
- Down payment
- $16,225
- Closing costs
- $1,947
- Reserves months
- —
- Total cash needed
- —
Loan-product check · same deal, 3 products live
Conventional
25% down · 7.5% · 30yr
- Down + closing
- —
- Monthly P&I
- —
- Monthly cashflow
- —
- DSCR
- —
- Eligible?
- —
Personal DTI + credit; lowest rate.
DSCR
20% down · 8.5% · 30yr
- Down + closing
- —
- Monthly P&I
- —
- Monthly cashflow
- —
- DSCR
- —
- Eligible?
- —
No personal income docs; deal must DSCR.
Hard money
10% down · 12.0% · 12mo
- Down + closing
- —
- Monthly P&I
- —
- Monthly cashflow
- —
- DSCR
- —
- Eligible?
- —
Short-term bridge; refi at stabilization.
Rent comps 13 comps
| Address | Beds | Baths | Sqft | Rent | $/sqft | DOM | Units | Dist |
|---|---|---|---|---|---|---|---|---|
| 22330 W Warren Ave Redford Charter Twp, MI | 2.0 | 1.0 | 750 | $1,200 | $1.60 | 43d | 1 | 0.50mi |
| 7466 W Parkway St Redford, MI | 2.0 | 1.5 | 672 | $1,200 | $1.79 | 2d | 1 | 0.71mi |
| 23700 W Warren St Dearborn Heights, MI | 1.0 | 1.0 | 900 | $1,120 | $1.24 | 43d | 2 | 0.75mi |
| 7420 Drexel St Dearborn Heights, MI | 2.0 | 1.0 | 1080 | $1,700 | $1.57 | 17d | 1 | 1.00mi |
| 7420 Drexel St Dearborn Heights, MI | 2.0 | 1.0 | 1080 | $1,600 | $1.48 | 4d | 1 | 1.00mi |
| 7420 Drexel St Dearborn Heights, MI | 2.0 | 1.0 | 1080 | $1,700 | $1.57 | 43d | 1 | 1.00mi |
| 6980 Town Ln Dearborn Heights, MI | 1.0 | 1.0 | 600 | $895 | $1.49 | 17d | 1 | 1.14mi |
| 5965 Evergreen Rd Dearborn Heights, MI | 1.0–2.0 | 1.0 | 825 | $1,350 | $1.64 | 5d | 1 | 1.30mi |
| 7411 Stout St Detroit, MI | 3.0 | 1.0 | 888 | $1,428 | $1.61 | 12d | 1 | 1.31mi |
| 7080 Highview St Dearborn Heights, MI | 3.0 | 2.5 | 1105 | $2,000 | $1.81 | 18d | 1 | 1.39mi |
| 8270 Trinity St Detroit, MI | 3.0 | 1.0 | 806 | $1,528 | $1.90 | 43d | 1 | 1.42mi |
| 8187 Lenore St Dearborn Heights, MI | 2.0 | 1.0 | 768 | $1,550 | $2.02 | 43d | 1 | 1.45mi |
| 20431 Tireman St Detroit, MI | 3.0 | 1.0 | 1020 | $1,350 | $1.32 | 17d | 1 | 1.46mi |
Listing history 16 events
-
2026-06-18days on market $64,900 Active 242 DOM
-
2026-06-17days on market $64,900 Active 241 DOM
-
2026-06-16days on market $64,900 Active 240 DOM
-
2026-06-15days on market $64,900 Active 239 DOM
-
2026-06-13days on market $64,900 Active 237 DOM
-
2026-06-09days on market $64,900 Active 233 DOM
-
2026-06-08days on market $64,900 Active 232 DOM
-
2026-06-07days on market $64,900 Active 231 DOM
-
2026-06-04days on market $64,900 Active 228 DOM
-
2026-06-03days on market $64,900 Active 227 DOM
-
2026-06-02days on market $64,900 Active 226 DOM
-
2026-06-01days on market $64,900 Active 225 DOM
-
2026-05-31days on market $64,900 Active 224 DOM
-
2025-10-31status Active 550-char remark
Show marketing remark (550 chars)
Welcome home to easy, comfortable living in this well kept two bedroom space! Located toward the edge of the community, you will love the open layout and all the natural light that makes the home feel bright and welcoming perfect for relaxing or having friends over. The kitchen is a standout, with plenty of counter space and a clean, modern look that makes cooking and gathering simple. Plus, you will have access to great community perks like a pool, clubhouse, and a quiet, well-maintained neighborhood. Come see it for yourself, schedule a tour!
-
2025-10-31historical 550-char remark
Show marketing remark (550 chars)
Welcome home to easy, comfortable living in this well kept two bedroom space! Located toward the edge of the community, you will love the open layout and all the natural light that makes the home feel bright and welcoming perfect for relaxing or having friends over. The kitchen is a standout, with plenty of counter space and a clean, modern look that makes cooking and gathering simple. Plus, you will have access to great community perks like a pool, clubhouse, and a quiet, well-maintained neighborhood. Come see it for yourself, schedule a tour!
-
2025-10-18$64,900 Active 550-char remark
Show marketing remark (550 chars)
Welcome home to easy, comfortable living in this well kept two bedroom space! Located toward the edge of the community, you will love the open layout and all the natural light that makes the home feel bright and welcoming perfect for relaxing or having friends over. The kitchen is a standout, with plenty of counter space and a clean, modern look that makes cooking and gathering simple. Plus, you will have access to great community perks like a pool, clubhouse, and a quiet, well-maintained neighborhood. Come see it for yourself, schedule a tour!
ⓘ Source: listings_history table (triggers on properties + properties_extension) + one-shot
backfill from property_details.listing_events for pre-trigger history.
Nearby sold comps map
Loading sold comps map…
Walkable amenities ~0.75 mi
Loading nearby amenities…
Taxation est. · year 1
- Rental income
- $17,012
- − Mortgage interest
- −$3,635
- − Property taxes
- −$974
- − Insurance
- −$324
- − Repairs & maintenance
- −$1,361
- − Management
- −$1,361
- − Depreciation
- −$1,888
- Taxable income
- $7,469
- Est. tax owed @ 24.0%
- −$1,793
- After-tax cash flow
- $6,265/yr
For passive investors: Depreciation is non-cash, so a rental often shows a tax loss while cash-flowing — sheltering income. Rental losses are passive: they offset passive income freely, and up to $25,000/yr can offset ordinary (W-2) income if you actively participate and your MAGI is under $100k (phasing out to $0 by $150k); unused losses carry forward. On sale, claimed depreciation is recaptured at up to 25%, and gains may owe capital-gains tax (a 1031 exchange can defer both). Figures are a year-1 estimate at your 24.0% rate — not tax advice; consult a CPA.
Condition & rehab AI · 12 photos
This well-maintained two-bedroom home offers a modern kitchen and living spaces with excellent curb appeal. Minor exterior painting and gutter cleaning would further enhance its value.
Value-add opportunities
- Both Paint exterior siding — Enhances curb appeal and value
- Both Clean gutters — Improves drainage and property value
Renovation cost estimate screening
Value-add ROI direction
- Both Paint exterior siding — Enhances curb appeal and value ↑
- Both Clean gutters — Improves drainage and property value ↑
ⓘ Cost ranges are severity-bucket heuristics (US national rule-of-thumb). Get contractor quotes + a written scope before underwriting a rehab budget.
Schools (NCES district)
- District
- Dearborn City School District
- NCES district ID
- 2611600
- Math proficiency
- 26% ▼ -14.00%
- Reading proficiency
- 39% ▼ -8.00%
- Median HH income
- $46,884
- Composite
- 27.93/100
- National rank
- #6864
- State rank
- #325 of 540 in MI
Livability — Dearborn Heights
- Score
- 79/100
- State rank
- #82
- US rank
- #1885
Category grades
Schools grade is shown separately in the Schools card above.
Census & demographics
- Census place
- Dearborn Heights, MI
- County
- Wayne County · 1,562,939 people
- City population
- 61,771
- Metro
- Detroit-Warren-Dearborn, MI
- Population (ZIP)
- 39,646
- Household income
- $60,742
- Rent vs Own
- Severe rent burden
- 1196.0
Population outlook (Wayne County) Hauer SSP2
- Today (2025)
- 1,675,273 people
- By 2030
- 1,620,300 · -3.3%
- By 2040
- 1,502,341 · -10.3%
- By 2050
- 1,384,039 · -17.4%
- By 2075
- 1,124,592 · -32.9%
- By 2100
- 881,193 · -47.4%
Race, ethnicity, and origin ACS 2023
- Neighborhood character
- Predominantly White (85%)
- Race & ethnicity
- White 85% Black 8% Two or more races 3% Hispanic / Latino 3% Asian 2%
- Common ancestry
- Arab 8% Romanian 7% Lithuanian 2%
- Foreign-born
- 31% · Canada
- Languages at home
- 46% English-only · Arabic 45% Russian/Polish/Slavic 2% Other Indo-European 2%
Political lean MEDSL · Wayne
- 2024 margin
- Strong D (+29.0) · D 62.7% · R 33.7% · Other 3.6%
- 2008→2024 swing
- -20.5pp toward R · 2008: 49.5pp · 2024: 29.0pp
- All cycles
- 2024: D+29.0 2020: D+38.1 2016: D+37.3 2012: D+46.9 2008: D+49.5
Not yet ingested
- Civics
- —
Market trends
- HPI YoY
- ▼ -319.04%
- Current HPI
- 225.9407
- Rent YoY
- ▲ 0.41%
- Metro
- Detroit-Warren-Dearborn, MI
- State GDP YoY
- ▲ 1.37%
- F500 in state
- 28
Industry mix (Fortune 500 HQ in MI)
| Industry | F500 HQs | Revenue |
|---|---|---|
| Automotive Parts | 3 | $48B |
|
||
| Automotive | 2 | $372B |
|
||
| Chemicals | 1 | $45B |
|
||
| Automotive Retail | 1 | $29B |
|
||
| Healthcare / Medical Devices | 1 | $23B |
|
||
| Automotive Technology | 1 | $20B |
|
||
Price history
3 events — show timeline
- 2025-10-31 Relisted — Zillow
- 2025-10-31 Delisted — Zillow
- 2025-10-18 Listed $64,900 Zillow
Cash-flow waterfall
monthlySold comps — $/sqft
last 12 mo · ≤1 miLoading sold comps…