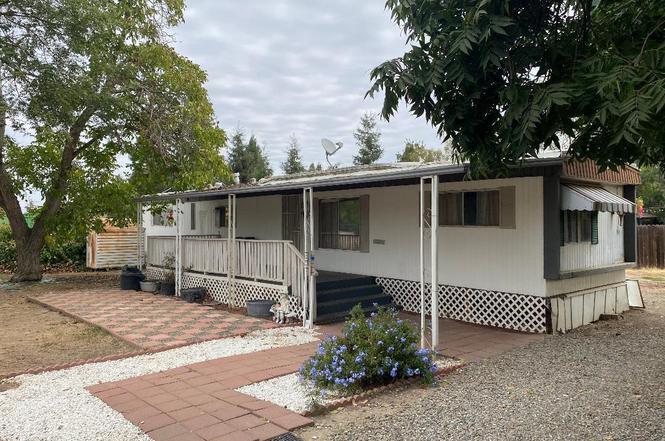
27388 Rd 148 · Visalia, CA
Flood risk 5/10 · Moderate
- FEMA flood zone
- X (shaded)
- Chance of flooding over 30 yrs
- 0.45%
- Est. flood insurance / yr
- $507 – $1,088
Fire risk 7/10 · Major
- Est. fire insurance / yr
- $659 – $1,223
Heat risk 8/10 · Major
- Hot days now (above 105°F)
- 7 days/yr
- Hot days in 30 yrs
- 17 days/yr
Wind risk 1/10 · Minimal
- Chance of severe wind over 30 yrs
- —
Air-quality risk 10/10 · Severe
- Unhealthy air days now
- 44 days/yr
- Unhealthy air days in 30 yrs
- 50 days/yr
Risk factors via First Street. Map © Google.
Why this score? — see what drove the C- grade
The composite is a weighted blend of 9 inputs, each scored 0–100. Each bar is that input's sub-score; the figure is the points it added to the 100-point composite (weight × sub-score).
- Cash flow +21.0/30.0
- ARV discount +7.5/15.0
- DSCR +6.7/10.0
- 1% rule +4.2/10.0
- Livability +3.6/5.0
- Rent growth +3.0/5.0
- Schools +3.0/10.0
- Condition / age +2.5/5.0
- Appreciation +0.0/10.0
$195,000
🖨 Deal sheet (PDF) 📄 Offer letter ✓ Due diligence
Listing remarks MLS
Here's a very unique property in the country!! Currently this is a mobile home on almost a 1/4 acre of property that is permitted by the county to hold 3 mobile homes. There are two more mobile pads on the property with their own electric panels. All 3 pads share one septic and the property gets community water for $35 per month. It's a great opportunity for family members to share the site or an investor could rent out all 3 pads. Call if you have more questions.
Key facts
- 0.23 acre lot
- 4 parking spots
- Built 1973
Property features AI
Finance
- Other: Lot approximately 0.23 acres (approx. 69 x 150) with a small additional parcel (parcel 910-002-560)
- Financial info: No financial details provided
Exterior
- Parking: Driveway; 4 open parking spaces
- Security: Carbon monoxide detector(s); Smoke detector(s)
- Utilities: Private water source; Septic tank; Natural gas available and connected; Electricity connected; Water connected
- Home design: Manufactured-on-land residential property; Single-story; Faces west; Used as multi-family / residential; No shared/common walls
- Construction: Aluminum siding; Raised foundation with pillar/post/pier; Elastomeric roof; Built on a lot with an additional small parcel included
- Exterior features: Back yard; Front yard; Paved road frontage on county road; Shed(s) / storage
Interior
- Kitchen: Gas oven; Gas range; Refrigerator
- Flooring: Linoleum; Carpet
- Bathrooms: One full bathroom; One three-quarter bathroom
- Heating & cooling: Forced air heating (natural gas); Electric and evaporative cooling
- Interior features: Awning(s); Fixer condition; Has view; Carbon monoxide and smoke detectors
- Laundry & utility: Washer hookup; Electric dryer hookup; Gas dryer hookup; Laundry access outside; Gas water heater
Neighborhood map
What this means for you Summary
Snapshot
- This is a 2-bed/2.0-bath land listed at $195k.
Deal economics
- At list price, monthly cash flow is $276 ($3k/yr) — positive.
- The deal already cash-flows at list — no discount required.
- To meet the 1% rule (rent ≥ 1% of price), the offer needs to be $180k (7.8% below list).
- Recommended offer: $180k (7.8% below list) — sets the bar for 1% rule.
- Cap rate 8.0% vs local median 3.3% in Visalia — top-decile yield for the area; either an underpriced asset or a hidden risk that comps aren't pricing in. Stress-test before assuming the spread holds.
Location & tenants
- Location reads 72/100 on livability (#196 in CA) — a middle-class / working-renter tenant base. Strengths: commute A+, housing A+, employment B; Watch: amenities D, crime D-, cost of living F.
- Visalia Unified (urban): math 30% / reading 40% proficiency, ranked #273 of 517 in CA (top 53%) — families likely to look elsewhere, expect single-tenant / working-renter base with shorter leases.
- Zoned schools: Annie R. Mitchell (math 37% / reading 37%, grade F, #671 of 1,571 statewide, top 44%, 783 students, 69% FRL); Divisadero Middle (math 24% / reading 44%, grade F, #183 of 498 statewide, top 38%, 749 students, 78% FRL); Mt. Whitney High (math 50% / reading 84%, grade B, #139 of 1,170 statewide, top 13%, 1,639 students, 70% FRL).
- Market conditions: Rents rising (+2.0%/yr); 313 active listings in the ZIP; 1 comparable units currently listed for rent nearby; solid renter incomes; 1,447 units permitted in Tulare County in 2024 (307 in 5+ unit buildings).
Forward outlook
- Local home prices are declining (-3.0%/yr); year-one equity from $1k of loan paydown is wiped out by about $6k of value loss. Plan a longer hold.
- Tulare County population projected at +10% by 2050 — modest demand growth; plan on rents tracking national, not racing it.
Negotiation context
- Only 6 days on market — expect competitive offers; lowballing is unlikely to land.
- 3 sale attempts with the ask held roughly flat each time — persistent listings suggest the price (not the market) is what's stuck; bring a comps-based counter.
Risks & watch-outs
- Climate carrying-cost: moderate flood risk; major wildfire risk; extreme-heat days projected 7→17/yr by 2055 (HVAC capex compounding) — expect insurance premiums to compound above CPI over the hold.
Questions for the listing agent
- Built in 1973 — when were the roof, HVAC, electrical panel, plumbing, and water heater last replaced?
- Is there a deadline driving the sale (1031 exchange, divorce, estate, relocation)? That informs how much negotiation room exists.
- Crime grade is D in this area — have there been break-ins, vandalism, or insurance claims at this property in the last 3 years? What carrier currently insures it and at what premium?
- What's the average days-on-market for RENTAL listings here right now (not sales)? A rising rental-DOM trend means longer vacancies and softer asking-rent achievability than the comps imply.
- What's the recent tenant-quality profile in this submarket — average credit score on applications, eviction rate, late-payment / NSF rate, and stable-employment percentage? A property-management company in the area should have these aggregated.
- How much new for-sale + rental construction is in the pipeline within 1–3 miles? Heavy new supply typically softens prices + rents 12–24 months out; constrained supply supports both.
Investment metrics
- 1% rule
- 0.92% ✗
- Cap rate
- 7.99%
- Cash-on-cash
- 6.07%
- DSCR
- 1.27
- GRM
- 9.0
CMA / ARV
No comps found within radius.
Projected returns pro-forma
-3.0% appreciation · 1.99% rent growth · sell at horizon
- IRR
- -8.0%
- Equity multiple
- 0.71×
- Total profit
- $-15,927
- Equity at exit
- $29,075
- IRR
- 0.3%
- Equity multiple
- 1.02×
- Total profit
- $1,093
- Equity at exit
- $16,860
Cash invested: $54,600 (down + closing). Projections, not guarantees.
Landlord ↔ Tenant lean methodology
- Overall (STATE)
- 18 Strongly Tenant-Friendly
- State California
- 18 Strongly Tenant-Friendly · D+13
- County
- — inherits STATE
- City
- — inherits STATE
ZIP-level market 93292
- Rents YoY
- 2.0%
- Active inventory
- 313
- Price-to-rent
- 9.0×
Monthly cashflow live
- Estimated rent
- $1,798 medium interval (Pro) →
- Mortgage (P&I)
- −$1,023
- Tax from tax record
- −$41 /mo · $491/yr
- Insurance
- −$81
- HOA
- −$0
- Vacancy / Maint / Mgmt
- −$378
- Net cashflow
- $276
Break-even live
Sensitivity live
| Price | -10% $386 | -5% $331 | +0% $276 | +5% $221 | +10% $166 |
|---|---|---|---|---|---|
| Rent | -10% $134 | -5% $205 | +0% $276 | +5% $347 | +10% $418 |
| Rate | -1.0pp $374 | -0.5pp $326 | base $276 | +0.5pp $225 | +1.0pp $174 |
UW: 25.0% down · 7.5% · 30yr · 1.5% tax · 5.0% vac · 8.0% maint · 8.0% mgmt
Financing live
Cash to close
- Down payment
- $48,750
- Closing costs
- $5,850
- Reserves months
- —
- Total cash needed
- —
Loan-product check · same deal, 3 products live
Conventional
25% down · 7.5% · 30yr
- Down + closing
- —
- Monthly P&I
- —
- Monthly cashflow
- —
- DSCR
- —
- Eligible?
- —
Personal DTI + credit; lowest rate.
DSCR
20% down · 8.5% · 30yr
- Down + closing
- —
- Monthly P&I
- —
- Monthly cashflow
- —
- DSCR
- —
- Eligible?
- —
No personal income docs; deal must DSCR.
Hard money
10% down · 12.0% · 12mo
- Down + closing
- —
- Monthly P&I
- —
- Monthly cashflow
- —
- DSCR
- —
- Eligible?
- —
Short-term bridge; refi at stabilization.
Rent comps 1 comps
| Address | Beds | Baths | Sqft | Rent | $/sqft | DOM | Units | Dist |
|---|---|---|---|---|---|---|---|---|
| 3500 Villa St Unit 3500 Visalia, CA | 2.0 | 2.0 | 900 | $1,600 | $1.78 | 45d | 1 | 1.40mi |
Listing history 5 events
-
2026-06-21days on market $195,000 Active 6 DOM
-
2026-06-18days on market $195,000 Active 3 DOM
-
2026-06-17days on market $195,000 Active 2 DOM
-
2026-06-16remarks 475-char remark
-
2026-06-16$195,000 Active 1 DOM
ⓘ Source: listings_history table (triggers on properties + properties_extension) + one-shot
backfill from property_details.listing_events for pre-trigger history.
Tax reassessment forecast CA · Resets to sale price
- Current annual tax
- $491 · $41/mo
- Projected year-2 tax
- $1,482 · $124/mo
- Expected delta
- +$991/yr (+$83/mo · 202.1%)
ⓘ Screening estimate from a state-policy table — verify with the county assessor before closing.
Climate risk First Street
- Flood 5/10 Major FEMA zone X (shaded) · 45% chance over 30 yrs
- Wildfire 7/10 Severe
- Heat 8/10 Severe 7 d/yr ≥105°F today · 17 d/yr by 30 yrs out
- Wind 1/10 Low
- Air quality 10/10 Extreme 44 unhealthy d/yr today · 50 by 30 yrs out
Nearby sold comps map
Loading sold comps map…
Walkable amenities ~0.75 mi
Loading nearby amenities…
Taxation est. · year 1
- Rental income
- $21,581
- − Mortgage interest
- −$10,923
- − Property taxes
- −$491
- − Insurance
- −$975
- − Repairs & maintenance
- −$1,726
- − Management
- −$1,726
- − Depreciation
- −$5,673
- Taxable income
- $66
- Est. tax owed @ 24.0%
- −$16
- After-tax cash flow
- $3,296/yr
For passive investors: Depreciation is non-cash, so a rental often shows a tax loss while cash-flowing — sheltering income. Rental losses are passive: they offset passive income freely, and up to $25,000/yr can offset ordinary (W-2) income if you actively participate and your MAGI is under $100k (phasing out to $0 by $150k); unused losses carry forward. On sale, claimed depreciation is recaptured at up to 25%, and gains may owe capital-gains tax (a 1031 exchange can defer both). Figures are a year-1 estimate at your 24.0% rate — not tax advice; consult a CPA.
Schools (NCES district)
- District
- Visalia Unified
- NCES district ID
- 0641160
- Math proficiency
- 30% ▼ -3.00%
- Reading proficiency
- 40% ▼ -10.00%
- Median HH income
- $51,672
- Composite
- 30.47/100
- National rank
- #6223
- State rank
- #273 of 517 in CA
Livability — Visalia
- Score
- 72/100
- State rank
- #196
- US rank
- #6351
Category grades
Schools grade is shown separately in the Schools card above.
Census & demographics
- County
- Tulare County · 323,826 people
- City population
- 163,333
- Metro
- Visalia, CA
- Population (ZIP)
- 45,780
- Household income
- $82,872
- Rent vs Own
- Severe rent burden
- 962.0
Population outlook (Tulare County) Hauer SSP2
- Today (2025)
- 484,681 people
- By 2030
- 496,241 · +2.4%
- By 2040
- 518,507 · +7.0%
- By 2050
- 534,920 · +10.4%
- By 2075
- 548,417 · +13.2%
- By 2100
- 513,085 · +5.9%
Race, ethnicity, and origin ACS 2023
- Neighborhood character
- Diverse neighborhood (Simpson 0.56)
- Race & ethnicity
- Hispanic / Latino 57% White 35% Two or more races 19% Asian 3% Black 2% Native American 1%
- Hispanic origin (detail)
- Mexican 51%
- Common ancestry
- Russian 2% Lithuanian 2% Iranian 1%
- Foreign-born
- 14% · Canada
- Languages at home
- 63% English-only · Spanish 33% Other Indo-European 1% Korean 1%
Political lean MEDSL · Tulare
- 2024 margin
- Strong R (+20.7) · D 38.5% · R 59.2% · Other 2.3%
- 2008→2024 swing
- -5.4pp toward R · 2008: -15.3pp · 2024: -20.7pp
- All cycles
- 2024: R+20.7 2020: R+7.8 2016: R+12.1 2012: R+17.8 2008: R+15.3
Not yet ingested
- Civics
- —
Market trends
- HPI YoY
- ▼ -238.10%
- Current HPI
- 323.2649
- Rent YoY
- ▲ 1.99%
- Metro
- Visalia, CA
- State GDP YoY
- ▲ 3.21%
- F500 in state
- 116
Industry mix (Fortune 500 HQ in CA)
| Industry | F500 HQs | Revenue |
|---|---|---|
| Technology | 27 | $1,492B |
|
||
| Financial Services | 3 | $174B |
|
||
| Retail | 3 | $44B |
|
||
| Insurance | 3 | $26B |
|
||
| Media / Entertainment | 2 | $115B |
|
||
| Pharmaceuticals / Biotech | 2 | $62B |
|
||
Price history
+457.1% since first listed10 events — show timeline
- 2026-06-15 Listed $195,000 TCMLS
- 2025-05-02 Sold (Public Records) $160,000 Public Records
- 2025-05-02 Sold (MLS) $175,000 TCMLS
- 2025-03-10 Pending — TCMLS
- 2025-03-04 Relisted — TCMLS
- 2025-03-03 Pending — TCMLS
- 2025-02-27 Listed $175,000 TCMLS
- 1999-01-13 Sold (Public Records) $27,000 Public Records
- 1999-01-13 Sold (Public Records) $27,000 Public Records
- 1996-06-05 Sold (Public Records) $35,000 Public Records
Property tax history
-2.5%/yrLatest (2025): $491 · -0.7% YoY. Source: county tax records.
Cash-flow waterfall
monthlySold comps — $/sqft
last 12 mo · ≤1 miLoading sold comps…