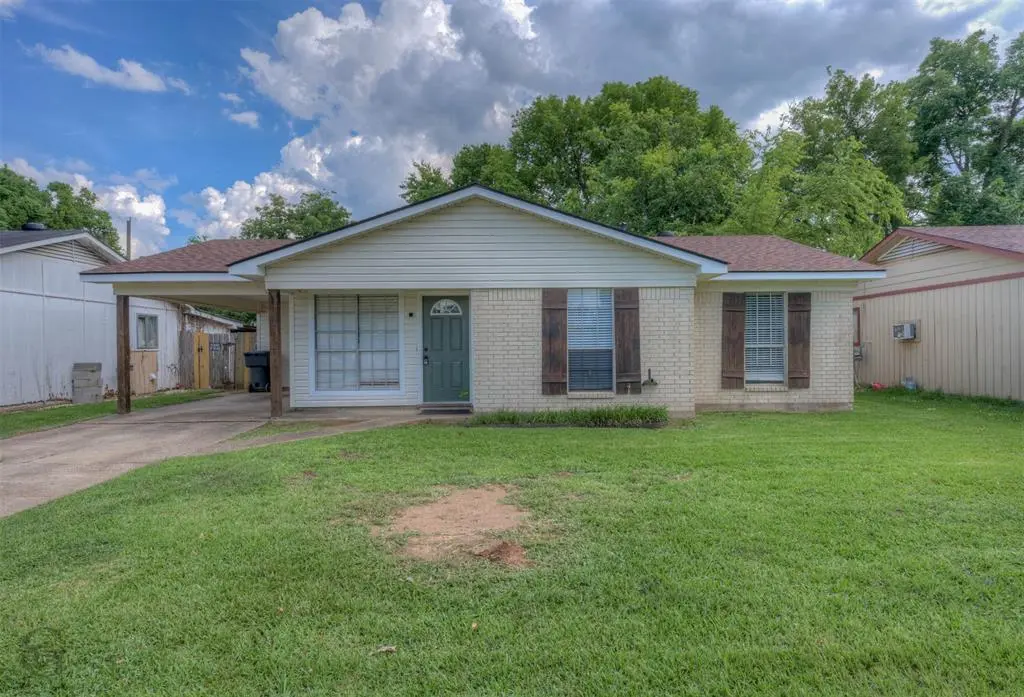
4936 Okeefe St · Bossier City, LA
Flood risk 1/10 · Minimal
- FEMA flood zone
- X (unshaded)
- Chance of flooding over 30 yrs
- 0.0%
- Est. flood insurance / yr
- $507 – $1,088
Fire risk 2/10 · Minimal
- Est. fire insurance / yr
- $1,269 – $2,357
Heat risk 7/10 · Major
- Hot days now (above 110°F)
- 7 days/yr
- Hot days in 30 yrs
- 21 days/yr
Wind risk 6/10 · Moderate
- Chance of severe wind over 30 yrs
- 66.0%
Air-quality risk 2/10 · Minimal
- Unhealthy air days now
- 1 days/yr
- Unhealthy air days in 30 yrs
- 2 days/yr
Risk factors via First Street. Map © Google.
Why this score? — see what drove the D+ grade
The composite is a weighted blend of 9 inputs, each scored 0–100. Each bar is that input's sub-score; the figure is the points it added to the 100-point composite (weight × sub-score).
- Cash flow +21.1/30.0
- DSCR +6.7/10.0
- 1% rule +4.6/10.0
- Rent growth +4.1/5.0
- Schools +3.8/10.0
- Livability +3.6/5.0
- Condition / age +2.5/5.0
- ARV discount +0.0/15.0
- Appreciation +0.0/10.0
$149,900
🖨 Deal sheet (PDF) 📄 Offer letter ✓ Due diligence
Listing remarks
Well-maintained and move-in ready, this charming 3-bedroom, 1.5-bath home offers comfort, convenience, and functional living space in a great Bossier location. The primary bedroom includes its own private half bath for added convenience. Inside, you'll also find a dedicated laundry room and a practical layout that makes everyday living easy. Step outside to enjoy the large covered rear patio—perfect for relaxing, entertaining, grilling, or enjoying outdoor space year-round. Conveniently located with quick access to both Central and East Bossier, just minutes from I-220, North Bossier shopping, dining, and everyday amenities. Also ideally situated for an easy commute to Barksdale Air F
Key facts
- Private half bath
- 7,144 sq ft lot
- Parking
Tags
Property features AI
Finance
- Other: Municipal Utility District: No; Possession at closing/funding; Standard listing conditions; Transaction type: For Sale
- Financial info: Listing accepts various financing types including Cash, FHA, FHA-203K, Fixed, VA Loan and other options; Second mortgage: none
- HOA & community: No homeowners association
Exterior
- Parking: Covered parking (1 covered space); 1 carport space; Driveway
- Utilities: City water; City sewer; Asphalt access
- Home design: Single family residence; Residential property; Built in 1975; One story
- Construction: Brick construction; Asphalt shingle roof; Slab foundation
- Exterior features: Lot under 0.5 acre (approx. 0.164 acres); Subdivision: Swan Lake
Interior
- Kitchen: Dishwasher
- Bedrooms: 3 bedrooms (primary bedroom on main level)
- Bathrooms: 2 bathrooms (1 full, 1 half)
- Heating & cooling: Central heating
- Interior features: One-level layout; Two total rooms (listed room count); Living area approximately 1088
- Laundry & utility: Electric dryer hookup; Utility room
Neighborhood map
What this means for you Summary
Snapshot
- This is a 3-bed/1.5-bath single-family listed at $150k.
Deal economics
- At list price, monthly cash flow is $213 ($3k/yr) — positive.
- The deal already cash-flows at list — no discount required.
- To meet the 1% rule (rent ≥ 1% of price), the offer needs to be $144k (3.9% below list).
- Recommended offer: $144k (3.9% below list) — sets the bar for 1% rule.
- Cap rate 8.0% vs local median 4.7% in Bossier City — top-decile yield for the area; either an underpriced asset or a hidden risk that comps aren't pricing in. Stress-test before assuming the spread holds.
Location & tenants
- Location reads 71/100 on livability (#47 in LA) — a middle-class / working-renter tenant base. Strengths: commute A+, cost of living A+, housing A+; Watch: employment D+, crime F, amenities F.
- Bossier Parish (urban): math 40% / reading 47% proficiency, ranked #17 of 98 in LA (top 17%) — families likely to look elsewhere, expect single-tenant / working-renter base with shorter leases.
- Zoned schools: Bossier Elementary School (math 8% / reading 17%, grade F, #550 of 646 statewide, top 88%, 222 students, 93% FRL) — zoned schools average 93% FRL vs 41% district-wide (52 pts higher); higher-poverty schools than district average — tighter screening recommended.
- Zoned-school proficiency averages 12% at this address vs 44% district-wide (-31 pts) — the specific schools serving this property underperform the Bossier Parish average; the district grade overstates school quality for this exact location.
- Market conditions: Rents rising fast (+6.6%/yr); 421 active listings in the ZIP; 10 comparable units currently listed for rent nearby; rentals at typical pace (median 22d on market — plan ~3-4 weeks tenant-placement turnaround); 716 units permitted in Bossier Parish in 2024 (0 in 5+ unit buildings).
Forward outlook
- Local home prices are declining (-3.0%/yr); year-one equity from $1k of loan paydown is wiped out by about $4k of value loss. Plan a longer hold.
- Bossier County population projected at +28% by 2050 — long-run rental-demand tailwind backs the buy-and-hold thesis.
- At projected returns (-3.0% appreciation + 6.6% rent growth), your $42k cash investment doubles in ~10 years — after that, you're playing with house money.
Negotiation context
- It's been on market 19 days — a 2% lower offer ($148k) is reasonable based on typical stale-listing flexibility.
- Current owner paid $90k; list at $150k implies a 67% gain — meaningful room to come down on a strong offer.
Risks & watch-outs
- Climate carrying-cost: major wind risk, 66% chance of damaging wind over 30y; extreme-heat days projected 7→21/yr by 2055 (HVAC capex compounding) — expect insurance premiums to compound above CPI over the hold.
Questions for the listing agent
- Built in 1975 — when were the roof, HVAC, electrical panel, plumbing, and water heater last replaced?
- Is there a deadline driving the sale (1031 exchange, divorce, estate, relocation)? That informs how much negotiation room exists.
- Schools are B-rated — typically a magnet for longer-tenancy family renters. What's the average tenant stay here, and is there a school-zone premium baked into asking?
- Crime grade is F in this area — have there been break-ins, vandalism, or insurance claims at this property in the last 3 years? What carrier currently insures it and at what premium?
- The area grade is low — what's the realistic commute time and amenity access for the typical tenant pool here? Any planned neighborhood developments (good or bad) we should know about?
- What's the average days-on-market for RENTAL listings here right now (not sales)? A rising rental-DOM trend means longer vacancies and softer asking-rent achievability than the comps imply.
- What's the recent tenant-quality profile in this submarket — average credit score on applications, eviction rate, late-payment / NSF rate, and stable-employment percentage? A property-management company in the area should have these aggregated.
- How much new for-sale + rental construction is in the pipeline within 1–3 miles? Heavy new supply typically softens prices + rents 12–24 months out; constrained supply supports both.
Investment metrics
- 1% rule
- 0.96% ✗
- Cap rate
- 8.00%
- Cash-on-cash
- 6.08%
- DSCR
- 1.27
- GRM
- 8.7
CMA / ARV
- ARV (on-the-fly)
- $124,032
- Comps found
- 12
Show comp detail 12 sales within ~0.75 mi
| Address | Dist | Beds/Ba | Sqft | Sold | Price | $/sf | Match |
|---|---|---|---|---|---|---|---|
| 4844 Camellia Ln | 0.13mi | 3/1.5 | 1,091 (+0%) | 3mo | $149,900 | $137 | 91 |
| 4913 Dahlia Dr | 0.12mi | 3/1.5 | 1,021 (-6%) | 10mo | $105,000 | $103 | 76 |
| 4908 Okeefe St | 0.15mi | 3/1.5 | 1,023 (-6%) | 11mo | $95,900 | $94 | 74 |
| 4853 Lilac Cir | 0.20mi | 3/1.5 | 1,013 (-7%) | 8mo | $122,000 | $120 | 72 |
| 4817 Orchid Cir | 0.32mi | 3/1.5 | 1,006 (-8%) | 8mo | $119,900 | $119 | 66 |
| 4809 Sullivan St | 0.30mi | 3/1.5 | 1,186 (+9%) | 9mo | $115,000 | $97 | 63 |
| 4717 Okeefe St | 0.40mi | 3/2.5 | 1,144 (+5%) | 11mo | $129,900 | $114 | 60 |
| 4517 Donnie Ave | 0.62mi | 3/1.0 | 1,022 (-6%) | 3mo | $128,000 | $125 | 57 |
| 4610 Voss Dr | 0.68mi | 3/2.0 | 1,126 (+4%) | 9mo | $127,500 | $113 | 53 |
| 4603 Sullivan St | 0.56mi | 3/1.0 | 1,152 (+6%) | 11mo | $89,900 | $78 | 53 |
| 4603 Okeefe St | 0.55mi | 3/1.0 | 1,248 (+15%) | 3mo | $111,900 | $90 | 46 |
| 1022 Norris Dr | 0.74mi | 3/1.0 | 997 (-8%) | 6mo | $115,000 | $115 | 44 |
Match score weights: distance 35% · size 25% · config 20% · recency 20%. Top-matched comps best support the ARV.
Projected returns pro-forma
-3.0% appreciation · 6.56% rent growth · sell at horizon
- IRR
- -3.3%
- Equity multiple
- 0.87×
- Total profit
- $-5,448
- Equity at exit
- $22,351
- IRR
- 9.7%
- Equity multiple
- 1.86×
- Total profit
- $36,098
- Equity at exit
- $12,961
Cash invested: $41,972 (down + closing). Projections, not guarantees.
Landlord ↔ Tenant lean methodology
- Overall (STATE)
- 90 Strongly Landlord-Friendly
- State Louisiana
- 90 Strongly Landlord-Friendly · R+12
- County
- — inherits STATE
- City
- — inherits STATE
ZIP-level market 71111
- Home prices YoY
- -34.8%
- Rents YoY
- 6.6%
- Active inventory
- 421
- Price-to-rent
- 8.7×
Monthly cashflow live
- Estimated rent
- $1,440 high interval (Pro) →
- Mortgage (P&I)
- −$786
- Tax from tax record
- −$76 /mo · $915/yr
- Insurance
- −$62
- HOA
- −$0
- Vacancy / Maint / Mgmt
- −$302
- Net cashflow
- $213
Break-even live
Sensitivity live
| Price | -10% $298 | -5% $255 | +0% $213 | +5% $170 | +10% $128 |
|---|---|---|---|---|---|
| Rent | -10% $99 | -5% $156 | +0% $213 | +5% $270 | +10% $326 |
| Rate | -1.0pp $288 | -0.5pp $251 | base $213 | +0.5pp $174 | +1.0pp $134 |
UW: 25.0% down · 7.5% · 30yr · 1.5% tax · 5.0% vac · 8.0% maint · 8.0% mgmt
Financing live
Cash to close
- Down payment
- $37,475
- Closing costs
- $4,497
- Reserves months
- —
- Total cash needed
- —
Loan-product check · same deal, 3 products live
Conventional
25% down · 7.5% · 30yr
- Down + closing
- —
- Monthly P&I
- —
- Monthly cashflow
- —
- DSCR
- —
- Eligible?
- —
Personal DTI + credit; lowest rate.
DSCR
20% down · 8.5% · 30yr
- Down + closing
- —
- Monthly P&I
- —
- Monthly cashflow
- —
- DSCR
- —
- Eligible?
- —
No personal income docs; deal must DSCR.
Hard money
10% down · 12.0% · 12mo
- Down + closing
- —
- Monthly P&I
- —
- Monthly cashflow
- —
- DSCR
- —
- Eligible?
- —
Short-term bridge; refi at stabilization.
Rent comps 10 comps
| Address | Beds | Baths | Sqft | Rent | $/sqft | DOM | Units | Dist |
|---|---|---|---|---|---|---|---|---|
| 4720 Okeefe St Bossier City, LA | 3.0 | 1.0 | 1212 | $1,300 | $1.07 | 21d | 1 | 0.38mi |
| 5705 E Texas St #175 Bossier City, LA | 2.0 | 1.5 | 1044 | $1,050 | $1.01 | 44d | 1 | 0.44mi |
| 4612 Sullivan St Bossier City, LA | 3.0 | 1.0 | 864 | $1,200 | $1.39 | 21d | 1 | 0.50mi |
| 5200 E Texas St Bossier City, LA | 1.0–3.0 | 1.0–2.0 | 1068 | $1,731 | $1.62 | 14d | 28 | 0.51mi |
| 800 Venecia Dr Bossier City, LA | 3.0 | 2.0 | 1363 | $2,000 | $1.47 | 44d | 1 | 0.65mi |
| 1206 Olwen Dr Bossier City, LA | 3.0 | 1.0 | 1056 | $975 | $0.92 | 14d | 1 | 0.76mi |
| 1314 Lampkin St Bossier City, LA | 2.0 | 1.0 | 1000 | $1,000 | $1.00 | 21d | 1 | 0.90mi |
| 1523 Lampkin Cir Bossier City, LA | 3.0 | 1.0 | 1114 | $1,150 | $1.03 | 21d | 1 | 1.03mi |
| 1315 Norris Dr Bossier City, LA | 3.0 | 1.0 | 1095 | $1,150 | $1.05 | 21d | 1 | 1.05mi |
| 1419 Teekell St Bossier City, LA | 3.0 | 1.0 | 1146 | $1,400 | $1.22 | 44d | 1 | 1.10mi |
Listing history 14 events
-
2026-06-18days on market $149,900 Active 19 DOM
-
2026-06-17days on market $149,900 Active 18 DOM
-
2026-06-16days on market $149,900 Active 17 DOM
-
2026-06-15days on market $149,900 Active 16 DOM
-
2026-06-14days on market $149,900 Active 14 DOM
-
2026-06-13days on market $149,900 Active 13 DOM
-
2026-06-10days on market $149,900 Active 11 DOM
-
2026-06-09days on market $149,900 Active 10 DOM
-
2026-06-08days on market $149,900 Active 9 DOM
-
2026-06-07days on market $149,900 Active 8 DOM
-
2026-06-02days on market $149,900 Active 3 DOM
-
2026-06-01days on market $149,900 Active 2 DOM
-
2026-05-31remarks 693-char remark
-
2026-05-31$149,900 Active 1 DOM
ⓘ Source: listings_history table (triggers on properties + properties_extension) + one-shot
backfill from property_details.listing_events for pre-trigger history.
Tax reassessment forecast LA · Resets to sale price
- Current annual tax
- $915 · $76/mo
- Projected year-2 tax
- $915 · $76/mo
- Expected delta
- $0/yr ($0/mo · 0.0%)
ⓘ Screening estimate from a state-policy table — verify with the county assessor before closing.
Climate risk First Street
- Flood 1/10 Low FEMA zone X (unshaded) · 0% chance over 30 yrs
- Wildfire 2/10 Low
- Heat 7/10 Severe 7 d/yr ≥110°F today · 21 d/yr by 30 yrs out
- Wind 6/10 Major 66% chance of damaging wind over 30 yrs
- Air quality 2/10 Low 1 unhealthy d/yr today · 2 by 30 yrs out
Nearby sold comps map
Loading sold comps map…
Walkable amenities ~0.75 mi
Loading nearby amenities…
Taxation est. · year 1
- Rental income
- $17,279
- − Mortgage interest
- −$8,397
- − Property taxes
- −$915
- − Insurance
- −$750
- − Repairs & maintenance
- −$1,382
- − Management
- −$1,382
- − Depreciation
- −$4,361
- Taxable income
- $92
- Est. tax owed @ 24.0%
- −$22
- After-tax cash flow
- $2,530/yr
For passive investors: Depreciation is non-cash, so a rental often shows a tax loss while cash-flowing — sheltering income. Rental losses are passive: they offset passive income freely, and up to $25,000/yr can offset ordinary (W-2) income if you actively participate and your MAGI is under $100k (phasing out to $0 by $150k); unused losses carry forward. On sale, claimed depreciation is recaptured at up to 25%, and gains may owe capital-gains tax (a 1031 exchange can defer both). Figures are a year-1 estimate at your 24.0% rate — not tax advice; consult a CPA.
Schools (NCES district)
- District
- Bossier Parish
- NCES district ID
- 2200270
- Math proficiency
- 40% ▼ -32.00%
- Reading proficiency
- 47% ▼ -28.00%
- Median HH income
- $51,326
- Composite
- 37.5/100
- National rank
- #4402
- State rank
- #17 of 98 in LA
Livability — Bossier City
- Score
- 71/100
- State rank
- #47
- US rank
- #7044
Category grades
Schools grade is shown separately in the Schools card above.
Census & demographics
- Census place
- Bossier City, LA
- County
- Bossier Parish · 98,704 people
- City population
- 91,925
- Metro
- Shreveport-Bossier City, LA
- Population (ZIP)
- 43,925
- Household income
- $65,292
- Rent vs Own
- Severe rent burden
- 1942.0
Population outlook (Bossier County) Hauer SSP2
- Today (2025)
- 143,247 people
- By 2030
- 151,802 · +6.0%
- By 2040
- 168,194 · +17.4%
- By 2050
- 183,533 · +28.1%
- By 2075
- 217,009 · +51.5%
- By 2100
- 230,091 · +60.6%
Race, ethnicity, and origin ACS 2023
- Neighborhood character
- Diverse neighborhood (Simpson 0.60)
- Race & ethnicity
- White 56% Black 29% Hispanic / Latino 9% Two or more races 8% Asian 3%
- Hispanic origin (detail)
- Mexican 5%
- Common ancestry
- Lithuanian 2% Iranian 1% Slovak 1%
- Foreign-born
- 5% · Canada, Vietnam
- Languages at home
- 90% English-only · Spanish 7% Vietnamese 1% French/Haitian/Cajun 1%
Political lean MEDSL · Bossier
- 2024 margin
- Solid R (+43.3) · D 27.7% · R 71.0% · Other 1.3%
- 2008→2024 swing
- +0.3pp no change · 2008: -43.7pp · 2024: -43.3pp
- All cycles
- 2024: R+43.3 2020: R+41.0 2016: R+45.8 2012: R+45.4 2008: R+43.7
Not yet ingested
- Civics
- —
Market trends
- HPI YoY
- ▼ -79.78%
- Current HPI
- 149.4336
- Rent YoY
- ▲ 6.56%
- Metro
- Shreveport-Bossier City, LA
- State GDP YoY
- ▲ 3.29%
- F500 in state
- 10
Industry mix (Fortune 500 HQ in LA)
| Industry | F500 HQs | Revenue |
|---|---|---|
| Telecommunications | 2 | $23B |
|
||
| Utilities | 1 | $12B |
|
||
| Wholesale / Distribution | 1 | $5B |
|
||
| Advertising | 1 | $2B |
|
||
Price history
+61.2% since first listed4 events — show timeline
- 2026-05-30 Listed $149,900 NTREIS
- 2012-09-04 Sold (Public Records) $89,900 Public Records
- 2007-05-18 Sold (Public Records) $93,000 Public Records
- 2005-03-02 Sold (Public Records) — Public Records
Property tax history
+10.6%/yrLatest (2025): $915 · -1.3% YoY. Source: county tax records.
Cash-flow waterfall
monthlySold comps — $/sqft
last 12 mo · ≤1 miLoading sold comps…