2024 Clayton Homestead 16602A Plan · Converse, TX
Flood risk 1/10 · Minimal
- FEMA flood zone
- X (unshaded)
- Chance of flooding over 30 yrs
- 0.0%
- Est. flood insurance / yr
- $507 – $1,088
Fire risk 5/10 · Moderate
- Est. fire insurance / yr
- $1,222 – $2,270
Heat risk 8/10 · Major
- Hot days now (above 108°F)
- 7 days/yr
- Hot days in 30 yrs
- 22 days/yr
Wind risk 8/10 · Major
- Chance of severe wind over 30 yrs
- 80.0%
Air-quality risk 1/10 · Minimal
- Unhealthy air days now
- 0 days/yr
- Unhealthy air days in 30 yrs
- 0 days/yr
Risk factors via First Street. Map © Google.
Why this score? — see what drove the B- grade
The composite is a weighted blend of 9 inputs, each scored 0–100. Each bar is that input's sub-score; the figure is the points it added to the 100-point composite (weight × sub-score).
- Cash flow +30.0/30.0
- 1% rule +10.0/10.0
- DSCR +10.0/10.0
- ARV discount +7.5/15.0
- Condition / age +4.0/5.0
- Livability +3.3/5.0
- Schools +2.4/10.0
- Rent growth +2.2/5.0
- Appreciation +0.0/10.0
$79,900
🖨 Deal sheet 📄 Offer letter ✓ Due diligence
Listing remarks MLS
Converse Meadows is an exciting and evolving manufactured home community in Converse, Texas. Our community features a range of affordable homes and is undergoing a significant transformation with the addition of new amenities. Residents will enjoy a modern clubhouse, a refreshing pool, a welcoming sales center, a charming gazebo, and a lively BBQ area, all contributing to a vibrant and enjoyable living environment. Come explore Converse Meadows and find your new home.
Key facts
- Listed 520 days
Neighborhood map
What this means for you Summary
Snapshot
- This is a 2-bed/2.0-bath manufactured listed at $80k. Condition is rated good.
Deal economics
- At list price, monthly cash flow is $444 ($5k/yr) — positive.
- The deal already cash-flows at list — no discount required.
- Meets the 1% rule at list price ($1k rent vs $80k).
- Recommended offer: $70k (12.0% below list) — sets the bar for market timing.
- Cap rate 13.0% vs local median 4.4% in Converse — top-decile yield for the area; either an underpriced asset or a hidden risk that comps aren't pricing in. Stress-test before assuming the spread holds.
Location & tenants
- Location reads 66/100 on livability (#649 in TX) — a middle-class / working-renter tenant base. Strengths: cost of living A+, housing A+, employment B; Watch: schools C-, crime C-, amenities F.
- Judson ISD (suburban): math 21% / reading 33% proficiency, ranked #660 of 826 in TX (top 80%) — low school quality limits family demand, transient renter base, plan for 1-2y turnover.
- Market conditions: Rents soft (-1.1%/yr); 1152 active listings in the ZIP; 21 comparable units currently listed for rent nearby; rentals leasing fast (median 11d on market — plan ~1-2 weeks tenant-placement turnaround); solid renter incomes; 8,308 units permitted in Bexar County in 2024 (2,506 in 5+ unit buildings).
- This rent is only 17% of the median local income ($91k/yr) — well below the 30% rent-burden line; pricing power to push rent on renewal without tenant pushback.
Forward outlook
- Local home prices are declining (-3.0%/yr); year-one equity from $552 of loan paydown is wiped out by about $2k of value loss. Plan a longer hold.
- Bexar County population projected at +50% by 2050 — long-run rental-demand tailwind backs the buy-and-hold thesis.
- At projected returns (-3.0% appreciation + 0.0% rent growth), your $22k cash investment doubles in ~7 years — after that, you're playing with house money.
Negotiation context
- It's been on market 520 days — a 12% lower offer ($70k) is reasonable based on typical stale-listing flexibility.
- 2 sale attempts with the ask held roughly flat each time — persistent listings suggest the price (not the market) is what's stuck; bring a comps-based counter.
Risks & watch-outs
- Climate carrying-cost: severe wind risk, 80% chance of damaging wind over 30y; moderate wildfire risk; extreme-heat days projected 7→22/yr by 2055 (HVAC capex compounding) — expect insurance premiums to compound above CPI over the hold.
Questions for the listing agent
- It's been on market 520 days. Have you received any prior offers? Is the seller open to a 12% concession, seller financing, or rate buy-down credit?
- Why hasn't it sold? Are there any deal-killer items the seller is aware of (foundation, flood, title, zoning, code violations)?
- Is there a deadline driving the sale (1031 exchange, divorce, estate, relocation)? That informs how much negotiation room exists.
- What's the average days-on-market for RENTAL listings here right now (not sales)? A rising rental-DOM trend means longer vacancies and softer asking-rent achievability than the comps imply.
- What's the recent tenant-quality profile in this submarket — average credit score on applications, eviction rate, late-payment / NSF rate, and stable-employment percentage? A property-management company in the area should have these aggregated.
- How much new for-sale + rental construction is in the pipeline within 1–3 miles? Heavy new supply typically softens prices + rents 12–24 months out; constrained supply supports both.
Investment metrics
- 1% rule
- 1.58% ✓
- Cap rate
- 12.97%
- Cash-on-cash
- 23.84%
- DSCR
- 2.06
- GRM
- 5.3
CMA / ARV
No comps found within radius.
Projected returns pro-forma
-3.0% appreciation · 0.0% rent growth · sell at horizon
- IRR
- 13.6%
- Equity multiple
- 1.52×
- Total profit
- $11,682
- Equity at exit
- $11,913
- IRR
- 20.0%
- Equity multiple
- 2.45×
- Total profit
- $32,412
- Equity at exit
- $6,908
Cash invested: $22,372 (down + closing). Projections, not guarantees.
Landlord ↔ Tenant lean methodology
- Overall (STATE)
- 87 Strongly Landlord-Friendly
- State Texas
- 87 Strongly Landlord-Friendly · R+5
- County
- — inherits STATE
- City
- — inherits STATE
ZIP-level market 78109
- Home prices YoY
- -17.8%
- Rents YoY
- -1.1%
- Active inventory
- 1152
- Price-to-rent
- 5.3×
Monthly cashflow live
- Estimated rent
- $1,262 high interval (Pro) →
- Mortgage (P&I)
- −$419
- Tax est. 1.5%
- −$100 /mo · $1,198/yr
- Insurance
- −$33
- HOA
- −$0
- Vacancy / Maint / Mgmt
- −$265
- Net cashflow
- $444
Break-even live
UW: 25.0% down · 7.5% · 30yr · 1.5% tax · 5.0% vac · 8.0% maint · 8.0% mgmt
Financing live
Cash to close
- Down payment
- $19,975
- Closing costs
- $2,397
- Reserves months
- —
- Total cash needed
- —
Loan-product check · same deal, 3 products live
Conventional
25% down · 7.5% · 30yr
- Down + closing
- —
- Monthly P&I
- —
- Monthly cashflow
- —
- DSCR
- —
- Eligible?
- —
Personal DTI + credit; lowest rate.
DSCR
20% down · 8.5% · 30yr
- Down + closing
- —
- Monthly P&I
- —
- Monthly cashflow
- —
- DSCR
- —
- Eligible?
- —
No personal income docs; deal must DSCR.
Hard money
10% down · 12.0% · 12mo
- Down + closing
- —
- Monthly P&I
- —
- Monthly cashflow
- —
- DSCR
- —
- Eligible?
- —
Short-term bridge; refi at stabilization.
Rent comps 21 comps
| Address | Beds | Baths | Sqft | Rent | $/sqft | DOM | Units | Dist |
|---|---|---|---|---|---|---|---|---|
| 9060 FM 78 Converse, TX | 1.0–2.0 | 1.0 | 769 | $1,150 | $1.50 | 1d | 11 | 0.46mi |
| 305 Jeanette Dr Converse, TX | 3.0 | 2.0 | 1084 | $1,600 | $1.48 | 24d | 1 | 0.47mi |
| 209 Royal Dr Converse, TX | 3.0 | 2.0 | 952 | $1,500 | $1.58 | 15d | 1 | 0.53mi |
| 8355 Crestway Dr Unit 610 Converse, TX | 1.0 | 1.0 | 556 | $747 | $1.34 | 3d | 1 | 0.64mi |
| 8355 Crestway Dr Unit 710 Converse, TX | 2.0 | 2.0 | 865 | $947 | $1.09 | 3d | 1 | 0.64mi |
| 812 Station St Converse, TX | 2.0 | 1.0 | 1100 | $975 | $0.89 | 24d | 1 | 0.67mi |
| 202 Ash Dr Unit 103 Converse, TX | 2.0 | 2.0 | 900 | $995 | $1.11 | 24d | 1 | 0.69mi |
| 810 Station St Apt 3 Converse, TX | 2.0 | 2.0 | 1088 | $825 | $0.76 | 4d | 1 | 0.69mi |
| 810 Station St Unit 1 Converse, TX | 2.0 | 2.0 | 1088 | $899 | $0.83 | 24d | 1 | 0.69mi |
| 517 Oak Dr Converse, TX | 3.0 | 1.5 | 894 | $1,500 | $1.68 | 24d | 1 | 0.73mi |
| 301 Converse Center St Converse, TX | 1.0–3.0 | 1.0–2.0 | 975 | $1,184 | $1.21 | 43d | 1 | 0.94mi |
| 320 Station St Unit 101 Converse, TX | 2.0 | 2.0 | 877 | $825 | $0.94 | 12d | 1 | 0.97mi |
| 9180 Shadow Creek Ln Unit 710 Converse, TX | 2.0 | 2.0 | 848 | $1,169 | $1.38 | 3d | 1 | 1.02mi |
| 9205 Farm to Market Road 78 Unit 710 Converse, TX | 2.0 | 2.0 | 896 | $1,051 | $1.17 | 3d | 1 | 1.32mi |
| 9205 Farm to Market Road 78 Unit 610 Converse, TX | 1.0 | 1.0 | 597 | $941 | $1.58 | 3d | 1 | 1.32mi |
| 8406 Forest Ridge Dr San Antonio, TX | 3.0 | 2.0 | 1121 | $1,500 | $1.34 | 43d | 1 | 1.40mi |
| 531 Erna Dr Converse, TX | 3.0 | 2.0 | 1002 | $1,350 | $1.35 | 11d | 1 | 1.40mi |
| 7128 Elm Cv San Antonio, TX | 2.0 | 2.0 | 661 | $1,097 | $1.66 | 4d | 1 | 1.41mi |
| 8416 Dixon Ridge Dr San Antonio, TX | 3.0 | 2.0 | 1104 | $1,225 | $1.11 | 3d | 1 | 1.42mi |
| 7037 Elm Cv San Antonio, TX | 2.0 | 2.0 | 661 | $1,203 | $1.82 | 4d | 1 | 1.43mi |
| 7125 Elm Cv San Antonio, TX | 2.0 | 2.0 | 664 | $1,150 | $1.73 | 11d | 1 | 1.44mi |
Listing history 16 events
-
2026-06-18days on market $79,900 Active 520 DOM
-
2026-06-17days on market $79,900 Active 519 DOM
-
2026-06-16days on market $79,900 Active 518 DOM
-
2026-06-15days on market $79,900 Active 517 DOM
-
2026-06-13days on market $79,900 Active 515 DOM
-
2026-06-09days on market $79,900 Active 511 DOM
-
2026-06-08days on market $79,900 Active 510 DOM
-
2026-06-07days on market $79,900 Active 509 DOM
-
2026-06-04days on market $79,900 Active 506 DOM
-
2026-06-03days on market $79,900 Active 505 DOM
-
2026-06-02days on market $79,900 Active 504 DOM
-
2026-06-01days on market $79,900 Active 503 DOM
-
2026-05-31days on market $79,900 Active 502 DOM
-
2025-05-01status Active 472-char remark
Show marketing remark (472 chars)
Converse Meadows is an exciting and evolving manufactured home community in Converse, Texas. Our community features a range of affordable homes and is undergoing a significant transformation with the addition of new amenities. Residents will enjoy a modern clubhouse, a refreshing pool, a welcoming sales center, a charming gazebo, and a lively BBQ area, all contributing to a vibrant and enjoyable living environment. Come explore Converse Meadows and find your new home.
-
2025-05-01historical 472-char remark
Show marketing remark (472 chars)
Converse Meadows is an exciting and evolving manufactured home community in Converse, Texas. Our community features a range of affordable homes and is undergoing a significant transformation with the addition of new amenities. Residents will enjoy a modern clubhouse, a refreshing pool, a welcoming sales center, a charming gazebo, and a lively BBQ area, all contributing to a vibrant and enjoyable living environment. Come explore Converse Meadows and find your new home.
-
2025-01-15$79,900 Active 472-char remark
Show marketing remark (472 chars)
Converse Meadows is an exciting and evolving manufactured home community in Converse, Texas. Our community features a range of affordable homes and is undergoing a significant transformation with the addition of new amenities. Residents will enjoy a modern clubhouse, a refreshing pool, a welcoming sales center, a charming gazebo, and a lively BBQ area, all contributing to a vibrant and enjoyable living environment. Come explore Converse Meadows and find your new home.
ⓘ Source: listings_history table (triggers on properties + properties_extension) + one-shot
backfill from property_details.listing_events for pre-trigger history.
Climate risk First Street
- Flood 1/10 Low FEMA zone X (unshaded) · 0% chance over 30 yrs
- Wildfire 5/10 Major
- Heat 8/10 Severe 7 d/yr ≥108°F today · 22 d/yr by 30 yrs out
- Wind 8/10 Severe 80% chance of damaging wind over 30 yrs
- Air quality 1/10 Low 0 unhealthy d/yr today · 0 by 30 yrs out
Nearby sold comps map
Loading sold comps map…
Walkable amenities ~0.75 mi
Loading nearby amenities…
Taxation est. · year 1
- Rental income
- $15,138
- − Mortgage interest
- −$4,476
- − Property taxes
- −$1,198
- − Insurance
- −$400
- − Repairs & maintenance
- −$1,211
- − Management
- −$1,211
- − Depreciation
- −$2,324
- Taxable income
- $4,318
- Est. tax owed @ 24.0%
- −$1,036
- After-tax cash flow
- $4,297/yr
For passive investors: Depreciation is non-cash, so a rental often shows a tax loss while cash-flowing — sheltering income. Rental losses are passive: they offset passive income freely, and up to $25,000/yr can offset ordinary (W-2) income if you actively participate and your MAGI is under $100k (phasing out to $0 by $150k); unused losses carry forward. On sale, claimed depreciation is recaptured at up to 25%, and gains may owe capital-gains tax (a 1031 exchange can defer both). Figures are a year-1 estimate at your 24.0% rate — not tax advice; consult a CPA.
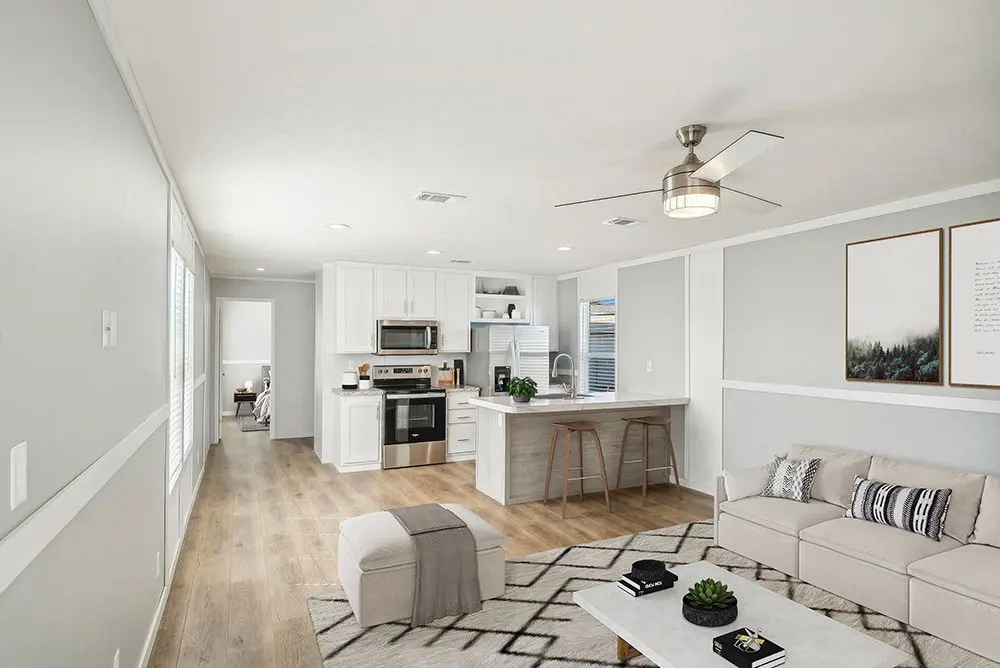
Condition & rehab AI · 1 photo
This manufactured home is in good condition with a modern and well-maintained interior. It is ready for a fresh coat of paint and some minor landscaping improvements to further enhance its appeal.
Value-add opportunities
- Both Paint touch-ups — Fresh paint can enhance the home's curb appeal and interior aesthetics.
- Both Lighting upgrades — Upgrading lighting fixtures can improve the home's ambiance and increase its appeal.
- Both Landscaping enhancements — Enhancing the landscaping can improve the home's curb appeal and attract more potential buyers or renters.
Renovation cost estimate screening
Value-add ROI direction
- Both Paint touch-ups — Fresh paint can enhance the home's curb appeal and interior aesthetics. ↑
- Both Lighting upgrades — Upgrading lighting fixtures can improve the home's ambiance and increase its appeal. ↑
- Both Landscaping enhancements — Enhancing the landscaping can improve the home's curb appeal and attract more potential buyers or renters. ↑
ⓘ Cost ranges are severity-bucket heuristics (US national rule-of-thumb). Get contractor quotes + a written scope before underwriting a rehab budget.
Schools (NCES district)
- District
- Judson ISD
- NCES district ID
- 4824990
- Math proficiency
- 21% ▼ -21.00%
- Reading proficiency
- 33% ▼ -7.00%
- Median HH income
- $57,542
- Composite
- 24.39/100
- National rank
- #7689
- State rank
- #660 of 826 in TX
Livability — Converse
- Score
- 66/100
- State rank
- #649
- US rank
- #12250
Category grades
Schools grade is shown separately in the Schools card above.
Census & demographics
- Census place
- Converse, TX
- County
- Bexar County · 1,990,555 people
- City population
- 63,067
- Metro
- San Antonio-New Braunfels, TX
- Population (ZIP)
- 63,067
- Household income
- $91,320
- Rent vs Own
- Severe rent burden
- 1732.0
Population outlook (Bexar County) Hauer SSP2
- Today (2025)
- 2,336,851 people
- By 2030
- 2,560,728 · +9.6%
- By 2040
- 3,020,569 · +29.3%
- By 2050
- 3,493,522 · +49.5%
- By 2075
- 4,668,459 · +99.8%
- By 2100
- 5,533,242 · +136.8%
Race, ethnicity, and origin ACS 2023
- Neighborhood character
- Diverse neighborhood (Simpson 0.69)
- Race & ethnicity
- Hispanic / Latino 44% White 27% Two or more races 21% Black 21% Asian 3%
- Hispanic origin (detail)
- Mexican 29% Puerto Rican 4%
- Common ancestry
- Lithuanian 1% Romanian 1% Italian 1%
- Foreign-born
- 11% · Canada, Vietnam, South Korea
- Languages at home
- 71% English-only · Spanish 23% Tagalog/Filipino 1% Other Asian/Pacific 1%
Political lean MEDSL · Bexar
- 2024 margin
- Lean D (+9.8) · D 54.3% · R 44.6% · Other 1.1%
- 2008→2024 swing
- +4.2pp toward D · 2008: 5.6pp · 2024: 9.8pp
- All cycles
- 2024: D+9.8 2020: D+18.2 2016: D+13.5 2012: D+4.6 2008: D+5.6
Not yet ingested
- Civics
- —
Market trends
- HPI YoY
- ▼ -51.02%
- Current HPI
- 236.4923
- Rent YoY
- ▼ -1.08%
- Metro
- San Antonio-New Braunfels, TX
- State GDP YoY
- ▲ 3.95%
- F500 in state
- 110
Industry mix (Fortune 500 HQ in TX)
| Industry | F500 HQs | Revenue |
|---|---|---|
| Energy | 16 | $1,198B |
|
||
| Technology | 5 | $198B |
|
||
| Engineering / Construction | 4 | $72B |
|
||
| Energy Services | 3 | $60B |
|
||
| Utilities | 3 | $41B |
|
||
| Healthcare | 2 | $330B |
|
||
Price history
3 events — show timeline
- 2025-05-01 Relisted — Zillow
- 2025-05-01 Delisted — Zillow
- 2025-01-15 Listed $79,900 Zillow
Cash-flow waterfall
monthlySold comps — $/sqft
last 12 mo · ≤1 miLoading sold comps…