 🏢 Co-op
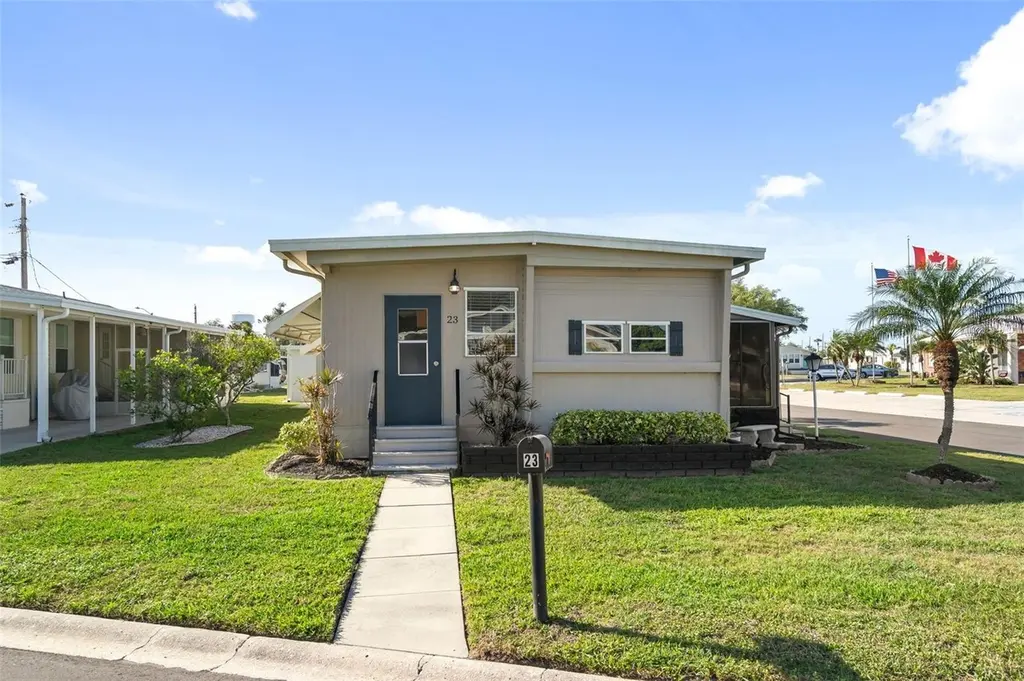
2900 8th Ave W #23 · Memphis, FL
Flood risk 5/10 · Moderate
- FEMA flood zone
- X (unshaded)
- Chance of flooding over 30 yrs
- 0.5%
- Est. flood insurance / yr
- $507 – $1,088
Fire risk 1/10 · Minimal
- Est. fire insurance / yr
- $947 – $1,759
Heat risk 10/10 · Severe
- Hot days now (above 107°F)
- 7 days/yr
- Hot days in 30 yrs
- 29 days/yr
Wind risk 10/10 · Severe
- Chance of severe wind over 30 yrs
- 99.0%
Air-quality risk 3/10 · Minor
- Unhealthy air days now
- 2 days/yr
- Unhealthy air days in 30 yrs
- 2 days/yr
Risk factors via First Street. Map © Google.
Why this score? — see what drove the C- grade
The composite is a weighted blend of 9 inputs, each scored 0–100. Each bar is that input's sub-score; the figure is the points it added to the 100-point composite (weight × sub-score).
- Cash flow +21.1/30.0
- ARV discount +7.5/15.0
- 1% rule +6.7/10.0
- DSCR +6.7/10.0
- Schools +4.4/10.0
- Livability +3.2/5.0
- Condition / age +2.5/5.0
- Rent growth +1.8/5.0
- Appreciation +0.0/10.0
$139,900
🖨 Deal sheet 📄 Offer letter ✓ Due diligence
Listing remarks
Welcome to 23 Shady Lane. This beautifully renovated 2 bedroom one and one half bath with upgrades thru out. With low fees of $214 per month the park is a co-op community with ownership in the land. This 55+ community offers amenities such as a swimming pool , pickle ball, and shuffleboard as well as a fitness center. Many events and activities will keep you busy and enjoying the company of your neighbors. A laundry room is located in a large storage unit at the rear of the carport. The park is located close to beaches, shopping, golf and all the conveniences of life. The property is turnkey furnished and move in ready.
Key facts
- Fitness center
- Laundry room
- Swimming pool
Tags
Property features AI
Finance
- Other: Furnished; Third party listing; Directions available
- Financial info: Total annual association fees: $2,568; Lease restrictions apply
- HOA & community: Monthly association fee of $214; Association name: Brittany Pendleton; Association approval required; Association fee includes common area taxes, pool, reserves, grounds maintenance, management, recreational facilities, sewer, trash and water; Community features include clubhouse, fitness center, pool, tennis courts, pickleball, shuffleboard, recreation facilities; buyer approval required; deed restrictions; golf carts allowed; Senior community; Pets not allowed
Exterior
- Parking: Driveway; Carport with 1 space
- Utilities: Public water; Public sewer; Public utilities; Electric water heater
- Home design: Residential mobile home (double wide); Completed condition; One level; Faces north; Entry on front porch
- Construction: Metal siding and frame construction; Metal roof; Crawlspace foundation; Built as double wide mobile home
- Exterior features: Covered, enclosed, screened front porch; Awnings; Rain gutters; Shade shutters; Mature landscaping; Corner lot; Landscaped; Paved; In county / unincorporated
Interior
- Kitchen: Microwave; Range; Refrigerator; Solid surface counters; Solid wood cabinets
- Bedrooms: 2 bedrooms
- Flooring: Carpet
- Bathrooms: 1 full bathroom; 1 half bathroom
- Heating & cooling: Central heating; Electric heating; Heat pump; Central air; Humidity control
- Interior features: Ceiling fans; Kitchen/family room combo; Formal dining area; Living/dining room combo; Open floorplan; Solid surface counters; Solid wood cabinets; Thermostat; Window treatments; Blinds
- Laundry & utility: Washer hookup; Dryer hookup; Electric water heater; Washer; Dryer
Neighborhood map
What this means for you Summary
Snapshot
- This is a 2-bed/1.0-bath manufactured listed at $140k.
Deal economics
- At list price, monthly cash flow is $200 ($2k/yr) — positive.
- The deal already cash-flows at list — no discount required.
- Meets the 1% rule at list price ($2k rent vs $140k).
- Recommended offer: $132k (6.0% below list) — sets the bar for market timing.
- Cap rate 8.0% vs local median 4.5% in Memphis — top-decile yield for the area; either an underpriced asset or a hidden risk that comps aren't pricing in. Stress-test before assuming the spread holds.
Location & tenants
- Location reads 63/100 on livability (#745 in FL) — a middle-class / working-renter tenant base. Strengths: cost of living A+, housing A+; Watch: employment D+, schools F, amenities F.
- Manatee (suburban): math 54% / reading 50% proficiency, ranked #26 of 73 in FL (top 36%) — acceptable for families but not a draw, mixed tenant base, ~2y average lease.
- Market conditions: Rents soft (-3.0%/yr); 1160 active listings in the ZIP; 4 comparable units currently listed for rent nearby; rentals at typical pace (median 24d on market — plan ~3-4 weeks tenant-placement turnaround); solid renter incomes; 7,472 units permitted in Manatee County in 2024 (1,782 in 5+ unit buildings).
Forward outlook
- Local home prices are declining (-3.0%/yr); year-one equity from $967 of loan paydown is wiped out by about $4k of value loss. Plan a longer hold.
- Manatee County population projected at +43% by 2050 — long-run rental-demand tailwind backs the buy-and-hold thesis.
Negotiation context
- It's been on market 65 days — a 6% lower offer ($132k) is reasonable based on typical stale-listing flexibility.
- Current owner paid $55k; list at $140k implies a 154% gain — meaningful room to come down on a strong offer.
Risks & watch-outs
- Climate carrying-cost: moderate flood risk; severe wind risk, 99% chance of damaging wind over 30y; extreme-heat days projected 7→29/yr by 2055 (HVAC capex compounding) — expect insurance premiums to compound above CPI over the hold.
Questions for the listing agent
- It's been on market 65 days. Have you received any prior offers? Is the seller open to a 6% concession, seller financing, or rate buy-down credit?
- Built in 1963 — when were the roof, HVAC, electrical panel, plumbing, and water heater last replaced?
- What does the HOA fee cover, when was the last increase, and are there any pending special assessments or reserve-fund shortfalls?
- Why hasn't it sold? Are there any deal-killer items the seller is aware of (foundation, flood, title, zoning, code violations)?
- Is there a deadline driving the sale (1031 exchange, divorce, estate, relocation)? That informs how much negotiation room exists.
- Schools are F-rated, which usually means shorter tenancies and higher turnover. Who's the typical renter profile here, and what's been the actual vacancy rate?
- What's the average days-on-market for RENTAL listings here right now (not sales)? A rising rental-DOM trend means longer vacancies and softer asking-rent achievability than the comps imply.
- What's the recent tenant-quality profile in this submarket — average credit score on applications, eviction rate, late-payment / NSF rate, and stable-employment percentage? A property-management company in the area should have these aggregated.
- How much new for-sale + rental construction is in the pipeline within 1–3 miles? Heavy new supply typically softens prices + rents 12–24 months out; constrained supply supports both.
Investment metrics
- 1% rule
- 1.17% ✓
- Cap rate
- 8.01%
- Cash-on-cash
- 6.13%
- DSCR
- 1.27
- GRM
- 7.1
CMA / ARV
No comps found within radius.
Projected returns pro-forma
-3.0% appreciation · 0.0% rent growth · sell at horizon
- IRR
- -10.6%
- Equity multiple
- 0.63×
- Total profit
- $-14,622
- Equity at exit
- $20,860
- IRR
- -6.8%
- Equity multiple
- 0.63×
- Total profit
- $-14,449
- Equity at exit
- $12,096
Cash invested: $39,172 (down + closing). Projections, not guarantees.
Landlord ↔ Tenant lean methodology
- Overall (STATE)
- 87 Strongly Landlord-Friendly
- State Florida
- 87 Strongly Landlord-Friendly · R+3
- County
- — inherits STATE
- City
- — inherits STATE
ZIP-level market 34221
- Rents YoY
- -3.0%
- Active inventory
- 1160
- Price-to-rent
- 7.1×
Monthly cashflow live
- Estimated rent
- $1,637 medium interval (Pro) →
- Mortgage (P&I)
- −$734
- Tax from tax record
- −$87 /mo · $1,048/yr
- Insurance
- −$58
- HOA
- −$214
- Vacancy / Maint / Mgmt
- −$344
- Net cashflow
- $200
Break-even live
UW: 25.0% down · 7.5% · 30yr · 1.5% tax · 5.0% vac · 8.0% maint · 8.0% mgmt
Financing live
Cash to close
- Down payment
- $34,975
- Closing costs
- $4,197
- Reserves months
- —
- Total cash needed
- —
Loan-product check · same deal, 3 products live
Conventional
25% down · 7.5% · 30yr
- Down + closing
- —
- Monthly P&I
- —
- Monthly cashflow
- —
- DSCR
- —
- Eligible?
- —
Personal DTI + credit; lowest rate.
DSCR
20% down · 8.5% · 30yr
- Down + closing
- —
- Monthly P&I
- —
- Monthly cashflow
- —
- DSCR
- —
- Eligible?
- —
No personal income docs; deal must DSCR.
Hard money
10% down · 12.0% · 12mo
- Down + closing
- —
- Monthly P&I
- —
- Monthly cashflow
- —
- DSCR
- —
- Eligible?
- —
Short-term bridge; refi at stabilization.
Rent comps 4 comps
| Address | Beds | Baths | Sqft | Rent | $/sqft | DOM | Units | Dist |
|---|---|---|---|---|---|---|---|---|
| 219 33rd St W Palmetto, FL | 1.0 | 1.0 | 440 | $1,350 | $3.07 | 23d | 1 | 0.30mi |
| 900 21st St E Palmetto, FL | 2.0–3.0 | 1.0 | 800 | $1,495 | $1.87 | 23d | 1 | 0.94mi |
| 516 12th St W Unit A Palmetto, FL | 2.0 | 1.0 | 612 | $1,350 | $2.21 | 16d | 1 | 1.09mi |
| 518 12th St W Palmetto, FL | 2.0 | 1.0 | 612 | $1,350 | $2.21 | 16d | 1 | 1.10mi |
HOA detail
- Monthly dues
- $214 · $2,568/yr
- Likely covers
- poolgym
Listing history 18 events
-
2026-06-18days on market $139,900 Active 65 DOM
-
2026-06-17days on market $139,900 Active 64 DOM
-
2026-06-16days on market $139,900 Active 63 DOM
-
2026-06-15days on market $139,900 Active 62 DOM
-
2026-06-13days on market $139,900 Active 60 DOM
-
2026-06-13days on market $139,900 Active 59 DOM
-
2026-06-10days on market $139,900 Active 57 DOM
-
2026-06-09days on market $139,900 Active 56 DOM
-
2026-06-08days on market $139,900 Active 55 DOM
-
2026-06-08days on market $139,900 Active 54 DOM
-
2026-06-03days on market $139,900 Active 50 DOM
-
2026-06-02days on market $139,900 Active 49 DOM
-
2026-06-01days on market $139,900 Active 48 DOM
-
2026-05-31days on market $139,900 Active 47 DOM
-
2026-04-14$139,900 Active
-
2017-03-01soldstatus $55,000
-
2016-02-22soldstatus $45,000
-
1990-12-26soldstatus $17,700
ⓘ Source: listings_history table (triggers on properties + properties_extension) + one-shot
backfill from property_details.listing_events for pre-trigger history.
Tax reassessment forecast FL · Resets to sale price
- Current annual tax
- $1,048 · $87/mo
- Projected year-2 tax
- $1,161 · $97/mo
- Expected delta
- +$113/yr (+$9/mo · 10.8%)
ⓘ Screening estimate from a state-policy table — verify with the county assessor before closing.
Climate risk First Street
- Flood 5/10 Major FEMA zone X (unshaded) · 50% chance over 30 yrs
- Wildfire 1/10 Low
- Heat 10/10 Extreme 7 d/yr ≥107°F today · 29 d/yr by 30 yrs out
- Wind 10/10 Extreme 99% chance of damaging wind over 30 yrs
- Air quality 3/10 Moderate 2 unhealthy d/yr today · 2 by 30 yrs out
Nearby sold comps map
Loading sold comps map…
Walkable amenities ~0.75 mi
Loading nearby amenities…
Taxation est. · year 1
- Rental income
- $19,646
- − Mortgage interest
- −$7,837
- − Property taxes
- −$1,048
- − Insurance
- −$700
- − Repairs & maintenance
- −$1,572
- − Management
- −$1,572
- − HOA
- −$2,568
- − Depreciation
- −$4,070
- Taxable income
- $281
- Est. tax owed @ 24.0%
- −$67
- After-tax cash flow
- $2,334/yr
For passive investors: Depreciation is non-cash, so a rental often shows a tax loss while cash-flowing — sheltering income. Rental losses are passive: they offset passive income freely, and up to $25,000/yr can offset ordinary (W-2) income if you actively participate and your MAGI is under $100k (phasing out to $0 by $150k); unused losses carry forward. On sale, claimed depreciation is recaptured at up to 25%, and gains may owe capital-gains tax (a 1031 exchange can defer both). Figures are a year-1 estimate at your 24.0% rate — not tax advice; consult a CPA.
Schools (NCES district)
- District
- Manatee
- NCES district ID
- 1201230
- Math proficiency
- 54% ▼ -6.00%
- Reading proficiency
- 50% ▼ -2.00%
- Median HH income
- $49,607
- Composite
- 44.43/100
- National rank
- #2806
- State rank
- #26 of 73 in FL
Livability — Memphis
- Score
- 63/100
- State rank
- #745
- US rank
- #16072
Category grades
Schools grade is shown separately in the Schools card above.
Census & demographics
- Census place
- Memphis, FL
- County
- Manatee County · 416,364 people
- Metro
- North Port-Sarasota-Bradenton, FL
- Population (ZIP)
- 56,208
- Household income
- $77,712
- Rent vs Own
- Severe rent burden
- 1193.0
Population outlook (Manatee County) Hauer SSP2
- Today (2025)
- 447,342 people
- By 2030
- 488,911 · +9.3%
- By 2040
- 567,934 · +27.0%
- By 2050
- 637,995 · +42.6%
- By 2075
- 781,970 · +74.8%
- By 2100
- 848,272 · +89.6%
Race, ethnicity, and origin ACS 2023
- Neighborhood character
- Diverse neighborhood (Simpson 0.58)
- Race & ethnicity
- White 59% Hispanic / Latino 22% Black 14% Two or more races 11%
- Hispanic origin (detail)
- Mexican 14% Puerto Rican 3%
- Common ancestry
- Romanian 2% Lithuanian 2% Italian 2%
- Foreign-born
- 10% · Canada, Dominican Republic, Jamaica
- Languages at home
- 81% English-only · Spanish 16% Other Indo-European 1%
Political lean MEDSL · Manatee
- 2024 margin
- Strong R (+23.5) · D 37.9% · R 61.4%
- 2008→2024 swing
- -16.5pp toward R · 2008: -7.0pp · 2024: -23.5pp
- All cycles
- 2024: R+23.5 2020: R+16.1 2016: R+17.1 2012: R+12.5 2008: R+7.0
Not yet ingested
- Civics
- —
Market trends
- HPI YoY
- ▼ -383.53%
- Current HPI
- 302.1458
- Rent YoY
- ▼ -2.98%
- Metro
- North Port-Sarasota-Bradenton, FL
- State GDP YoY
- ▲ 3.28%
- F500 in state
- 36
Industry mix (Fortune 500 HQ in FL)
| Industry | F500 HQs | Revenue |
|---|---|---|
| Industrial Technology | 2 | $29B |
|
||
| Insurance | 2 | $17B |
|
||
| Retail | 1 | $60B |
|
||
| Technology Distribution | 1 | $58B |
|
||
| Homebuilding | 1 | $35B |
|
||
| Technology Manufacturing | 1 | $35B |
|
||
Price history
+690.4% since first listed4 events — show timeline
- 2026-04-14 Listed $139,900 Stellar MLS as Distributed by MLS Grid
- 2017-03-01 Sold (Public Records) $55,000 Public Records
- 2016-02-22 Sold (Public Records) $45,000 Public Records
- 1990-12-26 Sold (Public Records) $17,700 Public Records
Property tax history
+6.0%/yrLatest (2025): $1,048 · -5.6% YoY. Source: county tax records.
Cash-flow waterfall
monthlySold comps — $/sqft
last 12 mo · ≤1 miLoading sold comps…