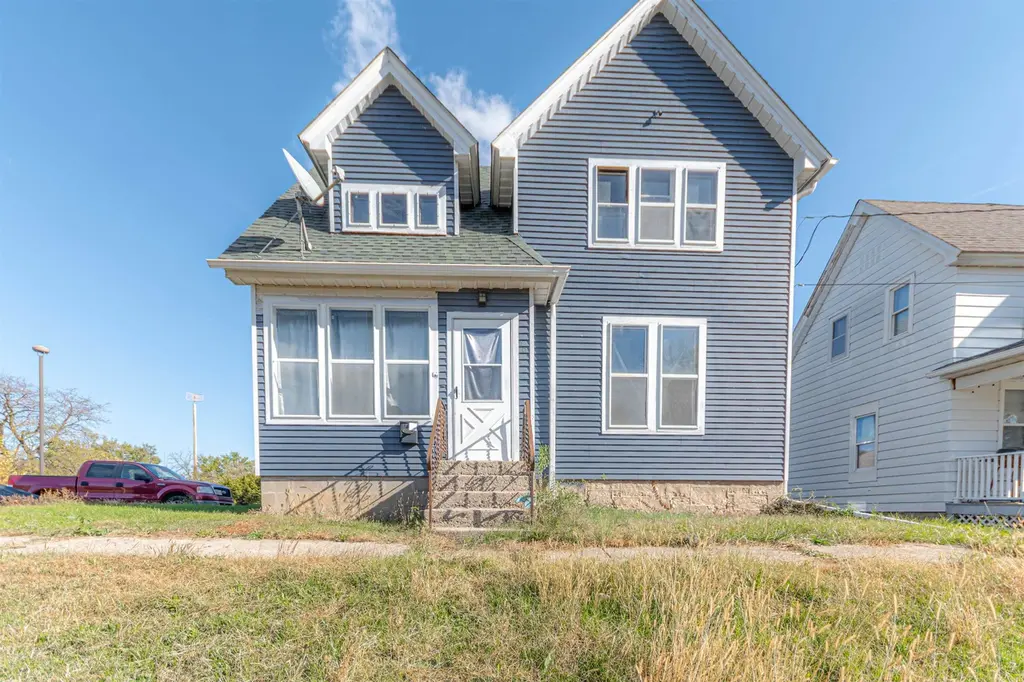
509 N 6th St · Rockford, IL
Flood risk 1/10 · Minimal
- FEMA flood zone
- X (unshaded)
- Chance of flooding over 30 yrs
- 0.0%
- Est. flood insurance / yr
- $473 – $860
Fire risk 1/10 · Minimal
- Est. fire insurance / yr
- $804 – $1,492
Heat risk 3/10 · Minor
- Hot days now (above 101°F)
- 7 days/yr
- Hot days in 30 yrs
- 15 days/yr
Wind risk 2/10 · Minimal
- Chance of severe wind over 30 yrs
- —
Air-quality risk 2/10 · Minimal
- Unhealthy air days now
- 1 days/yr
- Unhealthy air days in 30 yrs
- 2 days/yr
Risk factors via First Street. Map © Google.
Why this score? — see what drove the C grade
The composite is a weighted blend of 9 inputs, each scored 0–100. Each bar is that input's sub-score; the figure is the points it added to the 100-point composite (weight × sub-score).
- Cash flow +30.0/30.0
- DSCR +10.0/10.0
- 1% rule +8.2/10.0
- Rent growth +4.0/5.0
- Livability +3.1/5.0
- Condition / age +2.5/5.0
- Schools +1.2/10.0
- ARV discount +0.0/15.0
- Appreciation +0.0/10.0
$129,000
🖨 Deal sheet 📄 Offer letter ✓ Due diligence
Listing remarks MLS
Spacious 4+ bedroom home with new roof conveniently located near the bus line and downtown. Includes a partially finished basement for extra space. The garage is equipped with a gas line and power lines. Public parking lot right next door provides plenty of parking space. Low taxes makes this a great investment property or starter home.
Key facts
- Gas line
- New roof
- 2,614 sq ft lot
Tags
Neighborhood map
What this means for you Summary
Snapshot
- This is a 4-bed/1.5-bath single-family listed at $129k.
Deal economics
- At list price, monthly cash flow is $514 ($6k/yr) — positive.
- The deal already cash-flows at list — no discount required.
- Meets the 1% rule at list price ($2k rent vs $129k).
- Recommended offer: $114k (12.0% below list) — sets the bar for market timing.
- Cap rate 11.1% vs local median 6.1% in Rockford — top-decile yield for the area; either an underpriced asset or a hidden risk that comps aren't pricing in. Stress-test before assuming the spread holds.
Location & tenants
- Location reads 62/100 on livability (#876 in IL) — a middle-class / working-renter tenant base. Strengths: cost of living A+, housing A+, health & safety A+; Watch: schools F, crime F, amenities F.
- Rockford SD 205 (urban): math 12% / reading 16% proficiency, ranked #533 of 620 in IL (top 86%) — low school quality limits family demand, transient renter base, plan for 1-2y turnover; 73% free/reduced lunch — lower-income household profile, screen leases tightly.
- Market conditions: Rents rising fast (+5.9%/yr); 151 active listings in the ZIP; 4 comparable units currently listed for rent nearby; rentals lingering (median 44d on market — plan ~5-8 weeks vacancy on turnover, expect pricing pressure); 50% of comp listings sitting > 30 days — soft ceiling on asking rent; solid renter incomes; 285 units permitted in Winnebago County in 2024 (0 in 5+ unit buildings).
Forward outlook
- Local home prices are declining (-3.0%/yr); year-one equity from $892 of loan paydown is wiped out by about $4k of value loss. Plan a longer hold.
- Winnebago County population projected at -20% by 2050 — secular population decline; favor cash flow + early exit over multi-decade hold.
- At projected returns (-3.0% appreciation + 5.9% rent growth), your $36k cash investment doubles in ~6 years — after that, you're playing with house money.
Negotiation context
- It's been on market 191 days — a 12% lower offer ($114k) is reasonable based on typical stale-listing flexibility.
- 6 sale attempts since 16y ago with the ask held roughly flat each time — persistent listings suggest the price (not the market) is what's stuck; bring a comps-based counter.
- Current owner paid $85k; list at $129k implies a 52% gain — meaningful room to come down on a strong offer.
Risks & watch-outs
- Watch-outs: built in 1905 — expect roof / HVAC / electrical / plumbing capex.
Questions for the listing agent
- It's been on market 191 days. Have you received any prior offers? Is the seller open to a 12% concession, seller financing, or rate buy-down credit?
- Built in 1905 — when were the roof, HVAC, electrical panel, plumbing, and water heater last replaced?
- Why hasn't it sold? Are there any deal-killer items the seller is aware of (foundation, flood, title, zoning, code violations)?
- Is there a deadline driving the sale (1031 exchange, divorce, estate, relocation)? That informs how much negotiation room exists.
- Schools are F-rated, which usually means shorter tenancies and higher turnover. Who's the typical renter profile here, and what's been the actual vacancy rate?
- Crime grade is F in this area — have there been break-ins, vandalism, or insurance claims at this property in the last 3 years? What carrier currently insures it and at what premium?
- What's the average days-on-market for RENTAL listings here right now (not sales)? A rising rental-DOM trend means longer vacancies and softer asking-rent achievability than the comps imply.
- What's the recent tenant-quality profile in this submarket — average credit score on applications, eviction rate, late-payment / NSF rate, and stable-employment percentage? A property-management company in the area should have these aggregated.
- How much new for-sale + rental construction is in the pipeline within 1–3 miles? Heavy new supply typically softens prices + rents 12–24 months out; constrained supply supports both.
Investment metrics
- 1% rule
- 1.32% ✓
- Cap rate
- 11.07%
- Cash-on-cash
- 17.07%
- DSCR
- 1.76
- GRM
- 6.3
CMA / ARV
- ARV (median comp)
- $89,542
- List price
- $129,000
- Delta
- 44.07%
- Verdict
- OVERPRICED
- Comps
- 20 within 1.0 mi
Show comp detail 12 sales within ~0.75 mi
| Address | Dist | Beds/Ba | Sqft | Sold | Price | $/sf | Match |
|---|---|---|---|---|---|---|---|
| 1404 Benton St | 0.43mi | 4/1.5 | 1,829 (+0%) | 0mo | $107,000 | $59 | 79 |
| 703 3rd St | 0.08mi | 4/2.0 | 2,030 (+11%) | 4mo | $101,000 | $50 | 73 |
| 1411 Crosby St | 0.47mi | 4/2.0 | 1,775 (-3%) | 2mo | $120,000 | $68 | 70 |
| 1604 Crosby St | 0.63mi | 3/1.5 (-1) | 1,824 (+0%) | 8mo | $183,000 | $100 | 59 |
| 1326 Brownwood Dr | 0.66mi | 3/1.5 (-1) | 1,813 (-0%) | 6mo | $230,000 | $127 | 58 |
| 208 Summit St | 0.44mi | 3/2.0 (-1) | 1,650 (-10%) | 6mo | $105,000 | $64 | 52 |
| 1315 4th Ave | 0.68mi | 4/1.0 | 1,953 (+7%) | 3mo | $82,500 | $42 | 51 |
| 1529 Benton St | 0.59mi | 4/2.0 | 1,579 (-13%) | 1mo | $193,000 | $122 | 47 |
| 1611 Jackson St | 0.61mi | 3/2.5 (-1) | 2,029 (+11%) | 1mo | $195,000 | $96 | 43 |
| 1016 B St | 0.68mi | 3/1.5 (-1) | 1,590 (-13%) | 4mo | $217,000 | $136 | 38 |
| 206 12th St | 0.74mi | 3/2.0 (-1) | 1,580 (-13%) | 6mo | $155,000 | $98 | 32 |
| 422 N Gardiner Ave | 0.75mi | 3/2.5 (-1) | 2,082 (+14%) | 4mo | $274,000 | $132 | 29 |
Match score weights: distance 35% · size 25% · config 20% · recency 20%. Top-matched comps best support the ARV.
Projected returns pro-forma
-3.0% appreciation · 5.92% rent growth · sell at horizon
- IRR
- 11.5%
- Equity multiple
- 1.47×
- Total profit
- $16,965
- Equity at exit
- $19,234
- IRR
- 22.6%
- Equity multiple
- 3.20×
- Total profit
- $79,339
- Equity at exit
- $11,154
Cash invested: $36,120 (down + closing). Projections, not guarantees.
Landlord ↔ Tenant lean methodology
- Overall (STATE)
- 43 Moderately Tenant-Leaning
- State Illinois
- 43 Moderately Tenant-Leaning · D+7
- County
- — inherits STATE
- City
- — inherits STATE
ZIP-level market 61107
- Home prices YoY
- -20.1%
- Rents YoY
- 5.9%
- Active inventory
- 151
- Price-to-rent
- 6.3×
Monthly cashflow live
- Estimated rent
- $1,706 medium interval (Pro) →
- Mortgage (P&I)
- −$676
- Tax from tax record
- −$104 /mo · $1,243/yr
- Insurance
- −$54
- HOA
- −$0
- Vacancy / Maint / Mgmt
- −$358
- Net cashflow
- $514
Break-even live
UW: 25.0% down · 7.5% · 30yr · 1.5% tax · 5.0% vac · 8.0% maint · 8.0% mgmt
Financing live
Cash to close
- Down payment
- $32,250
- Closing costs
- $3,870
- Reserves months
- —
- Total cash needed
- —
Loan-product check · same deal, 3 products live
Conventional
25% down · 7.5% · 30yr
- Down + closing
- —
- Monthly P&I
- —
- Monthly cashflow
- —
- DSCR
- —
- Eligible?
- —
Personal DTI + credit; lowest rate.
DSCR
20% down · 8.5% · 30yr
- Down + closing
- —
- Monthly P&I
- —
- Monthly cashflow
- —
- DSCR
- —
- Eligible?
- —
No personal income docs; deal must DSCR.
Hard money
10% down · 12.0% · 12mo
- Down + closing
- —
- Monthly P&I
- —
- Monthly cashflow
- —
- DSCR
- —
- Eligible?
- —
Short-term bridge; refi at stabilization.
Rent comps 4 comps
| Address | Beds | Baths | Sqft | Rent | $/sqft | DOM | Units | Dist |
|---|---|---|---|---|---|---|---|---|
| 728 N Winnebago St Rockford, IL | 4.0 | 1.0 | 1250 | $1,600 | $1.28 | 13d | 1 | 0.88mi |
| 333 S Gardiner Ave Unit AVE2 Rockford, IL | 4.0 | 1.0 | 1306 | $1,600 | $1.23 | 43d | 1 | 0.92mi |
| 1231 11th Ave Rockford, IL | 4.0 | 1.0 | 1284 | $1,450 | $1.13 | 43d | 1 | 1.18mi |
| 1004 15th St Rockford, IL | 4.0 | 1.5 | 1267 | $1,450 | $1.14 | 21d | 1 | 1.31mi |
Listing history 18 events
-
2026-05-13status Pending 338-char remark
Show marketing remark (338 chars)
Spacious 4+ bedroom home with new roof conveniently located near the bus line and downtown. Includes a partially finished basement for extra space. The garage is equipped with a gas line and power lines. Public parking lot right next door provides plenty of parking space. Low taxes makes this a great investment property or starter home.
-
2026-03-05price $129,000 338-char remark
Show marketing remark (338 chars)
Spacious 4+ bedroom home with new roof conveniently located near the bus line and downtown. Includes a partially finished basement for extra space. The garage is equipped with a gas line and power lines. Public parking lot right next door provides plenty of parking space. Low taxes makes this a great investment property or starter home.
-
2025-11-03$135,000 Active 338-char remark
Show marketing remark (338 chars)
Spacious 4+ bedroom home with new roof conveniently located near the bus line and downtown. Includes a partially finished basement for extra space. The garage is equipped with a gas line and power lines. Public parking lot right next door provides plenty of parking space. Low taxes makes this a great investment property or starter home.
-
2024-04-01soldstatus $85,000
-
2024-03-29soldstatus $85,000 Closed 118-char remark
Show marketing remark (118 chars)
4 Bedroom home with full useable basement. Also enclosed porch. Dinning room and family room. Large garage unattached.
-
2024-03-25status Pending 118-char remark
Show marketing remark (118 chars)
4 Bedroom home with full useable basement. Also enclosed porch. Dinning room and family room. Large garage unattached.
-
2024-03-23status Active 118-char remark
Show marketing remark (118 chars)
4 Bedroom home with full useable basement. Also enclosed porch. Dinning room and family room. Large garage unattached.
-
2024-03-15status Pending 118-char remark
Show marketing remark (118 chars)
4 Bedroom home with full useable basement. Also enclosed porch. Dinning room and family room. Large garage unattached.
-
2024-03-13status Active 118-char remark
Show marketing remark (118 chars)
4 Bedroom home with full useable basement. Also enclosed porch. Dinning room and family room. Large garage unattached.
-
2024-02-20historical $1,350
-
2024-02-19status Pending 118-char remark
Show marketing remark (118 chars)
4 Bedroom home with full useable basement. Also enclosed porch. Dinning room and family room. Large garage unattached.
-
2024-02-15$1,350
-
2024-02-05$89,900 Active 118-char remark
Show marketing remark (118 chars)
4 Bedroom home with full useable basement. Also enclosed porch. Dinning room and family room. Large garage unattached.
-
2010-02-17soldstatus $27,500
-
2010-02-16soldstatus $27,500 Closed Sale
-
2010-02-04status Pending
-
2010-01-04$39,900 New
-
1994-05-27soldstatus $28,000
ⓘ Source: listings_history table (triggers on properties + properties_extension) + one-shot
backfill from property_details.listing_events for pre-trigger history.
Tax reassessment forecast IL · Partial reset (capped growth)
- Current annual tax
- $1,243 · $104/mo
- Projected year-2 tax
- $2,086 · $174/mo
- Expected delta
- +$843/yr (+$70/mo · 67.8%)
ⓘ Screening estimate from a state-policy table — verify with the county assessor before closing.
Climate risk First Street
- Flood 1/10 Low FEMA zone X (unshaded) · 0% chance over 30 yrs
- Wildfire 1/10 Low
- Heat 3/10 Moderate 7 d/yr ≥101°F today · 15 d/yr by 30 yrs out
- Wind 2/10 Low
- Air quality 2/10 Low 1 unhealthy d/yr today · 2 by 30 yrs out
Nearby sold comps map
Loading sold comps map…
Walkable amenities ~0.75 mi
Loading nearby amenities…
Taxation est. · year 1
- Rental income
- $20,469
- − Mortgage interest
- −$7,226
- − Property taxes
- −$1,243
- − Insurance
- −$645
- − Repairs & maintenance
- −$1,638
- − Management
- −$1,638
- − Depreciation
- −$3,753
- Taxable income
- $4,327
- Est. tax owed @ 24.0%
- −$1,039
- After-tax cash flow
- $5,126/yr
For passive investors: Depreciation is non-cash, so a rental often shows a tax loss while cash-flowing — sheltering income. Rental losses are passive: they offset passive income freely, and up to $25,000/yr can offset ordinary (W-2) income if you actively participate and your MAGI is under $100k (phasing out to $0 by $150k); unused losses carry forward. On sale, claimed depreciation is recaptured at up to 25%, and gains may owe capital-gains tax (a 1031 exchange can defer both). Figures are a year-1 estimate at your 24.0% rate — not tax advice; consult a CPA.
Schools (NCES district)
- District
- Rockford SD 205
- NCES district ID
- 1734510
- Math proficiency
- 12% ▼ -2.00%
- Reading proficiency
- 16% ▼ -3.00%
- Median HH income
- $42,533
- Composite
- 12.21/100
- National rank
- #9649
- State rank
- #533 of 620 in IL
Livability — Rockford
- Score
- 62/100
- State rank
- #876
- US rank
- #17035
Category grades
Schools grade is shown separately in the Schools card above.
Census & demographics
- Census place
- Rockford, IL
- County
- Winnebago County · 147,297 people
- City population
- 147,297
- Metro
- Rockford, IL
- Population (ZIP)
- 30,765
- Household income
- $78,574
- Rent vs Own
- Severe rent burden
- 981.0
Population outlook (Winnebago County) Hauer SSP2
- Today (2025)
- 271,080 people
- By 2030
- 260,684 · -3.8%
- By 2040
- 238,405 · -12.1%
- By 2050
- 216,129 · -20.3%
- By 2075
- 172,882 · -36.2%
- By 2100
- 135,336 · -50.1%
Race, ethnicity, and origin ACS 2023
- Neighborhood character
- Predominantly White (68%)
- Race & ethnicity
- White 68% Hispanic / Latino 15% Black 9% Two or more races 9% Asian 4% Native American 1%
- Hispanic origin (detail)
- Mexican 11% Puerto Rican 1%
- Common ancestry
- Romanian 6% Portuguese 4% Lithuanian 2%
- Foreign-born
- 10% · Canada, China
- Languages at home
- 83% English-only · Spanish 11% Arabic 1% Other Indo-European 1%
Political lean MEDSL · Winnebago
- 2024 margin
- Toss-up / Even · D 49.5% · R 49.0% · Other 1.5%
- 2008→2024 swing
- -12.2pp toward R · 2008: 12.8pp · 2024: 0.6pp
- All cycles
- 2024: D+0.6 2020: D+2.5 2016: R+1.2 2012: D+5.7 2008: D+12.8
Not yet ingested
- Civics
- —
Market trends
- HPI YoY
- ▼ -62.46%
- Current HPI
- 248.8598
- Rent YoY
- ▲ 5.92%
- Metro
- Rockford, IL
- State GDP YoY
- ▲ 1.59%
- F500 in state
- 60
Industry mix (Fortune 500 HQ in IL)
| Industry | F500 HQs | Revenue |
|---|---|---|
| Insurance | 4 | $201B |
|
||
| Consumer Goods | 4 | $87B |
|
||
| Industrial Machinery | 3 | $64B |
|
||
| Healthcare | 2 | $55B |
|
||
| Retail / Pharmacy | 1 | $148B |
|
||
| Agriculture / Food | 1 | $86B |
|
||
Price history
+360.7% since first listed18 events — show timeline
- 2026-05-13 Pending — NWIAR
- 2026-03-05 Price Changed $129,000 NWIAR
- 2025-11-03 Listed $135,000 NWIAR
- 2024-04-01 Sold (Public Records) $85,000 Public Records
- 2024-03-29 Sold (MLS) $85,000 NWIAR
- 2024-03-25 Pending — NWIAR
- 2024-03-23 Relisted — NWIAR
- 2024-03-15 Pending — NWIAR
- 2024-03-13 Relisted — NWIAR
- 2024-02-20 Rental Removed $1,350 NWIAR
- 2024-02-19 Pending — NWIAR
- 2024-02-15 Listed for Rent $1,350 NWIAR
- 2024-02-05 Listed $89,900 NWIAR
- 2010-02-17 Sold (Public Records) $27,500 Public Records
- 2010-02-16 Sold (MLS) $27,500 MRED as Distributed by MLS Grid
- 2010-02-04 Pending — MRED as Distributed by MLS Grid
- 2010-01-04 Listed $39,900 MRED as Distributed by MLS Grid
- 1994-05-27 Sold (Public Records) $28,000 Public Records
Property tax history
-1.7%/yrLatest (2024): $1,243 · +3.5% YoY. Source: county tax records.
Cash-flow waterfall
monthlySold comps — $/sqft
last 12 mo · ≤1 miLoading sold comps…