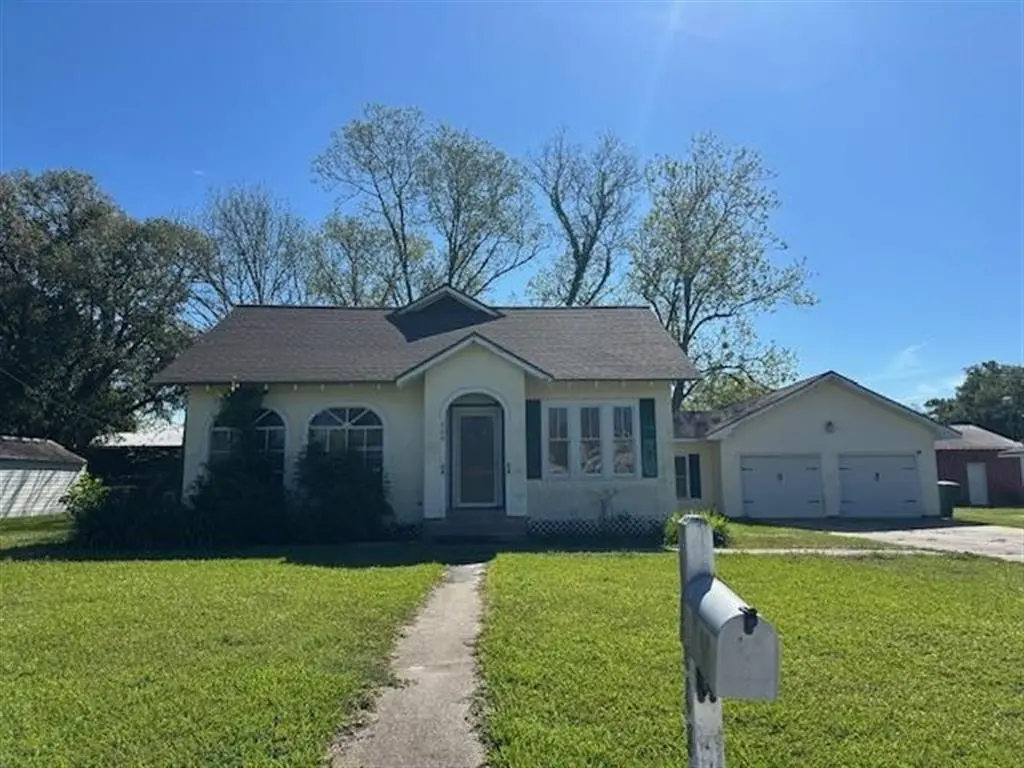
608 S Sarah St S · Welsh, LA
Flood risk 9/10 · Severe
- FEMA flood zone
- AE
- Chance of flooding over 30 yrs
- 0.99%
- Est. flood insurance / yr
- $1,737 – $8,500
Fire risk 1/10 · Minimal
- Est. fire insurance / yr
- $1,269 – $2,357
Heat risk 8/10 · Major
- Hot days now (above 109°F)
- 7 days/yr
- Hot days in 30 yrs
- 21 days/yr
Wind risk 9/10 · Severe
- Chance of severe wind over 30 yrs
- 99.0%
Air-quality risk 1/10 · Minimal
- Unhealthy air days now
- 0 days/yr
- Unhealthy air days in 30 yrs
- 0 days/yr
Risk factors via First Street. Map © Google.
Why this score? — see what drove the C+ grade
The composite is a weighted blend of 9 inputs, each scored 0–100. Each bar is that input's sub-score; the figure is the points it added to the 100-point composite (weight × sub-score).
- Cash flow +19.4/30.0
- ARV discount +15.0/15.0
- DSCR +6.1/10.0
- Appreciation +6.0/10.0
- 1% rule +4.9/10.0
- Livability +3.2/5.0
- Schools +3.0/10.0
- Rent growth +2.5/5.0
- Condition / age +2.5/5.0
$118,300
🖨 Deal sheet 📄 Offer letter ✓ Due diligence
Listing remarks MLS
Welcome to this 3-bedroom, 2-bath home nestled on a . 34-acre lot. Home features a spacious living room, large bedrooms, and kitchen with plenty of cabinet storage. Wood floors throughout and some arch windows. Large yard with 2-car attached garage. Don't miss this opportunity—schedule your showing today!
Key facts
- 0.34 acre lot
- 2 garage spots
- Built 1950
Neighborhood map
What this means for you Summary
Snapshot
- This is a 3-bed/2.0-bath single-family listed at $118k.
Deal economics
- At list price, monthly cash flow is $-295 ($-4k/yr) — negative.
- To cash-flow at today's rent, offer at most $66k (44.1% below list).
- To meet the 1% rule (rent ≥ 1% of price), the offer needs to be $117k (0.8% below list).
- Recommended offer: $66k (44.1% below list) — sets the bar for cash-flow.
Location & tenants
- Location reads 63/100 on livability (#189 in LA) — a middle-class / working-renter tenant base. Strengths: cost of living A+, housing A+, schools B+; Watch: amenities F, commute F, employment D-.
- Jefferson Davis Parish (town): math 30% / reading 42% proficiency, ranked #33 of 98 in LA (top 34%) — families likely to look elsewhere, expect single-tenant / working-renter base with shorter leases.
- Market conditions: 45 active listings in the ZIP; 69 units permitted in Jefferson Davis Parish in 2024 (0 in 5+ unit buildings).
Forward outlook
- In year one you build about $3k of equity ($818 loan paydown + $2k appreciation (1.9% local appreciation)).
- Jefferson Davis County population projected to shrink 8% by 2050 — rents likely to lag national; underwrite the cash flow, not the appreciation.
- By year 10, paydown + projected appreciation supports a ~$30k cash-out refi (75% LTV) — recoverable capital for the next deal without selling this one.
Negotiation context
- It's been on market 58 days — a 3% lower offer ($115k) is reasonable based on typical stale-listing flexibility.
Risks & watch-outs
- Watch-outs: flood insurance adds $427/mo; built in 1950 — expect roof / HVAC / electrical / plumbing capex.
- Climate carrying-cost: in FEMA flood zone AE (mandatory federal flood insurance); severe wind risk, 99% chance of damaging wind over 30y; extreme-heat days projected 7→21/yr by 2055 (HVAC capex compounding) — expect insurance premiums to compound above CPI over the hold.
Questions for the listing agent
- What do current leases actually rent for vs. the listed asking? Can we see a recent rent roll and the last 12 months of T-12 income?
- It's been on market 58 days. Have you received any prior offers? Is the seller open to a 44% concession, seller financing, or rate buy-down credit?
- Built in 1950 — when were the roof, HVAC, electrical panel, plumbing, and water heater last replaced?
- What's the actual annual flood-insurance premium (NFIP or private), and is the property in a SFHA with mandatory coverage?
- Is there a deadline driving the sale (1031 exchange, divorce, estate, relocation)? That informs how much negotiation room exists.
- Schools are B-rated — typically a magnet for longer-tenancy family renters. What's the average tenant stay here, and is there a school-zone premium baked into asking?
- What's the average days-on-market for RENTAL listings here right now (not sales)? A rising rental-DOM trend means longer vacancies and softer asking-rent achievability than the comps imply.
- What's the recent tenant-quality profile in this submarket — average credit score on applications, eviction rate, late-payment / NSF rate, and stable-employment percentage? A property-management company in the area should have these aggregated.
- How much new for-sale + rental construction is in the pipeline within 1–3 miles? Heavy new supply typically softens prices + rents 12–24 months out; constrained supply supports both.
Investment metrics
- 1% rule
- 0.99% ✗
- Cap rate
- 7.63%
- Cash-on-cash
- 4.77%
- DSCR
- 1.21
- GRM
- 8.4
CMA / ARV
- ARV (median comp)
- $188,528
- List price
- $118,300
- Delta
- -37.25%
- Verdict
- UNDERPRICED
- Comps
- 20 within 1.0 mi
Show comp detail 10 sales within ~0.75 mi
| Address | Dist | Beds/Ba | Sqft | Sold | Price | $/sf | Match |
|---|---|---|---|---|---|---|---|
| 515 S Polk St S | 0.08mi | 3/2.0 | 1,768 (-1%) | 10mo | $209,000 | $118 | 86 |
| 406 West Hudspeth St | 0.32mi | 3/2.0 | 1,752 (-2%) | 1mo | $199,900 | $114 | 80 |
| 512 S Polk St S | 0.11mi | 2/1.0 (-1) | 1,805 (+1%) | 15mo | $110,000 | $61 | 72 |
| 602 W Hudspeth St W | 0.34mi | 3/2.0 | 1,700 (-5%) | 6mo | $89,000 | $52 | 71 |
| 102 S Littell St S | 0.46mi | 3/2.0 | 1,754 (-2%) | 9mo | $247,500 | $141 | 67 |
| 310 Louviere | 0.30mi | 3/2.0 | 2,009 (+12%) | 4mo | $299,000 | $149 | 63 |
| 105 Radeke St | 0.63mi | 3/2.0 | 1,872 (+4%) | 1mo | $172,000 | $92 | 63 |
| 401 Pine St | 0.09mi | 3/2.0 | 2,000 (+12%) | 22mo | $225,000 | $113 | 58 |
| 319 Goodwin St | 0.65mi | 4/2.5 (+1) | 1,800 (+0%) | 10mo | $315,000 | $175 | 54 |
| 101 Bourgeois St | 0.50mi | 4/3.0 (+1) | 1,955 (+9%) | 1mo | $140,000 | $72 | 52 |
Match score weights: distance 35% · size 25% · config 20% · recency 20%. Top-matched comps best support the ARV.
Projected returns pro-forma
1.94% appreciation · 3.0% rent growth · sell at horizon
- IRR
- -6.0%
- Equity multiple
- 0.67×
- Total profit
- $-10,788
- Equity at exit
- $46,260
- IRR
- -0.7%
- Equity multiple
- 0.90×
- Total profit
- $-3,216
- Equity at exit
- $66,309
Cash invested: $33,124 (down + closing). Projections, not guarantees.
Landlord ↔ Tenant lean methodology
- Overall (STATE)
- 90 Strongly Landlord-Friendly
- State Louisiana
- 90 Strongly Landlord-Friendly · R+12
- County
- — inherits STATE
- City
- — inherits STATE
ZIP-level market 70591
- Home prices YoY
- 1.1%
- Active inventory
- 45
- Price-to-rent
- 8.4×
Monthly cashflow live
- Estimated rent
- $1,174 medium interval (Pro) →
- Mortgage (P&I)
- −$620
- Tax from tax record
- −$126 /mo · $1,514/yr
- Insurance
- −$49
- Flood insurance flood zone
- −$427 /mo · $5,118/yr
- HOA
- −$0
- Vacancy / Maint / Mgmt
- −$247
- Net cashflow
- $-295
Break-even live
UW: 25.0% down · 7.5% · 30yr · 1.5% tax · 5.0% vac · 8.0% maint · 8.0% mgmt
Financing live
Cash to close
- Down payment
- $29,575
- Closing costs
- $3,549
- Reserves months
- —
- Total cash needed
- —
Loan-product check · same deal, 3 products live
Conventional
25% down · 7.5% · 30yr
- Down + closing
- —
- Monthly P&I
- —
- Monthly cashflow
- —
- DSCR
- —
- Eligible?
- —
Personal DTI + credit; lowest rate.
DSCR
20% down · 8.5% · 30yr
- Down + closing
- —
- Monthly P&I
- —
- Monthly cashflow
- —
- DSCR
- —
- Eligible?
- —
No personal income docs; deal must DSCR.
Hard money
10% down · 12.0% · 12mo
- Down + closing
- —
- Monthly P&I
- —
- Monthly cashflow
- —
- DSCR
- —
- Eligible?
- —
Short-term bridge; refi at stabilization.
Listing history 16 events
-
2026-06-19days on market $118,300 Active 58 DOM
-
2026-06-18days on market $118,300 Active 57 DOM
-
2026-06-17days on market $118,300 Active 56 DOM
-
2026-06-16days on market $118,300 Active 55 DOM
-
2026-06-15days on market $118,300 Active 54 DOM
-
2026-06-14days on market $118,300 Active 52 DOM
-
2026-06-13days on market $118,300 Active 51 DOM
-
2026-06-10days on market $118,300 Active 49 DOM
-
2026-06-09days on market $118,300 Active 48 DOM
-
2026-06-08days on market $118,300 Active 47 DOM
-
2026-06-07days on market $118,300 Active 46 DOM
-
2026-06-02days on market $118,300 Active 41 DOM
-
2026-06-01days on market $118,300 Active 40 DOM
-
2026-05-31days on market $118,300 Active 39 DOM
-
2026-05-30days on market $118,300 Active 38 DOM
-
2026-04-22$118,300 Active 312-char remark
Show marketing remark (312 chars)
Welcome to this 3-bedroom, 2-bath home nestled on a . 34-acre lot. Home features a spacious living room, large bedrooms, and kitchen with plenty of cabinet storage. Wood floors throughout and some arch windows. Large yard with 2-car attached garage. Don't miss this opportunity—schedule your showing today!
ⓘ Source: listings_history table (triggers on properties + properties_extension) + one-shot
backfill from property_details.listing_events for pre-trigger history.
Tax reassessment forecast LA · Resets to sale price
- Current annual tax
- $1,514 · $126/mo
- Projected year-2 tax
- $1,514 · $126/mo
- Expected delta
- $0/yr ($0/mo · 0.0%)
ⓘ Screening estimate from a state-policy table — verify with the county assessor before closing.
Climate risk First Street
- Flood 9/10 Extreme FEMA zone AE · 99% chance over 30 yrs
- Wildfire 1/10 Low
- Heat 8/10 Severe 7 d/yr ≥109°F today · 21 d/yr by 30 yrs out
- Wind 9/10 Extreme 99% chance of damaging wind over 30 yrs
- Air quality 1/10 Low 0 unhealthy d/yr today · 0 by 30 yrs out
Nearby sold comps map
Loading sold comps map…
Walkable amenities ~0.75 mi
Loading nearby amenities…
Taxation est. · year 1
- Rental income
- $14,086
- − Mortgage interest
- −$6,627
- − Property taxes
- −$1,514
- − Insurance
- −$5,710
- − Repairs & maintenance
- −$1,127
- − Management
- −$1,127
- − Depreciation
- −$3,441
- Taxable loss
- −$5,459
- Est. tax savings @ 24.0%
- +$1,310
- After-tax cash flow
- $-2,230/yr
For passive investors: Depreciation is non-cash, so a rental often shows a tax loss while cash-flowing — sheltering income. Rental losses are passive: they offset passive income freely, and up to $25,000/yr can offset ordinary (W-2) income if you actively participate and your MAGI is under $100k (phasing out to $0 by $150k); unused losses carry forward. On sale, claimed depreciation is recaptured at up to 25%, and gains may owe capital-gains tax (a 1031 exchange can defer both). Figures are a year-1 estimate at your 24.0% rate — not tax advice; consult a CPA.
Schools (NCES district)
- District
- Jefferson Davis Parish
- NCES district ID
- 2200810
- Math proficiency
- 30% ▼ -39.00%
- Reading proficiency
- 42% ▼ -33.00%
- Median HH income
- $40,322
- Composite
- 30.21/100
- National rank
- #6302
- State rank
- #33 of 98 in LA
Livability — Welsh
- Score
- 63/100
- State rank
- #189
- US rank
- #15036
Category grades
Schools grade is shown separately in the Schools card above.
Census & demographics
- Census place
- Welsh, LA
- Population (ZIP)
- 5,635
Population outlook (Jefferson Davis County) Hauer SSP2
- Today (2025)
- 31,015 people
- By 2030
- 30,563 · -1.5%
- By 2040
- 29,639 · -4.4%
- By 2050
- 28,456 · -8.3%
- By 2075
- 25,521 · -17.7%
- By 2100
- 21,787 · -29.8%
Race, ethnicity, and origin ACS 2023
- Neighborhood character
- Predominantly White (75%)
- Race & ethnicity
- White 75% Black 15% Two or more races 10%
- Common ancestry
- Lithuanian 22% Italian 1%
- Languages at home
- 93% English-only · French/Haitian/Cajun 6%
Political lean MEDSL · Jefferson Davis
- 2024 margin
- Solid R (+61.1) · D 18.8% · R 79.9% · Other 1.3%
- 2008→2024 swing
- -21.5pp toward R · 2008: -39.7pp · 2024: -61.1pp
- All cycles
- 2024: R+61.1 2020: R+55.4 2016: R+53.9 2012: R+47.6 2008: R+39.7
Not yet ingested
- Civics
- —
Market trends
- HPI YoY
- ▲ 1.94%
- Current HPI
- 174.2929
- Rent YoY
- —
- Metro
- —
- State GDP YoY
- ▲ 3.29%
- F500 in state
- 10
Industry mix (Fortune 500 HQ in LA)
| Industry | F500 HQs | Revenue |
|---|---|---|
| Telecommunications | 2 | $23B |
|
||
| Utilities | 1 | $12B |
|
||
| Wholesale / Distribution | 1 | $5B |
|
||
| Advertising | 1 | $2B |
|
||
Price history
1 event — show timeline
- 2026-04-22 Listed $118,300 SWLAR
Property tax history
+2.5%/yrLatest (2025): $1,514 · +0.4% YoY. Source: county tax records.
Cash-flow waterfall
monthlySold comps — $/sqft
last 12 mo · ≤1 miLoading sold comps…