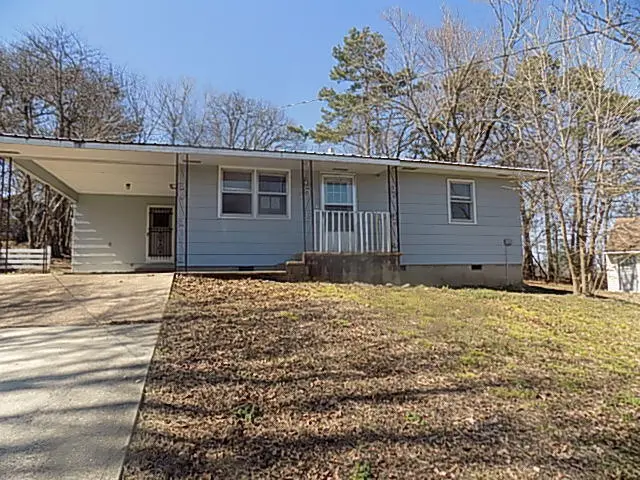
207 Teal St · Ava, MO
Flood risk 1/10 · Minimal
- FEMA flood zone
- X
- Chance of flooding over 30 yrs
- 0.0%
- Est. flood insurance / yr
- $507 – $1,088
Fire risk 4/10 · Minor
- Est. fire insurance / yr
- $1,054 – $1,958
Heat risk 4/10 · Minor
- Hot days now (above 106°F)
- 7 days/yr
- Hot days in 30 yrs
- 18 days/yr
Wind risk 2/10 · Minimal
- Chance of severe wind over 30 yrs
- 0.0%
Air-quality risk 2/10 · Minimal
- Unhealthy air days now
- 1 days/yr
- Unhealthy air days in 30 yrs
- 1 days/yr
Risk factors via First Street. Map © Google.
Why this score? — see what drove the C+ grade
The composite is a weighted blend of 9 inputs, each scored 0–100. Each bar is that input's sub-score; the figure is the points it added to the 100-point composite (weight × sub-score).
- Cash flow +22.0/30.0
- Appreciation +9.5/10.0
- ARV discount +7.5/15.0
- DSCR +7.0/10.0
- 1% rule +4.5/10.0
- Livability +4.1/5.0
- Schools +3.2/10.0
- Rent growth +2.5/5.0
- Condition / age +2.5/5.0
$105,000
🖨 Deal sheet (PDF) 📄 Offer letter ✓ Due diligence
Listing remarks MLS
THIS PROPERTY HAS AN ACCEPTED OFFER IN PLACE AND WILL SHOW PENDING ON THE MLS ONCE SIGNED DOCS HAVE BEEN RECEIVED FROM THE SELLER. Looking for an affordably priced home? Check out this 2 bed 1 bath home with recent updates! This home is FHA 203b Rehab eligible with repair escrow and qualifies for the FHA $100 down sales incentive. Sold AS IS. Neither the seller nor the listing broker makes any representations or warranties as to the accuracy of this listing data sheet Buyer and Buyers Agent to do their own due diligence. Visit Hud Home Store for more available HUD properties. HUD homes are SOLD AS IS. Case #292-810705
Key facts
- 8,712 sq ft lot
- Garage
- Built 1970
Neighborhood map
What this means for you Summary
Snapshot
- This is a 2-bed/1.0-bath other listed at $105k.
Deal economics
- At list price, monthly cash flow is $167 ($2k/yr) — positive.
- The deal already cash-flows at list — no discount required.
- To meet the 1% rule (rent ≥ 1% of price), the offer needs to be $100k (4.8% below list).
- Recommended offer: $100k (4.8% below list) — sets the bar for 1% rule.
- Cap rate 8.2% vs local median 3.6% in Ava — top-decile yield for the area; either an underpriced asset or a hidden risk that comps aren't pricing in. Stress-test before assuming the spread holds.
Location & tenants
- Location reads 82/100 on livability (#12 in MO, #1,299 nationally) — a professional / high-income tenant draw. Strengths: crime A+, cost of living A+, housing A+; Watch: schools C-, commute F, employment F.
- Ava R-I (town): math 36% / reading 43% proficiency, ranked #177 of 324 in MO (top 55%) — families likely to look elsewhere, expect single-tenant / working-renter base with shorter leases.
- Market conditions: 140 active listings in the ZIP; 1 comparable units currently listed for rent nearby; 21 units permitted in Douglas County in 2024 (10 in 5+ unit buildings).
Forward outlook
- In year one you build about $10k of equity ($726 loan paydown + $10k appreciation (9.1% local appreciation)).
- Douglas County population projected at -29% by 2050 — secular population decline; favor cash flow + early exit over multi-decade hold.
- At projected returns (9.1% appreciation + 3.0% rent growth), your $29k cash investment doubles in ~3 years — after that, you're playing with house money.
- By year 4, paydown + projected appreciation supports a ~$36k cash-out refi (75% LTV) — recoverable capital for the next deal without selling this one.
Negotiation context
- It's been on market 46 days — a 3% lower offer ($102k) is reasonable based on typical stale-listing flexibility.
- 2 sale attempts since 3y ago with the ask held roughly flat each time — persistent listings suggest the price (not the market) is what's stuck; bring a comps-based counter.
Questions for the listing agent
- It's been on market 46 days. Have you received any prior offers? Is the seller open to a 5% concession, seller financing, or rate buy-down credit?
- Built in 1970 — when were the roof, HVAC, electrical panel, plumbing, and water heater last replaced?
- Is there a deadline driving the sale (1031 exchange, divorce, estate, relocation)? That informs how much negotiation room exists.
- What's the average days-on-market for RENTAL listings here right now (not sales)? A rising rental-DOM trend means longer vacancies and softer asking-rent achievability than the comps imply.
- What's the recent tenant-quality profile in this submarket — average credit score on applications, eviction rate, late-payment / NSF rate, and stable-employment percentage? A property-management company in the area should have these aggregated.
- How much new for-sale + rental construction is in the pipeline within 1–3 miles? Heavy new supply typically softens prices + rents 12–24 months out; constrained supply supports both.
Investment metrics
- 1% rule
- 0.95% ✗
- Cap rate
- 8.20%
- Cash-on-cash
- 6.81%
- DSCR
- 1.30
- GRM
- 8.8
CMA / ARV
No comps found within radius.
Projected returns pro-forma
9.05% appreciation · 3.0% rent growth · sell at horizon
- IRR
- 27.3%
- Equity multiple
- 3.07×
- Total profit
- $61,001
- Equity at exit
- $87,405
- IRR
- 24.1%
- Equity multiple
- 6.78×
- Total profit
- $169,788
- Equity at exit
- $181,333
Cash invested: $29,400 (down + closing). Projections, not guarantees.
Landlord ↔ Tenant lean methodology
- Overall (STATE)
- 81 Strongly Landlord-Friendly
- State Missouri
- 81 Strongly Landlord-Friendly · R+10
- County
- — inherits STATE
- City
- — inherits STATE
ZIP-level market 65608
- Home prices YoY
- 3.8%
- Active inventory
- 140
- Price-to-rent
- 8.8×
Monthly cashflow live
- Estimated rent
- $1,000 medium interval (Pro) →
- Mortgage (P&I)
- −$551
- Tax from tax record
- −$29 /mo · $347/yr
- Insurance
- −$44
- HOA
- −$0
- Vacancy / Maint / Mgmt
- −$210
- Net cashflow
- $167
Break-even live
Sensitivity live
| Price | -10% $226 | -5% $196 | +0% $167 | +5% $137 | +10% $107 |
|---|---|---|---|---|---|
| Rent | -10% $88 | -5% $127 | +0% $167 | +5% $206 | +10% $246 |
| Rate | -1.0pp $220 | -0.5pp $193 | base $167 | +0.5pp $140 | +1.0pp $112 |
UW: 25.0% down · 7.5% · 30yr · 1.5% tax · 5.0% vac · 8.0% maint · 8.0% mgmt
Financing live
Cash to close
- Down payment
- $26,250
- Closing costs
- $3,150
- Reserves months
- —
- Total cash needed
- —
Loan-product check · same deal, 3 products live
Conventional
25% down · 7.5% · 30yr
- Down + closing
- —
- Monthly P&I
- —
- Monthly cashflow
- —
- DSCR
- —
- Eligible?
- —
Personal DTI + credit; lowest rate.
DSCR
20% down · 8.5% · 30yr
- Down + closing
- —
- Monthly P&I
- —
- Monthly cashflow
- —
- DSCR
- —
- Eligible?
- —
No personal income docs; deal must DSCR.
Hard money
10% down · 12.0% · 12mo
- Down + closing
- —
- Monthly P&I
- —
- Monthly cashflow
- —
- DSCR
- —
- Eligible?
- —
Short-term bridge; refi at stabilization.
Rent comps 1 comps
| Address | Beds | Baths | Sqft | Rent | $/sqft | DOM | Units | Dist |
|---|---|---|---|---|---|---|---|---|
| 205D Knaack CT Unit 1 Ava, MO | 2.0 | 2.0 | 900 | $1,000 | $1.11 | 44d | 1 | 0.84mi |
Listing history 6 events
-
2026-05-05status Pending 626-char remark
Show marketing remark (626 chars)
THIS PROPERTY HAS AN ACCEPTED OFFER IN PLACE AND WILL SHOW PENDING ON THE MLS ONCE SIGNED DOCS HAVE BEEN RECEIVED FROM THE SELLER. Looking for an affordably priced home? Check out this 2 bed 1 bath home with recent updates! This home is FHA 203b Rehab eligible with repair escrow and qualifies for the FHA $100 down sales incentive. Sold AS IS. Neither the seller nor the listing broker makes any representations or warranties as to the accuracy of this listing data sheet Buyer and Buyers Agent to do their own due diligence. Visit Hud Home Store for more available HUD properties. HUD homes are SOLD AS IS. Case #292-810705
-
2026-03-20$105,000 Active 626-char remark
Show marketing remark (626 chars)
THIS PROPERTY HAS AN ACCEPTED OFFER IN PLACE AND WILL SHOW PENDING ON THE MLS ONCE SIGNED DOCS HAVE BEEN RECEIVED FROM THE SELLER. Looking for an affordably priced home? Check out this 2 bed 1 bath home with recent updates! This home is FHA 203b Rehab eligible with repair escrow and qualifies for the FHA $100 down sales incentive. Sold AS IS. Neither the seller nor the listing broker makes any representations or warranties as to the accuracy of this listing data sheet Buyer and Buyers Agent to do their own due diligence. Visit Hud Home Store for more available HUD properties. HUD homes are SOLD AS IS. Case #292-810705
-
2023-04-25soldstatus
-
2023-04-24soldstatus Closed 156-char remark
Show marketing remark (156 chars)
Nicely remodeling 2 bedroom 1 bath. New flooring, fresh paint and newer metal roof. Also, new furnace and A/C. Come take a look at this move in ready home!!
-
2023-03-09status Pending 156-char remark
Show marketing remark (156 chars)
Nicely remodeling 2 bedroom 1 bath. New flooring, fresh paint and newer metal roof. Also, new furnace and A/C. Come take a look at this move in ready home!!
-
2023-01-03$115,000 Active 156-char remark
Show marketing remark (156 chars)
Nicely remodeling 2 bedroom 1 bath. New flooring, fresh paint and newer metal roof. Also, new furnace and A/C. Come take a look at this move in ready home!!
ⓘ Source: listings_history table (triggers on properties + properties_extension) + one-shot
backfill from property_details.listing_events for pre-trigger history.
Tax reassessment forecast MO · Resets to sale price
- Current annual tax
- $347 · $29/mo
- Projected year-2 tax
- $1,018 · $85/mo
- Expected delta
- +$672/yr (+$56/mo · 193.8%)
ⓘ Screening estimate from a state-policy table — verify with the county assessor before closing.
Climate risk First Street
- Flood 1/10 Low FEMA zone X · 0% chance over 30 yrs
- Wildfire 4/10 Moderate
- Heat 4/10 Moderate 7 d/yr ≥106°F today · 18 d/yr by 30 yrs out
- Wind 2/10 Low 0% chance of damaging wind over 30 yrs
- Air quality 2/10 Low 1 unhealthy d/yr today · 1 by 30 yrs out
Nearby sold comps map
Loading sold comps map…
Walkable amenities ~0.75 mi
Loading nearby amenities…
Taxation est. · year 1
- Rental income
- $12,000
- − Mortgage interest
- −$5,882
- − Property taxes
- −$347
- − Insurance
- −$525
- − Repairs & maintenance
- −$960
- − Management
- −$960
- − Depreciation
- −$3,055
- Taxable income
- $272
- Est. tax owed @ 24.0%
- −$65
- After-tax cash flow
- $1,935/yr
For passive investors: Depreciation is non-cash, so a rental often shows a tax loss while cash-flowing — sheltering income. Rental losses are passive: they offset passive income freely, and up to $25,000/yr can offset ordinary (W-2) income if you actively participate and your MAGI is under $100k (phasing out to $0 by $150k); unused losses carry forward. On sale, claimed depreciation is recaptured at up to 25%, and gains may owe capital-gains tax (a 1031 exchange can defer both). Figures are a year-1 estimate at your 24.0% rate — not tax advice; consult a CPA.
Schools (NCES district)
- District
- Ava R-I
- NCES district ID
- 2904050
- Math proficiency
- 36% ▼ -1.00%
- Reading proficiency
- 43% ▼ -2.00%
- Median HH income
- $31,148
- Composite
- 32.25/100
- National rank
- #5766
- State rank
- #177 of 324 in MO
Livability — Ava
- Score
- 82/100
- State rank
- #12
- US rank
- #1299
Category grades
Schools grade is shown separately in the Schools card above.
Census & demographics
- Census place
- Ava, MO
- Population (ZIP)
- 8,478
Population outlook (Douglas County) Hauer SSP2
- Today (2025)
- 12,395 people
- By 2030
- 11,690 · -5.7%
- By 2040
- 10,185 · -17.8%
- By 2050
- 8,805 · -29.0%
- By 2075
- 6,716 · -45.8%
- By 2100
- 5,493 · -55.7%
Race, ethnicity, and origin ACS 2023
- Neighborhood character
- Predominantly White (93%)
- Race & ethnicity
- White 93% Two or more races 4% Native American 1% Hispanic / Latino 1% Black 1%
- Common ancestry
- Lithuanian 4% Slovak 2% Iranian 2%
- Foreign-born
- 1% · Canada
Political lean MEDSL · Douglas
- 2024 margin
- Solid R (+72.0) · D 13.7% · R 85.6%
- 2008→2024 swing
- -38.2pp toward R · 2008: -33.8pp · 2024: -72.0pp
- All cycles
- 2024: R+72.0 2020: R+69.8 2016: R+67.5 2012: R+44.8 2008: R+33.8
Not yet ingested
- Civics
- —
Market trends
- HPI YoY
- ▲ 9.05%
- Current HPI
- 249.1557
- Rent YoY
- —
- Metro
- —
- State GDP YoY
- ▲ 1.84%
- F500 in state
- 20
Industry mix (Fortune 500 HQ in MO)
| Industry | F500 HQs | Revenue |
|---|---|---|
| Healthcare | 1 | $163B |
|
||
| Insurance | 1 | $21B |
|
||
| Industrial Technology | 1 | $17B |
|
||
| Retail | 1 | $16B |
|
||
| Industrial Distribution | 1 | $10B |
|
||
| Utilities | 1 | $9B |
|
||
Price history
-8.7% since first listed6 events — show timeline
- 2026-05-05 Pending — SOMO
- 2026-03-20 Listed $105,000 SOMO
- 2023-04-25 Sold (Public Records) — Public Records
- 2023-04-24 Sold (MLS) — SOMO
- 2023-03-09 Pending — SOMO
- 2023-01-03 Listed $115,000 SOMO
Property tax history
+2.7%/yrLatest (2025): $347 · +9.9% YoY. Source: county tax records.
Cash-flow waterfall
monthlySold comps — $/sqft
last 12 mo · ≤1 miLoading sold comps…