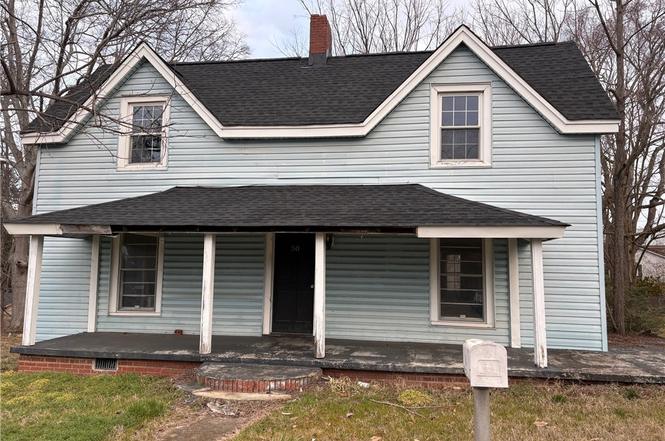
50 Main St · Piedmont, SC
Flood risk 1/10 · Minimal
- FEMA flood zone
- X (unshaded)
- Chance of flooding over 30 yrs
- 0.0%
- Est. flood insurance / yr
- $507 – $1,088
Fire risk 4/10 · Minor
- Est. fire insurance / yr
- $783 – $1,453
Heat risk 6/10 · Moderate
- Hot days now (above 105°F)
- 7 days/yr
- Hot days in 30 yrs
- 18 days/yr
Wind risk 2/10 · Minimal
- Chance of severe wind over 30 yrs
- 1.0%
Air-quality risk 4/10 · Minor
- Unhealthy air days now
- 3 days/yr
- Unhealthy air days in 30 yrs
- 4 days/yr
Risk factors via First Street. Map © Google.
Why this score? — see what drove the C+ grade
The composite is a weighted blend of 9 inputs, each scored 0–100. Each bar is that input's sub-score; the figure is the points it added to the 100-point composite (weight × sub-score).
- Cash flow +25.7/30.0
- DSCR +8.5/10.0
- ARV discount +7.5/15.0
- 1% rule +6.7/10.0
- Schools +4.2/10.0
- Livability +3.2/5.0
- Condition / age +2.5/5.0
- Rent growth +1.8/5.0
- Appreciation +0.0/10.0
$129,900
🖨 Deal sheet (PDF) 📄 Offer letter ✓ Due diligence
Listing remarks MLS
Post foreclosure deal. Needs work, sold as is. Roof is 1 year old
Key facts
- 0.47 acre lot
- Garage
- Listed 90 days
Property features AI
Finance
- Other: Lead-based paint disclosure required; Residential property disclosure required
- HOA & community: No HOA fees; No community amenities listed
Exterior
- Parking: Unpaved driveway; Garage/parking described as 'Other/See Remarks' (see listing remarks)
- Utilities: Public water; Public sewer; Water heater: Other (see remarks); Private garbage pickup
- Home design: Two-story residence; Older home (50+ years); Approximate lot dimensions 100 x 200
- Construction: Vinyl siding exterior; Architectural roof; Crawl space foundation
- Exterior features: Front porch; Level lot with some trees
Interior
- Kitchen: Kitchen approximately 13 x 10
- Bedrooms: Primary bedroom on main level; Primary bedroom approximately 18 x 15; Second bedroom approximately 16 x 14; Third bedroom approximately 15 x 13; Fourth bedroom approximately 14 x 13; Two main-level bedrooms
- Flooring: Hardwood floors
- Bathrooms: One full bathroom (including one full on main level)
- Heating & cooling: Forced-air heating; Central forced cooling
- Interior features: Built-in bookcase; 9+ foot ceilings
- Laundry & utility: Laundry on first floor
Neighborhood map
What this means for you Summary
Snapshot
- This is a 2-bed/1.0-bath single-family listed at $130k.
Deal economics
- At list price, monthly cash flow is $309 ($4k/yr) — positive.
- The deal already cash-flows at list — no discount required.
- Meets the 1% rule at list price ($2k rent vs $130k).
- Recommended offer: $122k (6.0% below list) — sets the bar for market timing.
- Cap rate 9.2% vs local median 3.4% in Piedmont — top-decile yield for the area; either an underpriced asset or a hidden risk that comps aren't pricing in. Stress-test before assuming the spread holds.
Location & tenants
- Location reads 64/100 on livability (#160 in SC) — a middle-class / working-renter tenant base. Strengths: cost of living A+, housing A+; Watch: employment D+, schools D, crime D.
- Greenville 01 (suburban): math 44% / reading 54% proficiency, ranked #10 of 80 in SC (top 12%) — families likely to look elsewhere, expect single-tenant / working-renter base with shorter leases.
- Market conditions: Rents soft (-2.7%/yr); 535 active listings in the ZIP; 2 comparable units currently listed for rent nearby; 5,595 units permitted in Greenville County in 2024 (566 in 5+ unit buildings).
Forward outlook
- Local home prices are declining (-3.0%/yr); year-one equity from $898 of loan paydown is wiped out by about $4k of value loss. Plan a longer hold.
- Greenville County population projected at +34% by 2050 — long-run rental-demand tailwind backs the buy-and-hold thesis.
Negotiation context
- It's been on market 90 days — a 6% lower offer ($122k) is reasonable based on typical stale-listing flexibility.
- 5 sale attempts since 19y ago with the ask held roughly flat each time — persistent listings suggest the price (not the market) is what's stuck; bring a comps-based counter.
- Current owner paid $76k; list at $130k implies a 71% gain — meaningful room to come down on a strong offer.
Risks & watch-outs
- Watch-outs: built in 1955 — expect roof / HVAC / electrical / plumbing capex.
- Climate carrying-cost: extreme-heat days projected 7→18/yr by 2055 (HVAC capex compounding) — expect insurance premiums to compound above CPI over the hold.
Questions for the listing agent
- It's been on market 90 days. Have you received any prior offers? Is the seller open to a 6% concession, seller financing, or rate buy-down credit?
- Built in 1955 — when were the roof, HVAC, electrical panel, plumbing, and water heater last replaced?
- Why hasn't it sold? Are there any deal-killer items the seller is aware of (foundation, flood, title, zoning, code violations)?
- Is there a deadline driving the sale (1031 exchange, divorce, estate, relocation)? That informs how much negotiation room exists.
- Schools are D-rated, which usually means shorter tenancies and higher turnover. Who's the typical renter profile here, and what's been the actual vacancy rate?
- Crime grade is D in this area — have there been break-ins, vandalism, or insurance claims at this property in the last 3 years? What carrier currently insures it and at what premium?
- What's the average days-on-market for RENTAL listings here right now (not sales)? A rising rental-DOM trend means longer vacancies and softer asking-rent achievability than the comps imply.
- What's the recent tenant-quality profile in this submarket — average credit score on applications, eviction rate, late-payment / NSF rate, and stable-employment percentage? A property-management company in the area should have these aggregated.
- How much new for-sale + rental construction is in the pipeline within 1–3 miles? Heavy new supply typically softens prices + rents 12–24 months out; constrained supply supports both.
Investment metrics
- 1% rule
- 1.17% ✓
- Cap rate
- 9.15%
- Cash-on-cash
- 10.20%
- DSCR
- 1.45
- GRM
- 7.1
CMA / ARV
- ARV (on-the-fly)
- $285,087
- Comps found
- 6
Show comp detail 6 sales within ~0.75 mi
| Address | Dist | Beds/Ba | Sqft | Sold | Price | $/sf | Match |
|---|---|---|---|---|---|---|---|
| 17 Hammett St | 0.21mi | 3/2.0 (+1) | 1,829 (+2%) | 14mo | $246,000 | $134 | 66 |
| 420 Yellowstone Trl | 0.50mi | 3/2.5 (+1) | 1,749 (-2%) | 9mo | $296,900 | $170 | 54 |
| 10 Transylvania St | 0.63mi | 3/1.5 (+1) | 1,774 (-1%) | 16mo | $219,100 | $124 | 48 |
| 17 Transylvania St | 0.59mi | 3/1.0 (+1) | 1,855 (+4%) | 18mo | $154,640 | $83 | 47 |
| 15 Haynes St | 0.65mi | 2/2.0 | 1,538 (-14%) | 0mo | $244,000 | $159 | 42 |
| 104 Dill Dr | 0.74mi | 3/3.0 (+1) | 2,042 (+14%) | 21mo | $408,000 | $200 | 12 |
Match score weights: distance 35% · size 25% · config 20% · recency 20%. Top-matched comps best support the ARV.
Projected returns pro-forma
-3.0% appreciation · 0.0% rent growth · sell at horizon
- IRR
- -4.4%
- Equity multiple
- 0.84×
- Total profit
- $-5,776
- Equity at exit
- $19,369
- IRR
- 1.5%
- Equity multiple
- 1.09×
- Total profit
- $3,232
- Equity at exit
- $11,231
Cash invested: $36,372 (down + closing). Projections, not guarantees.
Landlord ↔ Tenant lean methodology
- Overall (STATE)
- 90 Strongly Landlord-Friendly
- State South Carolina
- 90 Strongly Landlord-Friendly · R+6
- County
- — inherits STATE
- City
- — inherits STATE
ZIP-level market 29673
- Home prices YoY
- -28.0%
- Rents YoY
- -2.7%
- Active inventory
- 535
- Price-to-rent
- 7.1×
Monthly cashflow live
- Estimated rent
- $1,517 medium interval (Pro) →
- Mortgage (P&I)
- −$681
- Tax from tax record
- −$153 /mo · $1,841/yr
- Insurance
- −$54
- HOA
- −$0
- Vacancy / Maint / Mgmt
- −$318
- Net cashflow
- $309
Break-even live
Sensitivity live
| Price | -10% $383 | -5% $346 | +0% $309 | +5% $273 | +10% $236 |
|---|---|---|---|---|---|
| Rent | -10% $190 | -5% $249 | +0% $309 | +5% $369 | +10% $429 |
| Rate | -1.0pp $375 | -0.5pp $342 | base $309 | +0.5pp $276 | +1.0pp $241 |
UW: 25.0% down · 7.5% · 30yr · 1.5% tax · 5.0% vac · 8.0% maint · 8.0% mgmt
Financing live
Cash to close
- Down payment
- $32,475
- Closing costs
- $3,897
- Reserves months
- —
- Total cash needed
- —
Loan-product check · same deal, 3 products live
Conventional
25% down · 7.5% · 30yr
- Down + closing
- —
- Monthly P&I
- —
- Monthly cashflow
- —
- DSCR
- —
- Eligible?
- —
Personal DTI + credit; lowest rate.
DSCR
20% down · 8.5% · 30yr
- Down + closing
- —
- Monthly P&I
- —
- Monthly cashflow
- —
- DSCR
- —
- Eligible?
- —
No personal income docs; deal must DSCR.
Hard money
10% down · 12.0% · 12mo
- Down + closing
- —
- Monthly P&I
- —
- Monthly cashflow
- —
- DSCR
- —
- Eligible?
- —
Short-term bridge; refi at stabilization.
Rent comps 2 comps
| Address | Beds | Baths | Sqft | Rent | $/sqft | DOM | Units | Dist |
|---|---|---|---|---|---|---|---|---|
| 101 Bagwell Dr Piedmont, SC | 2.0 | 2.0 | 1400 | $1,350 | $0.96 | 24d | 1 | 0.80mi |
| 214 Cali Way Piedmont, SC | 3.0 | 2.5 | 1587 | $1,650 | $1.04 | 24d | 1 | 1.23mi |
Listing history 15 events
-
2026-05-20status Pending 65-char remark
Show marketing remark (65 chars)
Post foreclosure deal. Needs work, sold as is. Roof is 1 year old
-
2026-05-20status Pending
Show marketing remark (65 chars)
Post foreclosure deal. Needs work, sold as is. Roof is 1 year old
-
2026-04-24price $129,900
Show marketing remark (65 chars)
Post foreclosure deal. Needs work, sold as is. Roof is 1 year old
-
2026-04-24$129,900 Active 65-char remark
Show marketing remark (65 chars)
Post foreclosure deal. Needs work, sold as is. Roof is 1 year old
-
2026-02-19$150,000 Active
-
2010-06-30soldstatus $76,100
-
2010-02-12soldstatus $25,551 84-char remark
Show marketing remark (84 chars)
Investors, take note. Great investment opportunity on this 4BR/1BA with a large lot.
-
2010-02-12soldstatus $25,551
Show marketing remark (84 chars)
Investors, take note. Great investment opportunity on this 4BR/1BA with a large lot.
-
2010-01-27historical
-
2010-01-08$29,900 84-char remark
Show marketing remark (84 chars)
Investors, take note. Great investment opportunity on this 4BR/1BA with a large lot.
-
2010-01-08$29,900
Show marketing remark (84 chars)
Investors, take note. Great investment opportunity on this 4BR/1BA with a large lot.
-
2009-10-08historical
-
2007-10-01$46,000
-
1995-03-23soldstatus $35,000
-
1991-06-14soldstatus $67,000
ⓘ Source: listings_history table (triggers on properties + properties_extension) + one-shot
backfill from property_details.listing_events for pre-trigger history.
Tax reassessment forecast SC · Resets to sale price
- Current annual tax
- $1,841 · $153/mo
- Projected year-2 tax
- $1,841 · $153/mo
- Expected delta
- $0/yr ($0/mo · 0.0%)
ⓘ Screening estimate from a state-policy table — verify with the county assessor before closing.
Climate risk First Street
- Flood 1/10 Low FEMA zone X (unshaded) · 0% chance over 30 yrs
- Wildfire 4/10 Moderate
- Heat 6/10 Major 7 d/yr ≥105°F today · 18 d/yr by 30 yrs out
- Wind 2/10 Low 100% chance of damaging wind over 30 yrs
- Air quality 4/10 Moderate 3 unhealthy d/yr today · 4 by 30 yrs out
Nearby sold comps map
Loading sold comps map…
Walkable amenities ~0.75 mi
Loading nearby amenities…
Taxation est. · year 1
- Rental income
- $18,199
- − Mortgage interest
- −$7,276
- − Property taxes
- −$1,841
- − Insurance
- −$650
- − Repairs & maintenance
- −$1,456
- − Management
- −$1,456
- − Depreciation
- −$3,779
- Taxable income
- $1,741
- Est. tax owed @ 24.0%
- −$418
- After-tax cash flow
- $3,294/yr
For passive investors: Depreciation is non-cash, so a rental often shows a tax loss while cash-flowing — sheltering income. Rental losses are passive: they offset passive income freely, and up to $25,000/yr can offset ordinary (W-2) income if you actively participate and your MAGI is under $100k (phasing out to $0 by $150k); unused losses carry forward. On sale, claimed depreciation is recaptured at up to 25%, and gains may owe capital-gains tax (a 1031 exchange can defer both). Figures are a year-1 estimate at your 24.0% rate — not tax advice; consult a CPA.
Schools (NCES district)
- District
- Greenville 01
- NCES district ID
- 4502310
- Math proficiency
- 44% ▼ -10.00%
- Reading proficiency
- 54% ▼ -2.00%
- Median HH income
- $49,596
- Composite
- 41.88/100
- National rank
- #3370
- State rank
- #10 of 80 in SC
Livability — Piedmont
- Score
- 64/100
- State rank
- #160
- US rank
- #14725
Category grades
Schools grade is shown separately in the Schools card above.
Census & demographics
- Census place
- Piedmont, SC
- County
- Greenville County · 573,815 people
- City population
- 30,461
- Metro
- Greenville-Anderson, SC
- Population (ZIP)
- 30,461
- Household income
- $71,444
- Rent vs Own
- Severe rent burden
- 499.0
Population outlook (Greenville County) Hauer SSP2
- Today (2025)
- 574,580 people
- By 2030
- 615,615 · +7.1%
- By 2040
- 695,373 · +21.0%
- By 2050
- 769,367 · +33.9%
- By 2075
- 933,296 · +62.4%
- By 2100
- 1,029,196 · +79.1%
Race, ethnicity, and origin ACS 2023
- Neighborhood character
- Predominantly White (68%)
- Race & ethnicity
- White 68% Black 18% Two or more races 9% Hispanic / Latino 7% Asian 2%
- Hispanic origin (detail)
- Mexican 3%
- Common ancestry
- Slovak 3% Serbian 1% Lithuanian 1%
- Foreign-born
- 4% · Canada
- Languages at home
- 94% English-only · Spanish 4% German/W. Germanic 1% Other Indo-European 1%
Political lean MEDSL · Greenville
- 2024 margin
- Strong R (+22.2) · D 38.0% · R 60.2% · Other 1.8%
- 2008→2024 swing
- +1.7pp toward D · 2008: -23.9pp · 2024: -22.2pp
- All cycles
- 2024: R+22.2 2020: R+18.2 2016: R+24.7 2012: R+27.8 2008: R+23.9
Not yet ingested
- Civics
- —
Market trends
- HPI YoY
- ▼ -92.86%
- Current HPI
- 238.4347
- Rent YoY
- ▼ -2.71%
- Metro
- Greenville-Anderson, SC
- State GDP YoY
- ▲ 4.51%
- F500 in state
- 2
Industry mix (Fortune 500 HQ in SC)
| Industry | F500 HQs | Revenue |
|---|---|---|
| Packaging | 1 | $7B |
|
||
Price history
+93.9% since first listed15 events — show timeline
- 2026-05-20 Pending — WUMLS
- 2026-05-20 Pending — Greater Greenville MLS
- 2026-04-24 Price Changed $129,900 Greater Greenville MLS
- 2026-04-24 Listed $129,900 WUMLS
- 2026-02-19 Listed $150,000 Greater Greenville MLS
- 2010-06-30 Sold (Public Records) $76,100 Public Records
- 2010-02-12 Sold (MLS) $25,551 Greater Greenville MLS
- 2010-02-12 Sold (MLS) $25,551 SPMLS
- 2010-01-27 Listing Removed — Greater Greenville MLS
- 2010-01-08 Listed $29,900 Greater Greenville MLS
- 2010-01-08 Listed $29,900 SPMLS
- 2009-10-08 Listing Removed — Greater Greenville MLS
- 2007-10-01 Listed $46,000 Greater Greenville MLS
- 1995-03-23 Sold (Public Records) $35,000 Public Records
- 1991-06-14 Sold (Public Records) $67,000 Public Records
Property tax history
+9.7%/yrLatest (2025): $1,841 · +173.7% YoY. Source: county tax records.
Cash-flow waterfall
monthlySold comps — $/sqft
last 12 mo · ≤1 miLoading sold comps…