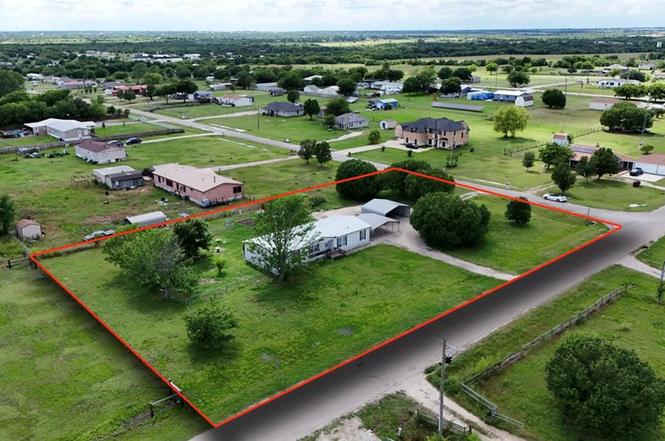
11224 Foothill Dr · Venus, TX
Flood risk 1/10 · Minimal
- FEMA flood zone
- X (unshaded)
- Chance of flooding over 30 yrs
- 0.0%
- Est. flood insurance / yr
- $507 – $1,088
Fire risk 5/10 · Moderate
- Est. fire insurance / yr
- $1,222 – $2,270
Heat risk 7/10 · Major
- Hot days now (above 110°F)
- 7 days/yr
- Hot days in 30 yrs
- 24 days/yr
Wind risk 6/10 · Moderate
- Chance of severe wind over 30 yrs
- 27.0%
Air-quality risk 2/10 · Minimal
- Unhealthy air days now
- 2 days/yr
- Unhealthy air days in 30 yrs
- 2 days/yr
Risk factors via First Street. Map © Google.
Why this score? — see what drove the B- grade
The composite is a weighted blend of 9 inputs, each scored 0–100. Each bar is that input's sub-score; the figure is the points it added to the 100-point composite (weight × sub-score).
- Cash flow +21.9/30.0
- ARV discount +15.0/15.0
- Appreciation +8.7/10.0
- DSCR +7.0/10.0
- 1% rule +5.3/10.0
- Livability +3.5/5.0
- Rent growth +3.1/5.0
- Schools +2.5/10.0
- Condition / age +2.5/5.0
$215,000
🖨 Deal sheet 📄 Offer letter ✓ Due diligence
Listing remarks
Affordable acreage in Venus with room to make it your own! This 3 bed 2 bath manufactured home sits on a full acre loaded with mature trees, a large fenced backyard, storage shed, and two carports (18x20 and a 20x22 with 3 sides enclosed). Metal roof replaced 2018, septic replaced 2020, new exterior electrical panels, and updated appliances. Enclosed porch, circle drive, and plenty of outdoor space to spread out. Horses permitted. Manufactured home financing available. Come see what a full acre in Venus can do!
Key facts
- Septic replaced
- Two carports
- Storage shed
Tags
Property features AI
Finance
- Other: Will not subdivide
- Financial info: Listing terms include Cash, Conventional, FHA; loan type treated as clear; no second mortgage
- HOA & community: No homeowners association
Exterior
- Parking: Covered, detached carport with 4 covered/carport spaces; Drive-through access, oversized and private parking; Driveway and gravel parking; On-site storage
- Security: Fire alarm
- Utilities: City water and Co-op water available; Septic and aerobic septic; Electricity connected and overhead utilities; Underground utilities present; Cable and phone available; All-weather road access; Located outside city limits
- Home design: Residential mobile home, single-story; Preowned (built in 2000); Deed restrictions apply
- Construction: Metal roof; Siding construction; Other type foundation; Year built 2000
- Exterior features: Front and rear porch; Gutters; Chain link fencing; Acreage corner lot (approximately 1 acre); Other structures on lot including garages and a second garage
Interior
- Kitchen: Electric cooktop, electric oven/range; Microwave; Refrigerator; Dishwasher; Disposal; Kitchen island; Pantry; Water line to refrigerator; Built-in cabinets
- Bedrooms: Primary bedroom on main level with ensuite bath, jetted tub, separate shower, and walk-in closet; Two additional bedrooms on main level
- Flooring: Carpet; Luxury vinyl plank; Tile
- Bathrooms: Two full bathrooms
- Heating & cooling: Central heating and electric heating with fireplace(s); Central air conditioning; Ceiling fans; Electric cooling
- Interior features: Open floorplan with kitchen island and pantry; Built-in features and built-in cabinets in laundry; Cable TV and high-speed internet available; Chandelier; Window coverings; Two living areas and one dining area; Jetted tub and separate shower in primary ensuite; Walk-in closet(s)
- Laundry & utility: Full-size washer/dryer area with washer and dryer hookups; Utility room
Neighborhood map
What this means for you Summary
Snapshot
- This is a 3-bed/2.0-bath manufactured listed at $215k.
Deal economics
- At list price, monthly cash flow is $337 ($4k/yr) — positive.
- The deal already cash-flows at list — no discount required.
- Meets the 1% rule at list price ($2k rent vs $215k).
- Cap rate 8.2% vs local median 3.0% in Venus — top-decile yield for the area; either an underpriced asset or a hidden risk that comps aren't pricing in. Stress-test before assuming the spread holds.
Location & tenants
- Location reads 70/100 on livability (#356 in TX) — a middle-class / working-renter tenant base. Strengths: crime A+, employment A+, cost of living A+; Watch: amenities F, commute F, health & safety F.
- Venus ISD (town): math 25% / reading 32% proficiency, ranked #646 of 826 in TX (top 78%) — low school quality limits family demand, transient renter base, plan for 1-2y turnover; 60% free/reduced lunch — lower-income household profile, screen leases tightly.
- Zoned schools: Venus El (math 27% / reading 30%, grade F, #2,706 of 4,322 statewide, top 63%, 658 students, 82% FRL) — zoned schools average 82% FRL vs 60% district-wide (22 pts higher); higher-poverty schools than district average — tighter screening recommended.
- Market conditions: Rents rising (+2.4%/yr); 426 active listings in the ZIP; solid renter incomes; 2,152 units permitted in Johnson County in 2024 (76 in 5+ unit buildings).
Forward outlook
- In year one you build about $17k of equity ($1k loan paydown + $16k appreciation (7.3% local appreciation)).
- Johnson County population projected at +24% by 2050 — long-run rental-demand tailwind backs the buy-and-hold thesis.
- At projected returns (7.3% appreciation + 2.4% rent growth), your $60k cash investment doubles in ~3 years — after that, you're playing with house money.
- By year 3, paydown + projected appreciation supports a ~$43k cash-out refi (75% LTV) — recoverable capital for the next deal without selling this one.
Negotiation context
- Only 3 days on market — expect competitive offers; lowballing is unlikely to land.
Risks & watch-outs
- Climate carrying-cost: major wind risk, 27% chance of damaging wind over 30y; moderate wildfire risk; extreme-heat days projected 7→24/yr by 2055 (HVAC capex compounding) — expect insurance premiums to compound above CPI over the hold.
Questions for the listing agent
- Is there a deadline driving the sale (1031 exchange, divorce, estate, relocation)? That informs how much negotiation room exists.
- Schools are D-rated, which usually means shorter tenancies and higher turnover. Who's the typical renter profile here, and what's been the actual vacancy rate?
- What's the average days-on-market for RENTAL listings here right now (not sales)? A rising rental-DOM trend means longer vacancies and softer asking-rent achievability than the comps imply.
- What's the recent tenant-quality profile in this submarket — average credit score on applications, eviction rate, late-payment / NSF rate, and stable-employment percentage? A property-management company in the area should have these aggregated.
- How much new for-sale + rental construction is in the pipeline within 1–3 miles? Heavy new supply typically softens prices + rents 12–24 months out; constrained supply supports both.
Investment metrics
- 1% rule
- 1.03% ✓
- Cap rate
- 8.17%
- Cash-on-cash
- 6.72%
- DSCR
- 1.30
- GRM
- 8.1
CMA / ARV
- ARV (on-the-fly)
- $260,568
- Comps found
- 2
Show comp detail 2 sales within ~0.75 mi
| Address | Dist | Beds/Ba | Sqft | Sold | Price | $/sf | Match |
|---|---|---|---|---|---|---|---|
| 11300 County Road 510 | 0.13mi | 3/2.0 | 1,920 (+4%) | 8mo | $269,900 | $141 | 81 |
| 10916 County Road 510 | 0.58mi | 3/2.0 | 1,624 (-12%) | 6mo | $220,000 | $135 | 48 |
Match score weights: distance 35% · size 25% · config 20% · recency 20%. Top-matched comps best support the ARV.
Projected returns pro-forma
7.32% appreciation · 2.39% rent growth · sell at horizon
- IRR
- 23.5%
- Equity multiple
- 2.65×
- Total profit
- $99,427
- Equity at exit
- $153,514
- IRR
- 21.4%
- Equity multiple
- 5.48×
- Total profit
- $269,849
- Equity at exit
- $295,801
Cash invested: $60,200 (down + closing). Projections, not guarantees.
Landlord ↔ Tenant lean methodology
- Overall (STATE)
- 87 Strongly Landlord-Friendly
- State Texas
- 87 Strongly Landlord-Friendly · R+5
- County
- — inherits STATE
- City
- — inherits STATE
ZIP-level market 76084
- Home prices YoY
- 2.1%
- Rents YoY
- 2.4%
- Active inventory
- 426
- Price-to-rent
- 8.1×
Monthly cashflow live
- Estimated rent
- $2,217 medium interval (Pro) →
- Mortgage (P&I)
- −$1,127
- Tax from tax record
- −$198 /mo · $2,370/yr
- Insurance
- −$90
- HOA
- −$0
- Vacancy / Maint / Mgmt
- −$466
- Net cashflow
- $337
Break-even live
UW: 25.0% down · 7.5% · 30yr · 1.5% tax · 5.0% vac · 8.0% maint · 8.0% mgmt
Financing live
Cash to close
- Down payment
- $53,750
- Closing costs
- $6,450
- Reserves months
- —
- Total cash needed
- —
Loan-product check · same deal, 3 products live
Conventional
25% down · 7.5% · 30yr
- Down + closing
- —
- Monthly P&I
- —
- Monthly cashflow
- —
- DSCR
- —
- Eligible?
- —
Personal DTI + credit; lowest rate.
DSCR
20% down · 8.5% · 30yr
- Down + closing
- —
- Monthly P&I
- —
- Monthly cashflow
- —
- DSCR
- —
- Eligible?
- —
No personal income docs; deal must DSCR.
Hard money
10% down · 12.0% · 12mo
- Down + closing
- —
- Monthly P&I
- —
- Monthly cashflow
- —
- DSCR
- —
- Eligible?
- —
Short-term bridge; refi at stabilization.
Listing history 5 events
-
2026-06-18days on market $215,000 Active 3 DOM
-
2026-06-17remarks 516-char remark
-
2026-06-17days on market $215,000 Active 2 DOM
-
2026-06-16remarks 498-char remark
-
2026-06-16$215,000 Active 1 DOM
ⓘ Source: listings_history table (triggers on properties + properties_extension) + one-shot
backfill from property_details.listing_events for pre-trigger history.
Tax reassessment forecast TX · Resets to sale price
- Current annual tax
- $2,370 · $198/mo
- Projected year-2 tax
- $3,934 · $328/mo
- Expected delta
- +$1,564/yr (+$130/mo · 66.0%)
ⓘ Screening estimate from a state-policy table — verify with the county assessor before closing.
Climate risk First Street
- Flood 1/10 Low FEMA zone X (unshaded) · 0% chance over 30 yrs
- Wildfire 5/10 Major
- Heat 7/10 Severe 7 d/yr ≥110°F today · 24 d/yr by 30 yrs out
- Wind 6/10 Major 27% chance of damaging wind over 30 yrs
- Air quality 2/10 Low 2 unhealthy d/yr today · 2 by 30 yrs out
Nearby sold comps map
Loading sold comps map…
Walkable amenities ~0.75 mi
Loading nearby amenities…
Taxation est. · year 1
- Rental income
- $26,605
- − Mortgage interest
- −$12,043
- − Property taxes
- −$2,370
- − Insurance
- −$1,075
- − Repairs & maintenance
- −$2,128
- − Management
- −$2,128
- − Depreciation
- −$6,255
- Taxable income
- $605
- Est. tax owed @ 24.0%
- −$145
- After-tax cash flow
- $3,898/yr
For passive investors: Depreciation is non-cash, so a rental often shows a tax loss while cash-flowing — sheltering income. Rental losses are passive: they offset passive income freely, and up to $25,000/yr can offset ordinary (W-2) income if you actively participate and your MAGI is under $100k (phasing out to $0 by $150k); unused losses carry forward. On sale, claimed depreciation is recaptured at up to 25%, and gains may owe capital-gains tax (a 1031 exchange can defer both). Figures are a year-1 estimate at your 24.0% rate — not tax advice; consult a CPA.
Schools (NCES district)
- District
- Venus ISD
- NCES district ID
- 4844010
- Math proficiency
- 25% ▼ -15.00%
- Reading proficiency
- 32% ▼ -2.00%
- Median HH income
- $50,394
- Composite
- 24.97/100
- National rank
- #7563
- State rank
- #646 of 826 in TX
Livability — Venus
- Score
- 70/100
- State rank
- #356
- US rank
- #7724
Category grades
Schools grade is shown separately in the Schools card above.
Census & demographics
- County
- Johnson County · 147,987 people
- Metro
- Dallas-Fort Worth-Arlington, TX
- Population (ZIP)
- 14,097
- Household income
- $102,115
- Rent vs Own
- Severe rent burden
- 70.0
Population outlook (Johnson County) Hauer SSP2
- Today (2025)
- 179,678 people
- By 2030
- 189,208 · +5.3%
- By 2040
- 207,261 · +15.4%
- By 2050
- 223,064 · +24.1%
- By 2075
- 259,979 · +44.7%
- By 2100
- 275,395 · +53.3%
Race, ethnicity, and origin ACS 2023
- Neighborhood character
- Diverse neighborhood (Simpson 0.63)
- Race & ethnicity
- White 52% Hispanic / Latino 30% Two or more races 24% Black 11% Asian 1%
- Hispanic origin (detail)
- Mexican 25% Puerto Rican 1%
- Common ancestry
- Romanian 2% Lithuanian 1% Slovak 1%
- Foreign-born
- 8% · Canada
- Languages at home
- 78% English-only · Spanish 18% Arabic 1% French/Haitian/Cajun 1%
Political lean MEDSL · Johnson
- 2024 margin
- Solid R (+51.4) · D 23.9% · R 75.3%
- 2008→2024 swing
- -3.9pp toward R · 2008: -47.5pp · 2024: -51.4pp
- All cycles
- 2024: R+51.4 2020: R+53.0 2016: R+58.3 2012: R+55.6 2008: R+47.5
Not yet ingested
- Civics
- —
Market trends
- HPI YoY
- ▲ 7.32%
- Current HPI
- 355.74
- Rent YoY
- ▲ 2.39%
- Metro
- Dallas-Fort Worth-Arlington, TX
- State GDP YoY
- ▲ 3.95%
- F500 in state
- 110
Industry mix (Fortune 500 HQ in TX)
| Industry | F500 HQs | Revenue |
|---|---|---|
| Energy | 16 | $1,198B |
|
||
| Technology | 5 | $198B |
|
||
| Engineering / Construction | 4 | $72B |
|
||
| Energy Services | 3 | $60B |
|
||
| Utilities | 3 | $41B |
|
||
| Healthcare | 2 | $330B |
|
||
Price history
2 events — show timeline
- 2026-06-11 Listed $215,000 NTREIS
- 2000-02-23 Sold (Public Records) — Public Records
Property tax history
+4.3%/yrLatest (2025): $2,370 · +5.7% YoY. Source: county tax records.
Cash-flow waterfall
monthlySold comps — $/sqft
last 12 mo · ≤1 miLoading sold comps…