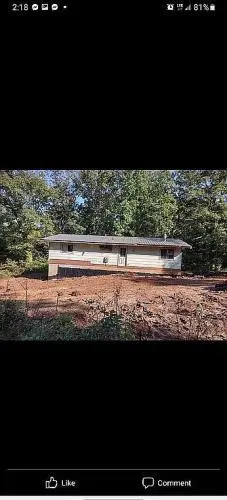
10391 Watercrest Rd · Potosi, MO
Flood risk 1/10 · Minimal
- FEMA flood zone
- X (unshaded)
- Chance of flooding over 30 yrs
- 0.0%
- Est. flood insurance / yr
- $473 – $860
Fire risk 4/10 · Minor
- Est. fire insurance / yr
- $1,054 – $1,958
Heat risk 4/10 · Minor
- Hot days now (above 105°F)
- 7 days/yr
- Hot days in 30 yrs
- 19 days/yr
Wind risk 2/10 · Minimal
- Chance of severe wind over 30 yrs
- 1.0%
Air-quality risk 2/10 · Minimal
- Unhealthy air days now
- 0 days/yr
- Unhealthy air days in 30 yrs
- 1 days/yr
Risk factors via First Street. Map © Google.
Why this score? — see what drove the A- grade
The composite is a weighted blend of 9 inputs, each scored 0–100. Each bar is that input's sub-score; the figure is the points it added to the 100-point composite (weight × sub-score).
- Cash flow +28.1/30.0
- ARV discount +15.0/15.0
- DSCR +10.0/10.0
- Appreciation +10.0/10.0
- 1% rule +7.7/10.0
- Schools +4.1/10.0
- Condition / age +3.8/5.0
- Livability +3.2/5.0
- Rent growth +2.5/5.0
$85,000
🖨 Deal sheet 📄 Offer letter ✓ Due diligence
Listing remarks
I acquired this house in September 2019 I have been working on it for years now. .. it was supposed to be a project home that I planned on finishing out my life in however my life has gone a different way now and ive decided to sell it & quot; as is& quot; .. . I have done alot to this house. .. I fixed the basement and its now got a 12inch thick waterproof wall. .. I have fixed and installed a new metal roof. .. I have completed gutted the upstairs and had new electricity ran its got a new amp box with new fuses. .. I have had the water gone through and its currently a mix of copper and pex. .. I also installed a new water line to the house new water heater rheem brand I tore out m
Key facts
- New metal roof
- New water line
- New electricity
Tags
Neighborhood map
What this means for you Summary
Snapshot
- This is a 3-bed/2.0-bath single-family listed at $85k. Condition is rated good.
Deal economics
- At list price, monthly cash flow is $267 ($3k/yr) — positive.
- The deal already cash-flows at list — no discount required.
- Meets the 1% rule at list price ($1k rent vs $85k).
- Recommended offer: $82k (3.0% below list) — sets the bar for market timing.
- Cap rate 10.1% vs local median 2.7% in Potosi — top-decile yield for the area; either an underpriced asset or a hidden risk that comps aren't pricing in. Stress-test before assuming the spread holds.
Location & tenants
- Location reads 65/100 on livability (#287 in MO) — a middle-class / working-renter tenant base. Strengths: cost of living A+, housing A, health & safety B+; Watch: schools D+, crime F, amenities D-.
- Potosi R-III (town): math 44% / reading 56% proficiency, ranked #53 of 324 in MO (top 16%) — acceptable for families but not a draw, mixed tenant base, ~2y average lease.
- Market conditions: 82 active listings in the ZIP.
Forward outlook
- In year one you build about $9k of equity ($588 loan paydown + $8k appreciation (10.0% local appreciation)).
- Washington County population projected at -21% by 2050 — secular population decline; favor cash flow + early exit over multi-decade hold.
- At projected returns (10.0% appreciation + 3.0% rent growth), your $24k cash investment doubles in ~2 years — after that, you're playing with house money.
- By year 4, paydown + projected appreciation supports a ~$32k cash-out refi (75% LTV) — recoverable capital for the next deal without selling this one.
Negotiation context
- It's been on market 36 days — a 3% lower offer ($82k) is reasonable based on typical stale-listing flexibility.
Questions for the listing agent
- It's been on market 36 days. Have you received any prior offers? Is the seller open to a 3% concession, seller financing, or rate buy-down credit?
- Built in 1979 — when were the roof, HVAC, electrical panel, plumbing, and water heater last replaced?
- Is there a deadline driving the sale (1031 exchange, divorce, estate, relocation)? That informs how much negotiation room exists.
- Schools are D-rated, which usually means shorter tenancies and higher turnover. Who's the typical renter profile here, and what's been the actual vacancy rate?
- Crime grade is F in this area — have there been break-ins, vandalism, or insurance claims at this property in the last 3 years? What carrier currently insures it and at what premium?
- What's the average days-on-market for RENTAL listings here right now (not sales)? A rising rental-DOM trend means longer vacancies and softer asking-rent achievability than the comps imply.
- What's the recent tenant-quality profile in this submarket — average credit score on applications, eviction rate, late-payment / NSF rate, and stable-employment percentage? A property-management company in the area should have these aggregated.
- How much new for-sale + rental construction is in the pipeline within 1–3 miles? Heavy new supply typically softens prices + rents 12–24 months out; constrained supply supports both.
Investment metrics
- 1% rule
- 1.27% ✓
- Cap rate
- 10.06%
- Cash-on-cash
- 13.46%
- DSCR
- 1.60
- GRM
- 6.5
CMA / ARV
- ARV (median comp)
- $128,369
- List price
- $85,000
- Delta
- -33.78%
- Verdict
- UNDERPRICED
- Comps
- 3 within 1.0 mi
Projected returns pro-forma
10.0% appreciation · 3.0% rent growth · sell at horizon
- IRR
- 34.2%
- Equity multiple
- 3.66×
- Total profit
- $63,313
- Equity at exit
- $76,575
- IRR
- 29.5%
- Equity multiple
- 8.27×
- Total profit
- $173,107
- Equity at exit
- $165,136
Cash invested: $23,800 (down + closing). Projections, not guarantees.
Landlord ↔ Tenant lean methodology
- Overall (STATE)
- 81 Strongly Landlord-Friendly
- State Missouri
- 81 Strongly Landlord-Friendly · R+10
- County
- — inherits STATE
- City
- — inherits STATE
ZIP-level market 63664
- Home prices YoY
- 25.1%
- Active inventory
- 82
- Price-to-rent
- 6.5×
Monthly cashflow live
- Estimated rent
- $1,082 medium interval (Pro) →
- Mortgage (P&I)
- −$446
- Tax est. 1.5%
- −$106 /mo · $1,275/yr
- Insurance
- −$35
- HOA
- −$0
- Vacancy / Maint / Mgmt
- −$227
- Net cashflow
- $267
Break-even live
UW: 25.0% down · 7.5% · 30yr · 1.5% tax · 5.0% vac · 8.0% maint · 8.0% mgmt
Financing live
Cash to close
- Down payment
- $21,250
- Closing costs
- $2,550
- Reserves months
- —
- Total cash needed
- —
Loan-product check · same deal, 3 products live
Conventional
25% down · 7.5% · 30yr
- Down + closing
- —
- Monthly P&I
- —
- Monthly cashflow
- —
- DSCR
- —
- Eligible?
- —
Personal DTI + credit; lowest rate.
DSCR
20% down · 8.5% · 30yr
- Down + closing
- —
- Monthly P&I
- —
- Monthly cashflow
- —
- DSCR
- —
- Eligible?
- —
No personal income docs; deal must DSCR.
Hard money
10% down · 12.0% · 12mo
- Down + closing
- —
- Monthly P&I
- —
- Monthly cashflow
- —
- DSCR
- —
- Eligible?
- —
Short-term bridge; refi at stabilization.
Listing history 15 events
-
2026-06-18days on market $85,000 Active 36 DOM
-
2026-06-17days on market $85,000 Active 35 DOM
-
2026-06-16days on market $85,000 Active 34 DOM
-
2026-06-15days on market $85,000 Active 33 DOM
-
2026-06-13days on market $85,000 Active 31 DOM
-
2026-06-12days on market $85,000 Active 30 DOM
-
2026-06-09days on market $85,000 Active 27 DOM
-
2026-06-08days on market $85,000 Active 26 DOM
-
2026-06-07days on market $85,000 Active 25 DOM
-
2026-06-07days on market $85,000 Active 24 DOM
-
2026-06-04days on market $85,000 Active 21 DOM
-
2026-06-02days on market $85,000 Active 20 DOM
-
2026-06-01days on market $85,000 Active 19 DOM
-
2026-05-31days on market $85,000 Active 18 DOM
-
2026-05-12$85,000 Active 1520-char remark
ⓘ Source: listings_history table (triggers on properties + properties_extension) + one-shot
backfill from property_details.listing_events for pre-trigger history.
Climate risk First Street
- Flood 1/10 Low FEMA zone X (unshaded) · 0% chance over 30 yrs
- Wildfire 4/10 Moderate
- Heat 4/10 Moderate 7 d/yr ≥105°F today · 19 d/yr by 30 yrs out
- Wind 2/10 Low 100% chance of damaging wind over 30 yrs
- Air quality 2/10 Low 0 unhealthy d/yr today · 1 by 30 yrs out
Nearby sold comps map
Loading sold comps map…
Walkable amenities ~0.75 mi
Loading nearby amenities…
Taxation est. · year 1
- Rental income
- $12,978
- − Mortgage interest
- −$4,761
- − Property taxes
- −$1,275
- − Insurance
- −$425
- − Repairs & maintenance
- −$1,038
- − Management
- −$1,038
- − Depreciation
- −$2,473
- Taxable income
- $1,967
- Est. tax owed @ 24.0%
- −$472
- After-tax cash flow
- $2,731/yr
For passive investors: Depreciation is non-cash, so a rental often shows a tax loss while cash-flowing — sheltering income. Rental losses are passive: they offset passive income freely, and up to $25,000/yr can offset ordinary (W-2) income if you actively participate and your MAGI is under $100k (phasing out to $0 by $150k); unused losses carry forward. On sale, claimed depreciation is recaptured at up to 25%, and gains may owe capital-gains tax (a 1031 exchange can defer both). Figures are a year-1 estimate at your 24.0% rate — not tax advice; consult a CPA.
Condition & rehab AI · 13 photos
The home requires extensive repairs, particularly to the foundation and windows, but has good systems and interior walls. Painting the exterior and replacing the windows would significantly increase its resale value.
Repairs flagged
- Major Foundation — Exposed foundation with visible damage
- Major Windows — Windows appear to be in poor condition
Value-add opportunities
- Resale Paint exterior — Enhances curb appeal
- Resale Replace windows — Improves energy efficiency and aesthetics
Renovation cost estimate screening
| Repair item | Severity | Est. cost |
|---|---|---|
| Foundation · Exposed foundation with visible damage | Major | $15,000–50,000 |
| Windows · Windows appear to be in poor condition | Major | $15,000–50,000 |
| Total estimated repair cost · 2 items | $30,000–100,000 |
Value-add ROI direction
- Resale Paint exterior — Enhances curb appeal ↑
- Resale Replace windows — Improves energy efficiency and aesthetics ↑
ⓘ Cost ranges are severity-bucket heuristics (US national rule-of-thumb). Get contractor quotes + a written scope before underwriting a rehab budget.
Schools (NCES district)
- District
- Potosi R-III
- NCES district ID
- 2925500
- Math proficiency
- 44% ▼ -14.00%
- Reading proficiency
- 56% ▼ -6.00%
- Median HH income
- $34,151
- Composite
- 41.22/100
- National rank
- #3536
- State rank
- #53 of 324 in MO
Livability — Potosi
- Score
- 65/100
- State rank
- #287
- US rank
- #13297
Category grades
Schools grade is shown separately in the Schools card above.
Census & demographics
- Population (ZIP)
- 9,060
Population outlook (Washington County) Hauer SSP2
- Today (2025)
- 23,761 people
- By 2030
- 22,923 · -3.5%
- By 2040
- 20,992 · -11.7%
- By 2050
- 18,849 · -20.7%
- By 2075
- 13,749 · -42.1%
- By 2100
- 9,016 · -62.1%
Race, ethnicity, and origin ACS 2023
- Neighborhood character
- Predominantly White (91%)
- Race & ethnicity
- White 91% Two or more races 7% Hispanic / Latino 2%
- Common ancestry
- Lithuanian 9% Italian 2% Serbian 1%
- Foreign-born
- 0%
Political lean MEDSL · Washington
- 2024 margin
- Solid R (+65.2) · D 17.1% · R 82.3%
- 2008→2024 swing
- -65.3pp toward R · 2008: 0.1pp · 2024: -65.2pp
- All cycles
- 2024: R+65.2 2020: R+62.6 2016: R+55.2 2012: R+18.6 2008: D+0.1
Not yet ingested
- Civics
- —
Market trends
- HPI YoY
- ▲ 59.56%
- Current HPI
- 296.5011
- Rent YoY
- —
- Metro
- —
- State GDP YoY
- ▲ 1.84%
- F500 in state
- 20
Industry mix (Fortune 500 HQ in MO)
| Industry | F500 HQs | Revenue |
|---|---|---|
| Healthcare | 1 | $163B |
|
||
| Insurance | 1 | $21B |
|
||
| Industrial Technology | 1 | $17B |
|
||
| Retail | 1 | $16B |
|
||
| Industrial Distribution | 1 | $10B |
|
||
| Utilities | 1 | $9B |
|
||
Price history
1 event — show timeline
- 2026-05-12 Listed $85,000 Fizber.com
Cash-flow waterfall
monthlySold comps — $/sqft
last 12 mo · ≤1 miLoading sold comps…