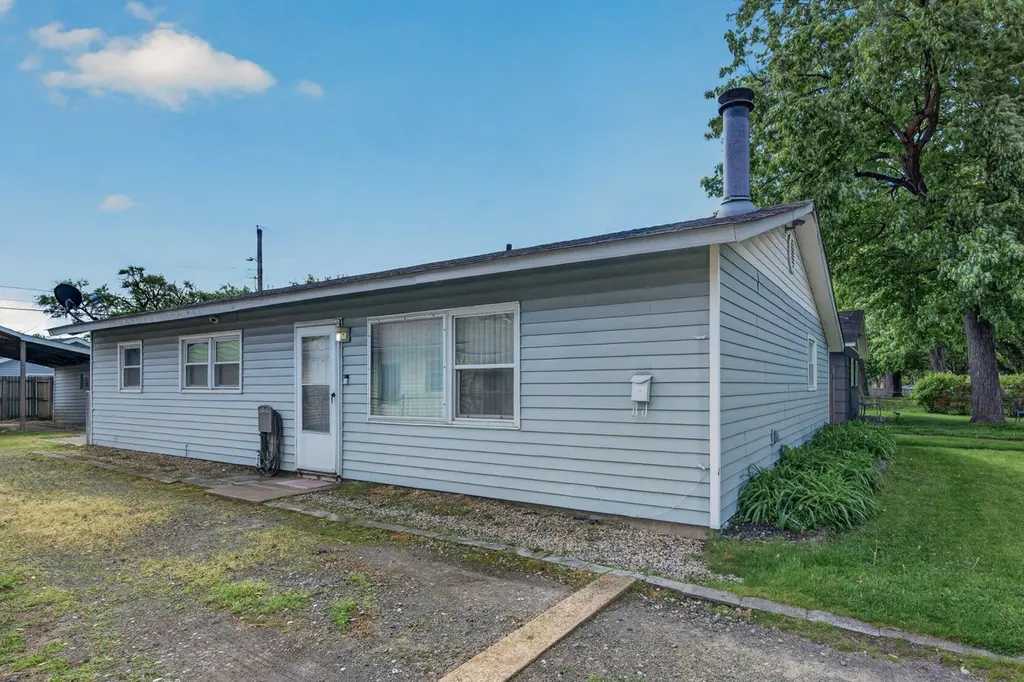
6327 Nevada Ave · Hammond, IN
Flood risk 6/10 · Moderate
- FEMA flood zone
- X (unshaded)
- Chance of flooding over 30 yrs
- 0.69%
- Est. flood insurance / yr
- $507 – $1,088
Fire risk 4/10 · Minor
- Est. fire insurance / yr
- $717 – $1,331
Heat risk 3/10 · Minor
- Hot days now (above 102°F)
- 7 days/yr
- Hot days in 30 yrs
- 15 days/yr
Wind risk 2/10 · Minimal
- Chance of severe wind over 30 yrs
- 1.0%
Air-quality risk 4/10 · Minor
- Unhealthy air days now
- 5 days/yr
- Unhealthy air days in 30 yrs
- 6 days/yr
Risk factors via First Street. Map © Google.
Why this score? — see what drove the D- grade
The composite is a weighted blend of 9 inputs, each scored 0–100. Each bar is that input's sub-score; the figure is the points it added to the 100-point composite (weight × sub-score).
- Cash flow +16.8/30.0
- DSCR +5.2/10.0
- ARV discount +4.0/15.0
- 1% rule +3.7/10.0
- Livability +3.5/5.0
- Rent growth +2.5/5.0
- Condition / age +2.5/5.0
- Schools +1.1/10.0
- Appreciation +0.0/10.0
$190,000
🖨 Deal sheet (PDF) 📄 Offer letter ✓ Due diligence
Listing remarks MLS
This quaint, well maintained 1056 sqft. ranch on Nevada Street has been cared for by its owners for 28 years. This home has 3 bedrooms, 1 bath, an enclosed hot tub off the Master bedroom, a detached 2.5 car garage with a built in shed, a large car port for a boat/camper/RV etc. , a gravel driveway that runs from curb to alley for easy access, and last but not least a separate 8x8 vinyl shed. Updated high efficiency furnace, central air and water heater. The roof is only 5 yrs. old and new windows were installed in 2012. It has a fitting backyard that's partially fenced which offers some privacy for a BBQ area. Schedule your showing today for this property.
Key facts
- Ample parking
- Convenient location
- 5,750 sq ft lot
Tags
Property features AI
Exterior
- Parking: Additional parking; Garage with approximately 2.5 spaces
- Utilities: Public water; Public sewer
- Home design: Single-level (one story); Built in 1957
- Construction: Year built 1957
- Exterior features: Neighborhood view; Other exterior features
Interior
- Kitchen: Built-in gas range; Microwave; Refrigerator; Dishwasher
- Bedrooms: Primary bedroom; Bedroom 2; Bedroom 3
- Flooring: Tile; Vinyl
- Bathrooms: 1 full bathroom
- Heating & cooling: Forced air heating; Central air conditioning; Ceiling fans
- Interior features: Eat-in kitchen; Living room fireplace
- Laundry & utility: Laundry room; Washer; Dryer
Neighborhood map
What this means for you Summary
Snapshot
- This is a 3-bed/1.0-bath single-family listed at $190k.
Deal economics
- At list price, monthly cash flow is $122 ($1k/yr) — positive.
- The deal already cash-flows at list — no discount required.
- To meet the 1% rule (rent ≥ 1% of price), the offer needs to be $166k (12.7% below list).
- Recommended offer: $166k (12.7% below list) — sets the bar for 1% rule.
- Cap rate 7.1% vs local median 5.8% in Hammond — meaningfully above typical; check what's discounted (condition, days-on-market, listing class) to confirm the premium yield is real.
Location & tenants
- Location reads 70/100 on livability (#143 in IN) — a middle-class / working-renter tenant base. Strengths: cost of living A+, housing A+, commute A; Watch: health & safety D+, employment D, crime F.
- School City Of Hammond (suburban): math 8% / reading 18% proficiency, ranked #289 of 301 in IN (top 96%) — low school quality limits family demand, transient renter base, plan for 1-2y turnover; 74% free/reduced lunch — lower-income household profile, screen leases tightly.
- Zoned schools: Warren G Harding Elementary School (math 11% / reading 19%, grade F, #859 of 994 statewide, top 87%, 684 students, 77% FRL); Charles N Scott Middle School (math 5% / reading 15%, grade F, #314 of 330 statewide, top 95%, 738 students, 75% FRL); Morton Senior High School (math 12% / reading 54%, grade F, #290 of 369 statewide, top 79%, 1,609 students, 69% FRL) — zoned schools at 74% FRL track the district average.
- Market conditions: 64 active listings in the ZIP; 5 comparable units currently listed for rent nearby; rentals leasing fast (median 6d on market — plan ~1-2 weeks tenant-placement turnaround); 1,642 units permitted in Lake County in 2024 (14 in 5+ unit buildings).
- This rent runs 33% of the median local income ($60k/yr) — at the standard rent-burdened threshold; future hikes will face affordability resistance.
Forward outlook
- Local home prices are declining (-3.0%/yr); year-one equity from $1k of loan paydown is wiped out by about $6k of value loss. Plan a longer hold.
- Lake County population projected to shrink 7% by 2050 — rents likely to lag national; underwrite the cash flow, not the appreciation.
Negotiation context
- It's been on market 17 days — a 2% lower offer ($187k) is reasonable based on typical stale-listing flexibility.
- 2 sale attempts since 7y ago with the ask held roughly flat each time — persistent listings suggest the price (not the market) is what's stuck; bring a comps-based counter.
- Current owner paid $88k; list at $190k implies a 117% gain — meaningful room to come down on a strong offer.
Risks & watch-outs
- Watch-outs: built in 1957 — expect roof / HVAC / electrical / plumbing capex.
- Climate carrying-cost: major flood risk — expect insurance premiums to compound above CPI over the hold.
Questions for the listing agent
- Built in 1957 — when were the roof, HVAC, electrical panel, plumbing, and water heater last replaced?
- Is there a deadline driving the sale (1031 exchange, divorce, estate, relocation)? That informs how much negotiation room exists.
- Schools are F-rated, which usually means shorter tenancies and higher turnover. Who's the typical renter profile here, and what's been the actual vacancy rate?
- Crime grade is F in this area — have there been break-ins, vandalism, or insurance claims at this property in the last 3 years? What carrier currently insures it and at what premium?
- The area grade is low — what's the realistic commute time and amenity access for the typical tenant pool here? Any planned neighborhood developments (good or bad) we should know about?
- What's the average days-on-market for RENTAL listings here right now (not sales)? A rising rental-DOM trend means longer vacancies and softer asking-rent achievability than the comps imply.
- What's the recent tenant-quality profile in this submarket — average credit score on applications, eviction rate, late-payment / NSF rate, and stable-employment percentage? A property-management company in the area should have these aggregated.
- How much new for-sale + rental construction is in the pipeline within 1–3 miles? Heavy new supply typically softens prices + rents 12–24 months out; constrained supply supports both.
Investment metrics
- 1% rule
- 0.87% ✗
- Cap rate
- 7.06%
- Cash-on-cash
- 2.75%
- DSCR
- 1.12
- GRM
- 9.5
CMA / ARV
- ARV (on-the-fly)
- $176,352
- Comps found
- 12
Show comp detail 12 sales within ~0.75 mi
| Address | Dist | Beds/Ba | Sqft | Sold | Price | $/sf | Match |
|---|---|---|---|---|---|---|---|
| 6402 New Hampshire Ave | 0.11mi | 3/1.0 | 1,026 (-3%) | 2mo | $205,000 | $200 | 88 |
| 3521 164th St | 0.24mi | 3/1.0 | 1,069 (+1%) | 3mo | $190,000 | $178 | 84 |
| 3515 164th St | 0.26mi | 3/1.0 | 1,037 (-2%) | 4mo | $110,500 | $107 | 82 |
| 6403 New Jersey Ave | 0.10mi | 3/1.0 | 1,143 (+8%) | 2mo | $150,000 | $131 | 80 |
| 3516 164th St | 0.27mi | 3/1.0 | 1,011 (-4%) | 3mo | $171,000 | $169 | 78 |
| 3448 164th St | 0.31mi | 3/1.0 | 1,011 (-4%) | 2mo | $162,000 | $160 | 76 |
| 6410 Grand Ave | 0.18mi | 3/1.0 | 1,166 (+10%) | 0mo | $151,000 | $130 | 74 |
| 6434 Ohio Ave | 0.21mi | 2/1.0 (-1) | 984 (-7%) | 2mo | $164,050 | $167 | 72 |
| 6316 Rhode Is | 0.22mi | 3/1.5 | 963 (-9%) | 1mo | $173,900 | $181 | 72 |
| 3228 163rd St | 0.58mi | 3/1.0 | 981 (-7%) | 0mo | $118,000 | $120 | 61 |
| 6612 Missouri Ave | 0.44mi | 3/1.0 | 1,190 (+13%) | 1mo | $197,900 | $166 | 58 |
| 6708 Kansas Ave | 0.65mi | 2/1.5 (-1) | 1,025 (-3%) | 3mo | $214,000 | $209 | 55 |
Match score weights: distance 35% · size 25% · config 20% · recency 20%. Top-matched comps best support the ARV.
Projected returns pro-forma
-3.0% appreciation · 3.0% rent growth · sell at horizon
- IRR
- -12.0%
- Equity multiple
- 0.57×
- Total profit
- $-23,084
- Equity at exit
- $28,330
- IRR
- -2.9%
- Equity multiple
- 0.81×
- Total profit
- $-10,323
- Equity at exit
- $16,428
Cash invested: $53,200 (down + closing). Projections, not guarantees.
Landlord ↔ Tenant lean methodology
- Overall (STATE)
- 90 Strongly Landlord-Friendly
- State Indiana
- 90 Strongly Landlord-Friendly · R+11
- County
- — inherits STATE
- City
- — inherits STATE
ZIP-level market 46323
- Home prices YoY
- -18.8%
- Active inventory
- 64
- Price-to-rent
- 9.5×
Monthly cashflow live
- Estimated rent
- $1,659 high interval (Pro) →
- Mortgage (P&I)
- −$996
- Tax from tax record
- −$113 /mo · $1,359/yr
- Insurance
- −$79
- HOA
- −$0
- Lot rent
- −$0
- Vacancy / Maint / Mgmt
- −$348
- Net cashflow
- $122
Break-even live
Sensitivity live
| Price | -10% $229 | -5% $176 | +0% $122 | +5% $68 | +10% $14 |
|---|---|---|---|---|---|
| Rent | -10% $-9 | -5% $56 | +0% $122 | +5% $187 | +10% $253 |
| Rate | -1.0pp $217 | -0.5pp $170 | base $122 | +0.5pp $73 | +1.0pp $22 |
UW: 25.0% down · 7.5% · 30yr · 1.5% tax · 5.0% vac · 8.0% maint · 8.0% mgmt
Financing live
Cash to close
- Down payment
- $47,500
- Closing costs
- $5,700
- Reserves months
- —
- Total cash needed
- —
Loan-product check · same deal, 3 products live
Conventional
25% down · 7.5% · 30yr
- Down + closing
- —
- Monthly P&I
- —
- Monthly cashflow
- —
- DSCR
- —
- Eligible?
- —
Personal DTI + credit; lowest rate.
DSCR
20% down · 8.5% · 30yr
- Down + closing
- —
- Monthly P&I
- —
- Monthly cashflow
- —
- DSCR
- —
- Eligible?
- —
No personal income docs; deal must DSCR.
Hard money
10% down · 12.0% · 12mo
- Down + closing
- —
- Monthly P&I
- —
- Monthly cashflow
- —
- DSCR
- —
- Eligible?
- —
Short-term bridge; refi at stabilization.
Rent comps 5 comps
| Address | Beds | Baths | Sqft | Rent | $/sqft | DOM | Units | Dist |
|---|---|---|---|---|---|---|---|---|
| 6320 Rhode Island Ave Hammond, IN | 3.0 | 1.0 | 916 | $1,550 | $1.69 | 5d | 1 | 0.24mi |
| 6610 Rhode Island Ave Hammond, IN | 3.0 | 1.0 | 1025 | $1,600 | $1.56 | 9d | 1 | 0.41mi |
| 3611 167th St Hammond, IN | 1.0–2.0 | 1.0 | 695 | $1,450 | $2.09 | 0d | 1 | 0.42mi |
| 2723 E 165th St Unit 3 Hammond, IN | 2.0 | 1.0 | 800 | $1,350 | $1.69 | 8d | 1 | 1.20mi |
| 6949 Alabama Ave Hammond, IN | 2.0 | 1.5 | 1200 | $1,795 | $1.50 | 6d | 1 | 1.31mi |
Listing history 5 events
-
2026-05-23status Pending
-
2026-05-17price $190,000
-
2026-05-05$195,000 Active
-
2019-03-27soldstatus $87,500 665-char remark
Show marketing remark (665 chars)
This quaint, well maintained 1056 sqft. ranch on Nevada Street has been cared for by its owners for 28 years. This home has 3 bedrooms, 1 bath, an enclosed hot tub off the Master bedroom, a detached 2.5 car garage with a built in shed, a large car port for a boat/camper/RV etc. , a gravel driveway that runs from curb to alley for easy access, and last but not least a separate 8x8 vinyl shed. Updated high efficiency furnace, central air and water heater. The roof is only 5 yrs. old and new windows were installed in 2012. It has a fitting backyard that's partially fenced which offers some privacy for a BBQ area. Schedule your showing today for this property.
-
2019-02-01$87,500 665-char remark
Show marketing remark (665 chars)
This quaint, well maintained 1056 sqft. ranch on Nevada Street has been cared for by its owners for 28 years. This home has 3 bedrooms, 1 bath, an enclosed hot tub off the Master bedroom, a detached 2.5 car garage with a built in shed, a large car port for a boat/camper/RV etc. , a gravel driveway that runs from curb to alley for easy access, and last but not least a separate 8x8 vinyl shed. Updated high efficiency furnace, central air and water heater. The roof is only 5 yrs. old and new windows were installed in 2012. It has a fitting backyard that's partially fenced which offers some privacy for a BBQ area. Schedule your showing today for this property.
ⓘ Source: listings_history table (triggers on properties + properties_extension) + one-shot
backfill from property_details.listing_events for pre-trigger history.
Tax reassessment forecast IN · Partial reset (capped growth)
- Current annual tax
- $1,359 · $113/mo
- Projected year-2 tax
- $1,487 · $124/mo
- Expected delta
- +$128/yr (+$11/mo · 9.4%)
ⓘ Screening estimate from a state-policy table — verify with the county assessor before closing.
Climate risk First Street
- Flood 6/10 Major FEMA zone X (unshaded) · 69% chance over 30 yrs
- Wildfire 4/10 Moderate
- Heat 3/10 Moderate 7 d/yr ≥102°F today · 15 d/yr by 30 yrs out
- Wind 2/10 Low 100% chance of damaging wind over 30 yrs
- Air quality 4/10 Moderate 5 unhealthy d/yr today · 6 by 30 yrs out
Nearby sold comps map
Loading sold comps map…
Walkable amenities ~0.75 mi
Loading nearby amenities…
Taxation est. · year 1
- Rental income
- $19,908
- − Mortgage interest
- −$10,643
- − Property taxes
- −$1,359
- − Insurance
- −$950
- − Repairs & maintenance
- −$1,593
- − Management
- −$1,593
- − Depreciation
- −$5,527
- Taxable loss
- −$1,757
- Est. tax savings @ 24.0%
- +$422
- After-tax cash flow
- $1,883/yr
For passive investors: Depreciation is non-cash, so a rental often shows a tax loss while cash-flowing — sheltering income. Rental losses are passive: they offset passive income freely, and up to $25,000/yr can offset ordinary (W-2) income if you actively participate and your MAGI is under $100k (phasing out to $0 by $150k); unused losses carry forward. On sale, claimed depreciation is recaptured at up to 25%, and gains may owe capital-gains tax (a 1031 exchange can defer both). Figures are a year-1 estimate at your 24.0% rate — not tax advice; consult a CPA.
Schools (NCES district)
- District
- School City Of Hammond
- NCES district ID
- 1804320
- Math proficiency
- 8% ▼ -18.00%
- Reading proficiency
- 18% ▼ -15.00%
- Median HH income
- $39,970
- Composite
- 11.11/100
- National rank
- #9730
- State rank
- #289 of 301 in IN
Livability — Hammond
- Score
- 70/100
- State rank
- #143
- US rank
- #7343
Category grades
Schools grade is shown separately in the Schools card above.
Census & demographics
- Census place
- Hammond, IN
- County
- Lake County · 422,878 people
- City population
- 58,809
- Metro
- Chicago-Naperville-Elgin, IL-IN-WI
- Population (ZIP)
- 23,047
- Household income
- $59,688
- Rent vs Own
- Severe rent burden
- 692.0
Population outlook (Lake County) Hauer SSP2
- Today (2025)
- 484,026 people
- By 2030
- 478,091 · -1.2%
- By 2040
- 462,974 · -4.3%
- By 2050
- 449,894 · -7.1%
- By 2075
- 436,169 · -9.9%
- By 2100
- 426,607 · -11.9%
Race, ethnicity, and origin ACS 2023
- Neighborhood character
- Diverse neighborhood (Simpson 0.68)
- Race & ethnicity
- Hispanic / Latino 38% White 36% Black 21% Two or more races 12% Asian 2% Native American 1%
- Hispanic origin (detail)
- Mexican 29% Puerto Rican 7%
- Common ancestry
- Romanian 6% Italian 2% Lithuanian 1%
- Foreign-born
- 8% · Canada, China
- Languages at home
- 78% English-only · Spanish 19% Chinese 1%
Political lean MEDSL · Lake
- 2024 margin
- Lean D (+5.6) · D 52.1% · R 46.5% · Other 1.5%
- 2008→2024 swing
- -28.6pp toward R · 2008: 34.3pp · 2024: 5.6pp
- All cycles
- 2024: D+5.6 2020: D+15.1 2016: D+20.6 2012: D+31.0 2008: D+34.3
Not yet ingested
- Civics
- —
Market trends
- HPI YoY
- ▼ -67.70%
- Current HPI
- 293.4702
- Rent YoY
- —
- Metro
- Chicago-Naperville-Elgin, IL-IN-WI
- State GDP YoY
- ▲ 2.90%
- F500 in state
- 18
Industry mix (Fortune 500 HQ in IN)
| Industry | F500 HQs | Revenue |
|---|---|---|
| Industrial Machinery | 2 | $37B |
|
||
| Healthcare | 1 | $177B |
|
||
| Pharmaceuticals | 1 | $45B |
|
||
| Metals / Steel | 1 | $18B |
|
||
| Agriculture | 1 | $17B |
|
||
| Packaging | 1 | $12B |
|
||
Price history
+117.1% since first listed5 events — show timeline
- 2026-05-23 Pending — NIRA MLS as Distributed by MLS Grid
- 2026-05-17 Price Changed $190,000 NIRA MLS as Distributed by MLS Grid
- 2026-05-05 Listed $195,000 NIRA MLS as Distributed by MLS Grid
- 2019-03-27 Sold (MLS) $87,500 NIRA MLS as Distributed by MLS Grid
- 2019-02-01 Listed $87,500 NIRA MLS as Distributed by MLS Grid
Property tax history
+3.2%/yrLatest (2024): $1,359 · -10.0% YoY. Source: county tax records.
Cash-flow waterfall
monthlySold comps — $/sqft
last 12 mo · ≤1 miLoading sold comps…