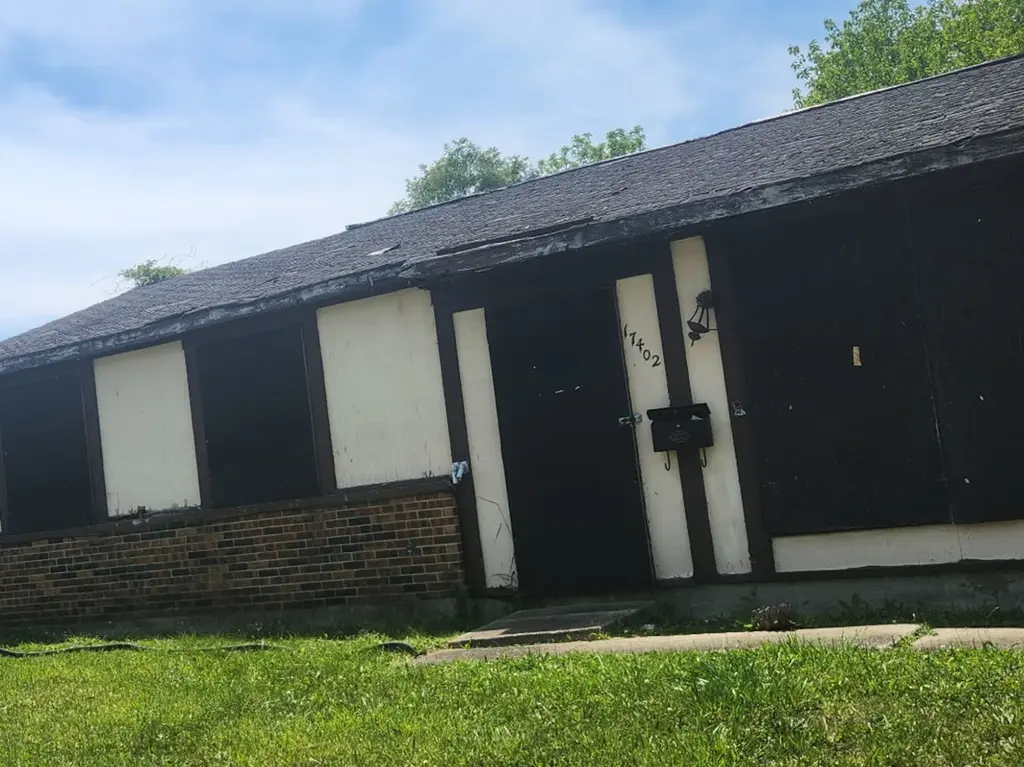
17402 Appletree Dr · Hazel Crest, IL
Flood risk 1/10 · Minimal
- FEMA flood zone
- X (unshaded)
- Chance of flooding over 30 yrs
- 0.0%
- Est. flood insurance / yr
- $473 – $860
Fire risk 1/10 · Minimal
- Est. fire insurance / yr
- $804 – $1,492
Heat risk 3/10 · Minor
- Hot days now (above 101°F)
- 7 days/yr
- Hot days in 30 yrs
- 15 days/yr
Wind risk 2/10 · Minimal
- Chance of severe wind over 30 yrs
- —
Air-quality risk 3/10 · Minor
- Unhealthy air days now
- 4 days/yr
- Unhealthy air days in 30 yrs
- 4 days/yr
Risk factors via First Street. Map © Google.
Why this score? — see what drove the D grade
The composite is a weighted blend of 9 inputs, each scored 0–100. Each bar is that input's sub-score; the figure is the points it added to the 100-point composite (weight × sub-score).
- Cash flow +15.0/30.0
- ARV discount +7.5/15.0
- 1% rule +5.0/10.0
- DSCR +5.0/10.0
- Livability +3.8/5.0
- Rent growth +2.5/5.0
- Condition / age +2.5/5.0
- Schools +1.5/10.0
- Appreciation +0.0/10.0
$25,000
🖨 Deal sheet (PDF) 📄 Offer letter ✓ Due diligence
Listing remarks
Investors stop the car! This single-family home has 2bd & 2baths with a 2-car detached garage. Make it your own or a turnkey investment. Instant equity after rehab.
Key facts
- 2 garage spots
- Built 1971
- Listed 17 days
Neighborhood map
What this means for you Summary
Snapshot
- This is a 2-bed/1.0-bath single-family listed at $25k.
Deal economics
- At list price, monthly cash flow is $2k ($22k/yr) — positive.
- The deal already cash-flows at list — no discount required.
- Meets the 1% rule at list price ($2k rent vs $25k).
- Recommended offer: $25k (1.5% below list) — sets the bar for market timing.
- Cap rate 92.5% vs local median 8.9% in Hazel Crest — top-decile yield for the area; either an underpriced asset or a hidden risk that comps aren't pricing in. Stress-test before assuming the spread holds.
Location & tenants
- Location reads 75/100 on livability (#229 in IL, #4,242 nationally) — a middle-class / working-renter tenant base. Strengths: commute A+, cost of living A+, housing A+; Watch: health & safety C-, crime F, amenities F.
- Bremen Chsd 228 (suburban): math 15% / reading 17% proficiency, ranked #468 of 620 in IL (top 76%) — low school quality limits family demand, transient renter base, plan for 1-2y turnover.
- Zoned schools: Highlands Elem School (math 8% / reading 12%, grade F, #1,517 of 2,056 statewide, top 78%, 327 students, 0% FRL); Prairie-Hills Junior High School (math 7% / reading 10%, grade F, #605 of 665 statewide, top 91%, 825 students, 0% FRL); Hillcrest High School (math 4% / reading 4%, grade F, #657 of 693 statewide, top 95%, 1,314 students, 0% FRL).
- Market conditions: 79 active listings in the ZIP; 2 comparable units currently listed for rent nearby; 6,272 units permitted in Cook County in 2024 (4,658 in 5+ unit buildings).
Forward outlook
- Local home prices are declining (-3.0%/yr); year-one equity from $173 of loan paydown is wiped out by about $750 of value loss. Plan a longer hold.
- At projected returns (-3.0% appreciation + 3.0% rent growth), your $7k cash investment doubles in ~1 year — after that, you're playing with house money.
Negotiation context
- It's been on market 17 days — a 2% lower offer ($25k) is reasonable based on typical stale-listing flexibility.
Questions for the listing agent
- Built in 1971 — when were the roof, HVAC, electrical panel, plumbing, and water heater last replaced?
- Is there a deadline driving the sale (1031 exchange, divorce, estate, relocation)? That informs how much negotiation room exists.
- Schools are D-rated, which usually means shorter tenancies and higher turnover. Who's the typical renter profile here, and what's been the actual vacancy rate?
- Crime grade is F in this area — have there been break-ins, vandalism, or insurance claims at this property in the last 3 years? What carrier currently insures it and at what premium?
- The area grade is low — what's the realistic commute time and amenity access for the typical tenant pool here? Any planned neighborhood developments (good or bad) we should know about?
- What's the average days-on-market for RENTAL listings here right now (not sales)? A rising rental-DOM trend means longer vacancies and softer asking-rent achievability than the comps imply.
- What's the recent tenant-quality profile in this submarket — average credit score on applications, eviction rate, late-payment / NSF rate, and stable-employment percentage? A property-management company in the area should have these aggregated.
- How much new for-sale + rental construction is in the pipeline within 1–3 miles? Heavy new supply typically softens prices + rents 12–24 months out; constrained supply supports both.
Investment metrics
- 1% rule
- 9.97% ✓
- Cap rate
- 92.50%
- Cash-on-cash
- 307.89%
- DSCR
- 14.70
- GRM
- 0.8
CMA / ARV
- ARV (on-the-fly)
- $179,520
- Comps found
- 12
Show comp detail 12 sales within ~0.75 mi
| Address | Dist | Beds/Ba | Sqft | Sold | Price | $/sf | Match |
|---|---|---|---|---|---|---|---|
| 17304 Peach Grov Ave | 0.17mi | 3/1.0 (+1) | 960 (0%) | 7mo | $143,500 | $149 | 81 |
| 3617 Coventry Ct | 0.04mi | 3/2.0 (+1) | 1,064 (+11%) | 1mo | $240,000 | $226 | 70 |
| 3704 Tamarind Ln | 0.18mi | 3/1.5 (+1) | 1,066 (+11%) | 1mo | $189,000 | $177 | 66 |
| 3618 Peach Grove Ln | 0.23mi | 3/1.0 (+1) | 1,092 (+14%) | 5mo | $175,000 | $160 | 57 |
| 3800 171st St | 0.39mi | 3/1.5 (+1) | 1,066 (+11%) | 5mo | $280,000 | $263 | 52 |
| 17801 Yale Ln | 0.53mi | 3/1.5 (+1) | 1,040 (+8%) | 3mo | $206,000 | $198 | 52 |
| 17620 Winston Dr | 0.41mi | 3/1.0 (+1) | 1,091 (+14%) | 3mo | $195,000 | $179 | 50 |
| 4050 Russet Way | 0.52mi | 3/2.0 (+1) | 1,058 (+10%) | 1mo | $259,000 | $245 | 49 |
| 17137 Coventry Ln | 0.52mi | 3/2.0 (+1) | 1,095 (+14%) | 2mo | $150,000 | $137 | 42 |
| 3318 Tulip Dr | 0.69mi | 3/1.5 (+1) | 1,093 (+14%) | 1mo | $225,000 | $206 | 36 |
| 17417 Kedzie Ave | 0.67mi | 3/2.0 (+1) | 1,100 (+15%) | 0mo | $200,000 | $182 | 35 |
| 17303 Kedzie Ave | 0.69mi | 3/2.0 (+1) | 1,093 (+14%) | 5mo | $204,000 | $187 | 31 |
Match score weights: distance 35% · size 25% · config 20% · recency 20%. Top-matched comps best support the ARV.
Projected returns pro-forma
-3.0% appreciation · 3.0% rent growth · sell at horizon
- IRR
- —
- Equity multiple
- 16.77×
- Total profit
- $110,375
- Equity at exit
- $3,728
- IRR
- —
- Equity multiple
- 35.79×
- Total profit
- $243,558
- Equity at exit
- $2,162
Cash invested: $7,000 (down + closing). Projections, not guarantees.
Landlord ↔ Tenant lean methodology
- Overall (STATE)
- 43 Moderately Tenant-Leaning
- State Illinois
- 43 Moderately Tenant-Leaning · D+7
- County
- — inherits STATE
- City
- — inherits STATE
ZIP-level market 60429
- Home prices YoY
- -14.0%
- Active inventory
- 79
- Price-to-rent
- 0.8×
Monthly cashflow live
- Estimated rent
- $2,492 medium interval (Pro) →
- Mortgage (P&I)
- −$131
- Tax est. 1.5%
- −$31 /mo · $375/yr
- Insurance
- −$10
- HOA
- −$0
- Vacancy / Maint / Mgmt
- −$523
- Net cashflow
- $1,796
Break-even live
Sensitivity live
| Price | -10% $1,813 | -5% $1,805 | +0% $1,796 | +5% $1,787 | +10% $1,779 |
|---|---|---|---|---|---|
| Rent | -10% $1,599 | -5% $1,698 | +0% $1,796 | +5% $1,894 | +10% $1,993 |
| Rate | -1.0pp $1,809 | -0.5pp $1,802 | base $1,796 | +0.5pp $1,790 | +1.0pp $1,783 |
UW: 25.0% down · 7.5% · 30yr · 1.5% tax · 5.0% vac · 8.0% maint · 8.0% mgmt
Financing live
Cash to close
- Down payment
- $6,250
- Closing costs
- $750
- Reserves months
- —
- Total cash needed
- —
Loan-product check · same deal, 3 products live
Conventional
25% down · 7.5% · 30yr
- Down + closing
- —
- Monthly P&I
- —
- Monthly cashflow
- —
- DSCR
- —
- Eligible?
- —
Personal DTI + credit; lowest rate.
DSCR
20% down · 8.5% · 30yr
- Down + closing
- —
- Monthly P&I
- —
- Monthly cashflow
- —
- DSCR
- —
- Eligible?
- —
No personal income docs; deal must DSCR.
Hard money
10% down · 12.0% · 12mo
- Down + closing
- —
- Monthly P&I
- —
- Monthly cashflow
- —
- DSCR
- —
- Eligible?
- —
Short-term bridge; refi at stabilization.
Rent comps 2 comps
| Address | Beds | Baths | Sqft | Rent | $/sqft | DOM | Units | Dist |
|---|---|---|---|---|---|---|---|---|
| 3501 177th St Country Club Hills, IL | 2.0 | 2.0 | 839 | $2,850 | $3.40 | 0d | 1 | 0.44mi |
| 17984 Amherst Ct Country Club Hills, IL | 2.0 | 1.0 | 1000 | $1,900 | $1.90 | 0d | 1 | 0.80mi |
Listing history 11 events
-
2026-06-21days on market $25,000 Active 17 DOM
-
2026-06-18days on market $25,000 Active 14 DOM
-
2026-06-17days on market $25,000 Active 13 DOM
-
2026-06-16days on market $25,000 Active 12 DOM
-
2026-06-15days on market $25,000 Active 11 DOM
-
2026-06-13days on market $25,000 Active 9 DOM
-
2026-06-09days on market $25,000 Active 5 DOM
-
2026-06-08days on market $25,000 Active 4 DOM
-
2026-06-07days on market $25,000 Active 3 DOM
-
2026-06-02remarks 166-char remark
-
2026-06-02$25,000 Active 1 DOM
ⓘ Source: listings_history table (triggers on properties + properties_extension) + one-shot
backfill from property_details.listing_events for pre-trigger history.
Climate risk First Street
- Flood 1/10 Low FEMA zone X (unshaded) · 0% chance over 30 yrs
- Wildfire 1/10 Low
- Heat 3/10 Moderate 7 d/yr ≥101°F today · 15 d/yr by 30 yrs out
- Wind 2/10 Low
- Air quality 3/10 Moderate 4 unhealthy d/yr today · 4 by 30 yrs out
Nearby sold comps map
Loading sold comps map…
Walkable amenities ~0.75 mi
Loading nearby amenities…
Taxation est. · year 1
- Rental income
- $29,905
- − Mortgage interest
- −$1,400
- − Property taxes
- −$375
- − Insurance
- −$125
- − Repairs & maintenance
- −$2,392
- − Management
- −$2,392
- − Depreciation
- −$727
- Taxable income
- $22,493
- Est. tax owed @ 24.0%
- −$5,398
- After-tax cash flow
- $16,154/yr
For passive investors: Depreciation is non-cash, so a rental often shows a tax loss while cash-flowing — sheltering income. Rental losses are passive: they offset passive income freely, and up to $25,000/yr can offset ordinary (W-2) income if you actively participate and your MAGI is under $100k (phasing out to $0 by $150k); unused losses carry forward. On sale, claimed depreciation is recaptured at up to 25%, and gains may owe capital-gains tax (a 1031 exchange can defer both). Figures are a year-1 estimate at your 24.0% rate — not tax advice; consult a CPA.
Schools (NCES district)
- District
- Bremen Chsd 228
- NCES district ID
- 1707050
- Math proficiency
- 15% ▼ -4.00%
- Reading proficiency
- 17% ▼ -5.00%
- Median HH income
- $57,625
- Composite
- 15.32/100
- National rank
- #9327
- State rank
- #468 of 620 in IL
Livability — Hazel Crest
- Score
- 75/100
- State rank
- #229
- US rank
- #4242
Category grades
Schools grade is shown separately in the Schools card above.
Census & demographics
- Census place
- Hazel Crest, IL
- City population
- 14,602
- Population (ZIP)
- 14,602
Population outlook (Cook County) Hauer SSP2
- Today (2025)
- 5,347,519 people
- By 2030
- 5,357,703 · +0.2%
- By 2040
- 5,324,924 · -0.4%
- By 2050
- 5,230,762 · -2.2%
- By 2075
- 4,785,735 · -10.5%
- By 2100
- 4,188,836 · -21.7%
Race, ethnicity, and origin ACS 2023
- Neighborhood character
- Predominantly Black (83%)
- Race & ethnicity
- Black 83% White 7% Hispanic / Latino 7% Two or more races 4%
- Hispanic origin (detail)
- Mexican 6%
- Common ancestry
- Romanian 1% Iranian 1%
- Foreign-born
- 5% · Canada
- Languages at home
- 93% English-only · Spanish 6%
Political lean MEDSL · Cook
- 2024 margin
- Solid D (+42.0) · D 70.4% · R 28.4% · Other 1.2%
- 2008→2024 swing
- -11.4pp toward R · 2008: 53.4pp · 2024: 42.0pp
- All cycles
- 2024: D+42.0 2020: D+50.3 2016: D+53.0 2012: D+49.4 2008: D+53.4
Not yet ingested
- Civics
- —
Market trends
- HPI YoY
- ▼ -46.04%
- Current HPI
- 282.3552
- Rent YoY
- —
- Metro
- —
- State GDP YoY
- ▲ 1.59%
- F500 in state
- 60
Industry mix (Fortune 500 HQ in IL)
| Industry | F500 HQs | Revenue |
|---|---|---|
| Insurance | 4 | $201B |
|
||
| Consumer Goods | 4 | $87B |
|
||
| Industrial Machinery | 3 | $64B |
|
||
| Healthcare | 2 | $55B |
|
||
| Retail / Pharmacy | 1 | $148B |
|
||
| Agriculture / Food | 1 | $86B |
|
||
Price history
1 event — show timeline
- 2026-06-02 Listed $25,000 MRED as Distributed by MLS Grid
Property tax history
+6.0%/yrLatest (2023): $5,635 · -17.3% YoY. Source: county tax records.
Cash-flow waterfall
monthlySold comps — $/sqft
last 12 mo · ≤1 miLoading sold comps…