 🌊 Lakefront
1133 SW 130th Ave · Tamiami, FL
Flood risk No data
- FEMA flood zone
- —
- Chance of flooding over 30 yrs
- —
- Est. flood insurance / yr
- —
Fire risk No data
- Est. fire insurance / yr
- —
Heat risk No data
- Hot days now (above threshold)
- —
- Hot days in 30 yrs
- —
Wind risk No data
- Chance of severe wind over 30 yrs
- —
Air-quality risk No data
- Unhealthy air days now
- —
- Unhealthy air days in 30 yrs
- —
Risk factors via First Street. Map © Google.
Why this score? — see what drove the B grade
The composite is a weighted blend of 9 inputs, each scored 0–100. Each bar is that input's sub-score; the figure is the points it added to the 100-point composite (weight × sub-score).
- Cash flow +30.0/30.0
- 1% rule +10.0/10.0
- DSCR +10.0/10.0
- ARV discount +7.5/15.0
- Schools +4.2/10.0
- Livability +4.0/5.0
- Rent growth +2.5/5.0
- Condition / age +2.5/5.0
- Appreciation +0.0/10.0
$179,999
🖨 Deal sheet 📄 Offer letter ✓ Due diligence
Listing remarks
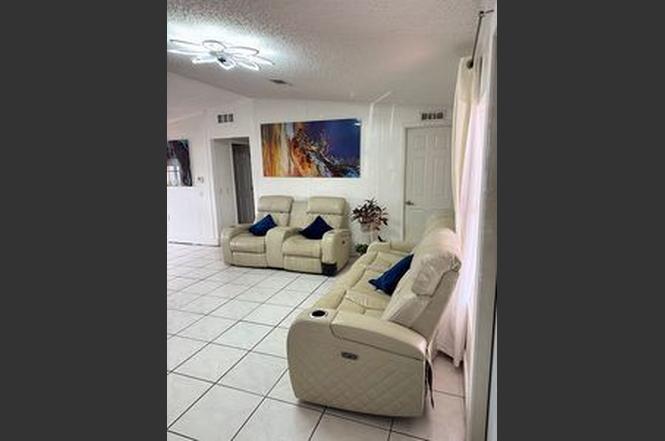
Welcome to this beautifully renovated and move-in ready 5-bedroom, 5-bathroom mobile home ideally located in the heart of Miami! This unique property offers incredible flexibility for homeowners and investors alike, featuring two bedrooms that have been converted into separate efficiencies, each generating monthly income. Inside, you'll find updated finishes and spacious living areas designed for comfortable everyday living. The home is equipped with a 2018 Central A/C system, providing peace of mind and energy efficiency for years to come. Step outside to enjoy the expansive backyard with stunning lake views, creating the perfect setting for entertaining, relaxing, or enjoying South Florid
Key facts
- Lake views
- Near major highways
- Energy efficiency
Tags
Neighborhood map
What this means for you Summary
Snapshot
- This is a 5-bed/5.0-bath manufactured listed at $180k.
Deal economics
- At list price, monthly cash flow is $1k ($17k/yr) — positive.
- The deal already cash-flows at list — no discount required.
- Meets the 1% rule at list price ($5k rent vs $180k).
- Cap rate 15.7% vs local median 3.4% in Tamiami — top-decile yield for the area; either an underpriced asset or a hidden risk that comps aren't pricing in. Stress-test before assuming the spread holds.
Location & tenants
- Location reads 79/100 on livability (#146 in FL, #2,197 nationally) — a middle-class / working-renter tenant base. Strengths: housing A+, health & safety A+, crime A; Watch: cost of living D, amenities F.
- Miami-Dade (suburban): math 45% / reading 54% proficiency, ranked #40 of 73 in FL (top 55%) — families likely to look elsewhere, expect single-tenant / working-renter base with shorter leases; 64% free/reduced lunch — lower-income household profile, screen leases tightly.
- Market conditions: 80 active listings in the ZIP; 22 comparable units currently listed for rent nearby; rentals at typical pace (median 24d on market — plan ~3-4 weeks tenant-placement turnaround); solid renter incomes; 10,051 units permitted in Miami-Dade County in 2024 (7,758 in 5+ unit buildings).
- At $4,881/mo this rent would consume 73% of the median local household income ($80k/yr) (locally 1139% of renters already pay >50% of income on rent) — very limited rent-growth headroom before tenants either downsize or default.
Forward outlook
- Local home prices are declining (-3.0%/yr); year-one equity from $1k of loan paydown is wiped out by about $5k of value loss. Plan a longer hold.
- Miami-Dade County population projected at +28% by 2050 — long-run rental-demand tailwind backs the buy-and-hold thesis.
- At projected returns (-3.0% appreciation + 3.0% rent growth), your $50k cash investment doubles in ~4 years — after that, you're playing with house money.
Negotiation context
- Only 3 days on market — expect competitive offers; lowballing is unlikely to land.
- 3 sale attempts since 3y ago with the ask held roughly flat each time — persistent listings suggest the price (not the market) is what's stuck; bring a comps-based counter.
Risks & watch-outs
- Watch-outs: HOA is 24% of rent.
Questions for the listing agent
- What does the HOA fee cover, when was the last increase, and are there any pending special assessments or reserve-fund shortfalls?
- Is there a deadline driving the sale (1031 exchange, divorce, estate, relocation)? That informs how much negotiation room exists.
- Schools are B-rated — typically a magnet for longer-tenancy family renters. What's the average tenant stay here, and is there a school-zone premium baked into asking?
- This sits on a lake — are riparian / water-frontage rights deeded with the parcel? Any dock permits, shoreline easements, or HOA water-use restrictions?
- What's the documented flood / surge / shoreline-erosion history here (FEMA AND non-FEMA — e.g., storm surge, creek backup, septic-field saturation)?
- Any water-quality or seasonal algae-bloom issues that affect tenant satisfaction or short-term-rental demand?
- What's the average days-on-market for RENTAL listings here right now (not sales)? A rising rental-DOM trend means longer vacancies and softer asking-rent achievability than the comps imply.
- What's the recent tenant-quality profile in this submarket — average credit score on applications, eviction rate, late-payment / NSF rate, and stable-employment percentage? A property-management company in the area should have these aggregated.
- How much new for-sale + rental construction is in the pipeline within 1–3 miles? Heavy new supply typically softens prices + rents 12–24 months out; constrained supply supports both.
Investment metrics
- 1% rule
- 2.71% ✓
- Cap rate
- 15.75%
- Cash-on-cash
- 33.77%
- DSCR
- 2.50
- GRM
- 3.1
CMA / ARV
No comps found within radius.
Projected returns pro-forma
-3.0% appreciation · 3.0% rent growth · sell at horizon
- IRR
- 29.3%
- Equity multiple
- 2.23×
- Total profit
- $61,968
- Equity at exit
- $26,838
- IRR
- 36.8%
- Equity multiple
- 4.44×
- Total profit
- $173,552
- Equity at exit
- $15,563
Cash invested: $50,400 (down + closing). Projections, not guarantees.
Landlord ↔ Tenant lean methodology
- Overall (STATE)
- 87 Strongly Landlord-Friendly
- State Florida
- 87 Strongly Landlord-Friendly · R+3
- County
- — inherits STATE
- City
- — inherits STATE
ZIP-level market 33184
- Home prices YoY
- -31.1%
- Active inventory
- 80
- Price-to-rent
- 3.1×
Monthly cashflow live
- Estimated rent
- $4,881 high interval (Pro) →
- Mortgage (P&I)
- −$944
- Tax est. 1.5%
- −$225 /mo · $2,700/yr
- Insurance
- −$75
- HOA
- −$1,194
- Vacancy / Maint / Mgmt
- −$1,025
- Net cashflow
- $1,418
Break-even live
UW: 25.0% down · 7.5% · 30yr · 1.5% tax · 5.0% vac · 8.0% maint · 8.0% mgmt
Financing live
Cash to close
- Down payment
- $45,000
- Closing costs
- $5,400
- Reserves months
- —
- Total cash needed
- —
Loan-product check · same deal, 3 products live
Conventional
25% down · 7.5% · 30yr
- Down + closing
- —
- Monthly P&I
- —
- Monthly cashflow
- —
- DSCR
- —
- Eligible?
- —
Personal DTI + credit; lowest rate.
DSCR
20% down · 8.5% · 30yr
- Down + closing
- —
- Monthly P&I
- —
- Monthly cashflow
- —
- DSCR
- —
- Eligible?
- —
No personal income docs; deal must DSCR.
Hard money
10% down · 12.0% · 12mo
- Down + closing
- —
- Monthly P&I
- —
- Monthly cashflow
- —
- DSCR
- —
- Eligible?
- —
Short-term bridge; refi at stabilization.
Rent comps 22 comps
| Address | Beds | Baths | Sqft | Rent | $/sqft | DOM | Units | Dist |
|---|---|---|---|---|---|---|---|---|
| 330 SW 133rd Pl Unit 330 Miami, FL | 4.0 | 3.0 | 2720 | $6,200 | $2.28 | 24d | 1 | 0.61mi |
| 1727 SW 136th Pl Miami, FL | 4.0 | 2.0 | 1796 | $3,800 | $2.12 | 16d | 1 | 0.72mi |
| 2045 SW 125th Ct Miami, FL | 4.0 | 2.5 | 2710 | $5,800 | $2.14 | 24d | 1 | 0.75mi |
| 2045 SW 125th Ct Unit 2045 Miami, FL | 4.0 | 2.5 | 2710 | $5,500 | $2.03 | 24d | 1 | 0.75mi |
| 2045 SW 125th Ct Miami, FL | 4.0 | 2.0 | 2710 | $5,800 | $2.14 | 16d | 1 | 0.75mi |
| 2220 SW 125th Ct Miami, FL | 4.0 | 2.5 | 2112 | $4,500 | $2.13 | 24d | 1 | 0.80mi |
| 220 NW 130th Ave Miami, FL | 4.0 | 2.0 | 2396 | $6,500 | $2.71 | 24d | 1 | 0.89mi |
| 13220 SW 25th St Miami, FL | 4.0 | 3.0 | 2382 | $4,900 | $2.06 | 24d | 1 | 0.90mi |
| 13220 SW 25th St Miami, FL | 4.0 | 3.0 | 2382 | $4,900 | $2.06 | 11d | 1 | 0.90mi |
| 1417 SW 139th Ave Unit 1417 Miami, FL | 4.0 | 2.0 | 2067 | $4,750 | $2.30 | 1d | 1 | 0.93mi |
| 1991 SW 139th Ave Miami, FL | 4.0 | 3.0 | 2548 | $4,200 | $1.65 | 24d | 1 | 1.04mi |
| 301 NW 136th Ave Miami, FL | 5.0 | 3.0 | 2449 | $5,400 | $2.20 | 24d | 1 | 1.05mi |
| 1981 SW 139th Ct Miami, FL | 4.0 | 2.0 | 2130 | $4,750 | $2.23 | 24d | 1 | 1.08mi |
| 14325 SW 11th Ter Miami, FL | 4.0 | 2.0 | 1973 | $3,850 | $1.95 | 24d | 1 | 1.26mi |
| 12447 NW 7th St Miami, FL | 4.0 | 3.0 | 2152 | $4,200 | $1.95 | 24d | 1 | 1.27mi |
| 12447 NW 7th St Miami, FL | 4.0 | 3.0 | 2152 | $4,200 | $1.95 | 7d | 1 | 1.27mi |
| 14302 SW 15th St Miami, FL | 4.0 | 3.0 | 2784 | $5,500 | $1.98 | 24d | 1 | 1.29mi |
| 11845 SW 3rd St Miami, FL | 4.0 | 3.0 | 2153 | $4,100 | $1.90 | 24d | 1 | 1.29mi |
| 881 NW 133rd Ave Miami, FL | 4.0 | 2.0 | 1930 | $4,600 | $2.38 | 5d | 1 | 1.43mi |
| 550 SW 115th Ave Unit 310F Miami, FL | 4.0 | 3.5 | 1426 | $3,200 | $2.24 | 24d | 1 | 1.47mi |
| 12693 NW 9th Ter Miami, FL | 4.0 | 3.0 | 1690 | $3,500 | $2.07 | 19d | 1 | 1.49mi |
| 12693 NW 9th Ter Miami, FL | 4.0 | 3.0 | 1690 | $3,350 | $1.98 | 3d | 1 | 1.49mi |
HOA detail
- Monthly dues
- $1,194 · $14,328/yr
Listing history 6 events
-
2026-06-18days on market $179,999 Active 3 DOM
-
2026-06-17days on market $179,999 Active 2 DOM
-
2026-06-16remarks 699-char remark
-
2026-06-16days on market $179,999 Active 1 DOM
-
2026-06-15remarks 207-char remark
-
2026-06-15$179,999 Active 2 DOM
ⓘ Source: listings_history table (triggers on properties + properties_extension) + one-shot
backfill from property_details.listing_events for pre-trigger history.
Nearby sold comps map
Loading sold comps map…
Walkable amenities ~0.75 mi
Loading nearby amenities…
Taxation est. · year 1
- Rental income
- $58,575
- − Mortgage interest
- −$10,083
- − Property taxes
- −$2,700
- − Insurance
- −$900
- − Repairs & maintenance
- −$4,686
- − Management
- −$4,686
- − HOA
- −$14,328
- − Depreciation
- −$5,236
- Taxable income
- $15,956
- Est. tax owed @ 24.0%
- −$3,829
- After-tax cash flow
- $13,189/yr
For passive investors: Depreciation is non-cash, so a rental often shows a tax loss while cash-flowing — sheltering income. Rental losses are passive: they offset passive income freely, and up to $25,000/yr can offset ordinary (W-2) income if you actively participate and your MAGI is under $100k (phasing out to $0 by $150k); unused losses carry forward. On sale, claimed depreciation is recaptured at up to 25%, and gains may owe capital-gains tax (a 1031 exchange can defer both). Figures are a year-1 estimate at your 24.0% rate — not tax advice; consult a CPA.
Schools (NCES district)
- District
- Miami-Dade
- NCES district ID
- 1200390
- Math proficiency
- 45% ▼ -16.00%
- Reading proficiency
- 54% ▼ -5.00%
- Median HH income
- $43,928
- Composite
- 41.76/100
- National rank
- #3397
- State rank
- #40 of 73 in FL
Livability — Tamiami
- Score
- 79/100
- State rank
- #146
- US rank
- #2197
Category grades
Schools grade is shown separately in the Schools card above.
Census & demographics
- Census place
- Tamiami, FL
- County
- Miami-Dade County · 2,697,751 people
- City population
- 80,608
- Metro
- Miami-Fort Lauderdale-Pompano Beach, FL
- Population (ZIP)
- 19,859
- Household income
- $79,784
- Rent vs Own
- Severe rent burden
- 1139.0
Population outlook (Miami-Dade County) Hauer SSP2
- Today (2025)
- 3,126,439 people
- By 2030
- 3,325,765 · +6.4%
- By 2040
- 3,697,561 · +18.3%
- By 2050
- 4,012,134 · +28.3%
- By 2075
- 4,605,612 · +47.3%
- By 2100
- 4,866,598 · +55.7%
Race, ethnicity, and origin ACS 2023
- Neighborhood character
- Predominantly Hispanic (92%)
- Race & ethnicity
- Hispanic / Latino 92% Two or more races 55% White 6%
- Hispanic origin (detail)
- Mexican 2% Puerto Rican 2% Cuban 71%
- Common ancestry
- Estonian 1%
- Foreign-born
- 69% · Canada, Jamaica, Dominican Republic
- Languages at home
- 7% English-only · Spanish 91% Other Indo-European 1% Chinese 1%
Political lean MEDSL · Miami-Dade
- 2024 margin
- R (+11.4) · D 43.9% · R 55.4%
- 2008→2024 swing
- -27.6pp toward R · 2008: 16.1pp · 2024: -11.4pp
- All cycles
- 2024: R+11.4 2020: D+7.3 2016: D+29.6 2012: D+23.7 2008: D+16.1
Not yet ingested
- Civics
- —
Market trends
- HPI YoY
- ▼ -197.33%
- Current HPI
- 437.8467
- Rent YoY
- —
- Metro
- Miami-Fort Lauderdale-Pompano Beach, FL
- State GDP YoY
- ▲ 3.28%
- F500 in state
- 36
Industry mix (Fortune 500 HQ in FL)
| Industry | F500 HQs | Revenue |
|---|---|---|
| Industrial Technology | 2 | $29B |
|
||
| Insurance | 2 | $17B |
|
||
| Retail | 1 | $60B |
|
||
| Technology Distribution | 1 | $58B |
|
||
| Homebuilding | 1 | $35B |
|
||
| Technology Manufacturing | 1 | $35B |
|
||
Price history
-10.0% since first listed5 events — show timeline
- 2026-06-14 Listed $179,999 FSBO.com
- 2023-07-24 Listing Removed — MARMLS
- 2023-07-05 Listed $200,000 MARMLS
- 2023-06-30 Listing Removed — MARMLS
- 2023-05-12 Listed $200,000 MARMLS
Cash-flow waterfall
monthlySold comps — $/sqft
last 12 mo · ≤1 miLoading sold comps…