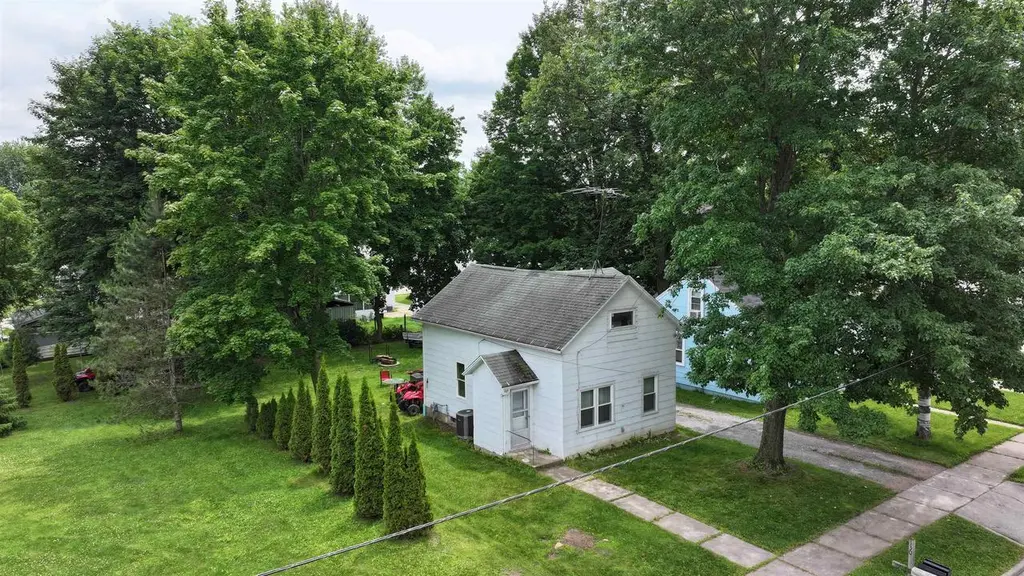
130 S Elm Ave · Gillett, WI
Flood risk 1/10 · Minimal
- FEMA flood zone
- X (unshaded)
- Chance of flooding over 30 yrs
- 0.0%
- Est. flood insurance / yr
- $473 – $860
Fire risk 1/10 · Minimal
- Est. fire insurance / yr
- $636 – $1,182
Heat risk 1/10 · Minimal
- Hot days now (above 97°F)
- 7 days/yr
- Hot days in 30 yrs
- 12 days/yr
Wind risk 1/10 · Minimal
- Chance of severe wind over 30 yrs
- —
Air-quality risk 2/10 · Minimal
- Unhealthy air days now
- 0 days/yr
- Unhealthy air days in 30 yrs
- 1 days/yr
Risk factors via First Street. Map © Google.
Why this score? — see what drove the D grade
The composite is a weighted blend of 9 inputs, each scored 0–100. Each bar is that input's sub-score; the figure is the points it added to the 100-point composite (weight × sub-score).
- Cash flow +15.0/30.0
- ARV discount +6.7/15.0
- DSCR +4.6/10.0
- 1% rule +3.8/10.0
- Livability +3.3/5.0
- Schools +2.9/10.0
- Rent growth +2.5/5.0
- Condition / age +2.5/5.0
- Appreciation +0.0/10.0
$174,900
🖨 Deal sheet 📄 Offer letter ✓ Due diligence
Listing remarks
Excellent price for this Gillett property! This 2 bedroom, 2 bathroom Cape Cod home is a great find. The main floor interior of this home is like brand new and Well-Maintained. Entire main floor was gutted to the studs and renovated. All new plumbing, electrical, insulation, sheetrock, Kitchen Cabinets, Countertops, bathroom fixtures, flooring, doors and windows. Range, Refrigerator, Microwave, Washer and Dryer are included in sale. Enjoy the deep backyard the property has to offer. Close to schools & shopping. Save money with your low house payment here! A must see! The exterior is Slate siding.
Key facts
- 6,098 sq ft lot
- Built 1946
- Listed 52 days
Property features AI
Exterior
- Utilities: Municipal water; Municipal sewer; Natural gas service
- Home design: 1.5-story single-family home; Construction completed
- Construction: Finished above-grade area about 1,600 sq. ft.; No finished below-grade square footage reported
- Exterior features: Asphalt/composite exterior; Lot is approximately 0.14 acres (under 1/2 acre); Residential zoning
Interior
- Kitchen: Kitchen on main level (13 x 14); Range/Oven; Refrigerator; Microwave
- Bedrooms: Master bedroom on upper level (14 x 14); Second bedroom on upper level (12 x 14)
- Bathrooms: Two full bathrooms
- Heating & cooling: Natural gas heating; Central air conditioning
- Interior features: Full basement with poured concrete and sump pump; Main-level living room
- Laundry & utility: Washer; Dryer
Neighborhood map
What this means for you Summary
Snapshot
- This is a 2-bed/2.0-bath other listed at $175k.
Deal economics
- At list price, monthly cash flow is $55 ($655/yr) — positive.
- The deal already cash-flows at list — no discount required.
- To meet the 1% rule (rent ≥ 1% of price), the offer needs to be $153k (12.4% below list).
- Recommended offer: $153k (12.4% below list) — sets the bar for 1% rule.
Location & tenants
- Location reads 66/100 on livability (#467 in WI) — a middle-class / working-renter tenant base. Strengths: crime A+, cost of living A+, housing A; Watch: employment D, amenities F, commute F.
- Gillett School District (rural): math 33% / reading 35% proficiency, ranked #245 of 342 in WI (top 72%) — families likely to look elsewhere, expect single-tenant / working-renter base with shorter leases.
- Zoned schools: Gillett High (math 15% / reading 24%, grade F, #376 of 483 statewide, top 79%, 159 students, 46% FRL) — zoned schools at 46% FRL track the district average.
- Zoned-school proficiency averages 20% at this address vs 34% district-wide (-14 pts) — the specific schools serving this property underperform the Gillett School District average; the district grade overstates school quality for this exact location.
- Market conditions: 16 active listings in the ZIP; 132 units permitted in Oconto County in 2024 (0 in 5+ unit buildings).
Forward outlook
- Local home prices are declining (-3.0%/yr); year-one equity from $1k of loan paydown is wiped out by about $5k of value loss. Plan a longer hold.
- Oconto County population projected at -20% by 2050 — secular population decline; favor cash flow + early exit over multi-decade hold.
Negotiation context
- It's been on market 52 days — a 3% lower offer ($170k) is reasonable based on typical stale-listing flexibility.
Risks & watch-outs
- Watch-outs: built in 1946 — expect roof / HVAC / electrical / plumbing capex.
Questions for the listing agent
- It's been on market 52 days. Have you received any prior offers? Is the seller open to a 12% concession, seller financing, or rate buy-down credit?
- Built in 1946 — when were the roof, HVAC, electrical panel, plumbing, and water heater last replaced?
- Is there a deadline driving the sale (1031 exchange, divorce, estate, relocation)? That informs how much negotiation room exists.
- Schools are D-rated, which usually means shorter tenancies and higher turnover. Who's the typical renter profile here, and what's been the actual vacancy rate?
- The area grade is low — what's the realistic commute time and amenity access for the typical tenant pool here? Any planned neighborhood developments (good or bad) we should know about?
- What's the average days-on-market for RENTAL listings here right now (not sales)? A rising rental-DOM trend means longer vacancies and softer asking-rent achievability than the comps imply.
- What's the recent tenant-quality profile in this submarket — average credit score on applications, eviction rate, late-payment / NSF rate, and stable-employment percentage? A property-management company in the area should have these aggregated.
- How much new for-sale + rental construction is in the pipeline within 1–3 miles? Heavy new supply typically softens prices + rents 12–24 months out; constrained supply supports both.
Investment metrics
- 1% rule
- 0.88% ✗
- Cap rate
- 6.67%
- Cash-on-cash
- 1.34%
- DSCR
- 1.06
- GRM
- 9.5
CMA / ARV
- ARV (median comp)
- $171,928
- List price
- $174,900
- Delta
- 1.73%
- Verdict
- FAIR
- Comps
- 20 within 1.0 mi
Projected returns pro-forma
-3.0% appreciation · 3.0% rent growth · sell at horizon
- IRR
- -14.2%
- Equity multiple
- 0.49×
- Total profit
- $-24,874
- Equity at exit
- $26,078
- IRR
- -5.4%
- Equity multiple
- 0.65×
- Total profit
- $-17,220
- Equity at exit
- $15,122
Cash invested: $48,972 (down + closing). Projections, not guarantees.
Landlord ↔ Tenant lean methodology
- Overall (STATE)
- 73 Landlord-Friendly
- State Wisconsin
- 73 Landlord-Friendly · R+2
- County
- — inherits STATE
- City
- — inherits STATE
ZIP-level market 54124
- Home prices YoY
- -13.8%
- Active inventory
- 16
- Price-to-rent
- 9.5×
Monthly cashflow live
- Estimated rent
- $1,533 medium interval (Pro) →
- Mortgage (P&I)
- −$917
- Tax from tax record
- −$166 /mo · $1,994/yr
- Insurance
- −$73
- HOA
- −$0
- Vacancy / Maint / Mgmt
- −$322
- Net cashflow
- $55
Break-even live
UW: 25.0% down · 7.5% · 30yr · 1.5% tax · 5.0% vac · 8.0% maint · 8.0% mgmt
Financing live
Cash to close
- Down payment
- $43,725
- Closing costs
- $5,247
- Reserves months
- —
- Total cash needed
- —
Loan-product check · same deal, 3 products live
Conventional
25% down · 7.5% · 30yr
- Down + closing
- —
- Monthly P&I
- —
- Monthly cashflow
- —
- DSCR
- —
- Eligible?
- —
Personal DTI + credit; lowest rate.
DSCR
20% down · 8.5% · 30yr
- Down + closing
- —
- Monthly P&I
- —
- Monthly cashflow
- —
- DSCR
- —
- Eligible?
- —
No personal income docs; deal must DSCR.
Hard money
10% down · 12.0% · 12mo
- Down + closing
- —
- Monthly P&I
- —
- Monthly cashflow
- —
- DSCR
- —
- Eligible?
- —
Short-term bridge; refi at stabilization.
Listing history 16 events
-
2026-06-18days on market $174,900 Active 52 DOM
-
2026-06-17days on market $174,900 Active 51 DOM
-
2026-06-16days on market $174,900 Active 50 DOM
-
2026-06-15days on market $174,900 Active 49 DOM
-
2026-06-15days on market $174,900 Active 48 DOM
-
2026-06-13days on market $174,900 Active 47 DOM
-
2026-06-12days on market $174,900 Active 46 DOM
-
2026-06-09days on market $174,900 Active 43 DOM
-
2026-06-08days on market $174,900 Active 42 DOM
-
2026-06-08days on market $174,900 Active 41 DOM
-
2026-06-05pricedays on market $174,900 Active 39 DOM
-
2026-06-03days on market $179,900 Active 37 DOM
-
2026-06-02days on market $179,900 Active 36 DOM
-
2026-06-01days on market $179,900 Active 35 DOM
-
2026-05-31days on market $179,900 Active 34 DOM
-
2026-04-23$179,900 Active 610-char remark
ⓘ Source: listings_history table (triggers on properties + properties_extension) + one-shot
backfill from property_details.listing_events for pre-trigger history.
Tax reassessment forecast WI · Partial reset (capped growth)
- Current annual tax
- $1,994 · $166/mo
- Projected year-2 tax
- $2,615 · $218/mo
- Expected delta
- +$621/yr (+$52/mo · 31.1%)
ⓘ Screening estimate from a state-policy table — verify with the county assessor before closing.
Climate risk First Street
- Flood 1/10 Low FEMA zone X (unshaded) · 0% chance over 30 yrs
- Wildfire 1/10 Low
- Heat 1/10 Low 7 d/yr ≥97°F today · 12 d/yr by 30 yrs out
- Wind 1/10 Low
- Air quality 2/10 Low 0 unhealthy d/yr today · 1 by 30 yrs out
Nearby sold comps map
Loading sold comps map…
Walkable amenities ~0.75 mi
Loading nearby amenities…
Taxation est. · year 1
- Rental income
- $18,392
- − Mortgage interest
- −$9,797
- − Property taxes
- −$1,994
- − Insurance
- −$874
- − Repairs & maintenance
- −$1,471
- − Management
- −$1,471
- − Depreciation
- −$5,088
- Taxable loss
- −$2,304
- Est. tax savings @ 24.0%
- +$553
- After-tax cash flow
- $1,208/yr
For passive investors: Depreciation is non-cash, so a rental often shows a tax loss while cash-flowing — sheltering income. Rental losses are passive: they offset passive income freely, and up to $25,000/yr can offset ordinary (W-2) income if you actively participate and your MAGI is under $100k (phasing out to $0 by $150k); unused losses carry forward. On sale, claimed depreciation is recaptured at up to 25%, and gains may owe capital-gains tax (a 1031 exchange can defer both). Figures are a year-1 estimate at your 24.0% rate — not tax advice; consult a CPA.
Schools (NCES district)
- District
- Gillett School District
- NCES district ID
- 5505250
- Math proficiency
- 33% ▼ -19.00%
- Reading proficiency
- 35% ▼ -16.00%
- Median HH income
- $43,986
- Composite
- 28.94/100
- National rank
- #6631
- State rank
- #245 of 342 in WI
Livability — Gillett
- Score
- 66/100
- State rank
- #467
- US rank
- #11862
Category grades
Schools grade is shown separately in the Schools card above.
Census & demographics
- Census place
- Gillett, WI
- Population (ZIP)
- 3,345
Population outlook (Oconto County) Hauer SSP2
- Today (2025)
- 36,829 people
- By 2030
- 35,853 · -2.7%
- By 2040
- 32,932 · -10.6%
- By 2050
- 29,355 · -20.3%
- By 2075
- 22,731 · -38.3%
- By 2100
- 16,736 · -54.6%
Race, ethnicity, and origin ACS 2023
- Neighborhood character
- Predominantly White (89%)
- Race & ethnicity
- White 89% Native American 6% Hispanic / Latino 4% Two or more races 3%
- Common ancestry
- Romanian 7% Portuguese 4% Iranian 3%
- Foreign-born
- 1%
- Languages at home
- 99% English-only · Spanish 1%
Political lean MEDSL · Oconto
- 2024 margin
- Solid R (+43.0) · D 28.0% · R 71.0%
- 2008→2024 swing
- -49.2pp toward R · 2008: 6.2pp · 2024: -43.0pp
- All cycles
- 2024: R+43.0 2020: R+41.0 2016: R+37.0 2012: R+9.5 2008: D+6.2
Not yet ingested
- Civics
- —
Market trends
- HPI YoY
- ▼ -45.57%
- Current HPI
- 285.0576
- Rent YoY
- —
- Metro
- —
- State GDP YoY
- ▲ 2.10%
- F500 in state
- 20
Industry mix (Fortune 500 HQ in WI)
| Industry | F500 HQs | Revenue |
|---|---|---|
| Industrial Machinery | 4 | $23B |
|
||
| Industrial Technology | 2 | $36B |
|
||
| Insurance | 1 | $36B |
|
||
| Professional Services | 1 | $19B |
|
||
| Utilities | 1 | $9B |
|
||
| Consumer Goods | 1 | $3B |
|
||
Price history
-2.8% since first listed2 events — show timeline
- 2026-06-05 Price Changed $174,900 RANW
- 2026-04-23 Listed $179,900 RANW
Property tax history
+6.3%/yrLatest (2025): $1,994 · +40.5% YoY. Source: county tax records.
Cash-flow waterfall
monthlySold comps — $/sqft
last 12 mo · ≤1 miLoading sold comps…