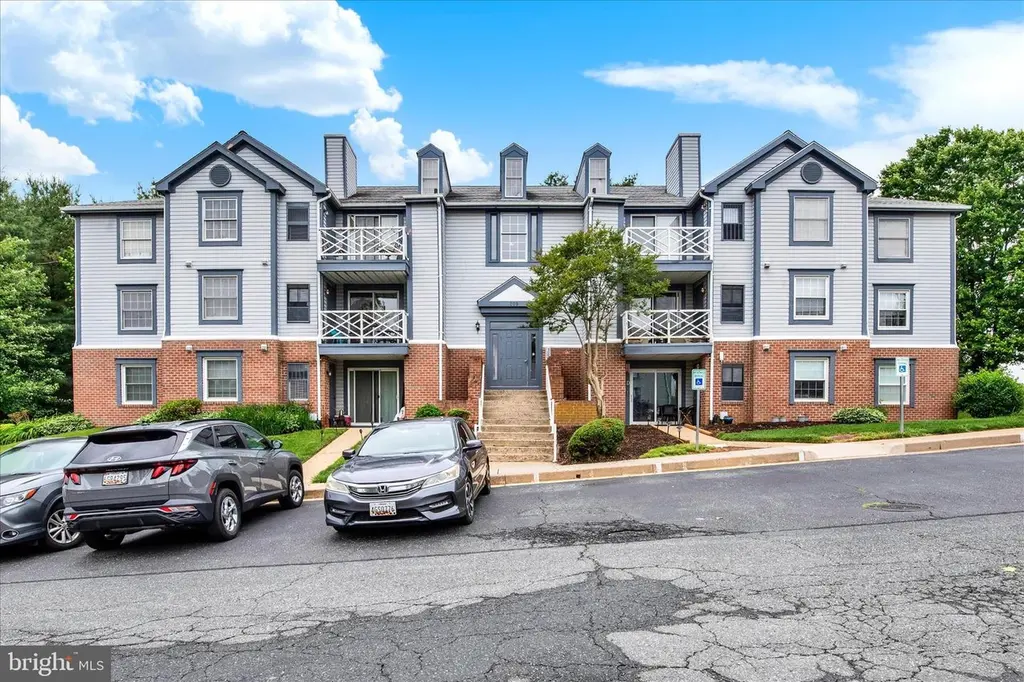
209 Oak Leaf Cir Unit 209-F · Bel Air South, MD
Flood risk 1/10 · Minimal
- FEMA flood zone
- X (unshaded)
- Chance of flooding over 30 yrs
- 0.0%
- Est. flood insurance / yr
- $473 – $860
Fire risk 1/10 · Minimal
- Est. fire insurance / yr
- $755 – $1,403
Heat risk 7/10 · Major
- Hot days now (above 105°F)
- 7 days/yr
- Hot days in 30 yrs
- 15 days/yr
Wind risk 5/10 · Moderate
- Chance of severe wind over 30 yrs
- 26.0%
Air-quality risk 3/10 · Minor
- Unhealthy air days now
- 2 days/yr
- Unhealthy air days in 30 yrs
- 3 days/yr
Risk factors via First Street. Map © Google.
Why this score? — see what drove the C- grade
The composite is a weighted blend of 9 inputs, each scored 0–100. Each bar is that input's sub-score; the figure is the points it added to the 100-point composite (weight × sub-score).
- Cash flow +17.6/30.0
- ARV discount +7.5/15.0
- 1% rule +6.0/10.0
- DSCR +5.5/10.0
- Rent growth +4.3/5.0
- Livability +4.1/5.0
- Schools +2.9/10.0
- Condition / age +2.5/5.0
- Appreciation +0.0/10.0
$195,000
🖨 Deal sheet 📄 Offer letter ✓ Due diligence
Listing remarks
Move right into this well-maintained 2 bedroom, 1 bath condo in the heart of Abingdon! Featuring clean carpeting and neutral paint throughout, this home offers a bright and comfortable layout ready for your personal touch. Spacious living room with access to a private balcony, separate dining area, and convenient in-unit washer and dryer. Both bedrooms offer generous space, including a primary bedroom with direct access to the full bath featuring dual sinks and a tub/shower combo with hall access. Enjoy low-maintenance living in a convenient location close to shopping, restaurants, parks, and commuter routes including I-95 and Route 24, making travel to Baltimore, Bel Air, and APG a breeze.
Key facts
- Dual sinks
- Private balcony
- Convenient location
Tags
Property features AI
Finance
- HOA & community: Condo fee $280 monthly; HOA fee $22 monthly; HOA covers common area maintenance, exterior building maintenance, lawn maintenance, sewer, snow removal, trash, and water; Community amenities include common grounds and a tot lot/playground; Pets allowed on a case-by-case basis
Exterior
- Parking: Parking lot
- Utilities: Public water; Public sewer; Electric service
- Home design: Condominium unit/flat; Garden-style building (1–4 floors); Entry on level 1; Unit located outside city limits
- Construction: Vinyl siding; Above-grade and below-grade structures; Year built per assessor
- Exterior features: Deck(s); No tidal water
Interior
- Kitchen: Dishwasher; Disposal; Exhaust fan; Refrigerator; Electric oven/range
- Bedrooms: 2 bedrooms on the main level
- Flooring: Carpet
- Bathrooms: 1 full bathroom on the main level; 1 full bathroom total
- Heating & cooling: Central heat (electric); Central air conditioning (electric); Electric hot water
- Interior features: Carpet; Ceiling fan(s); Dining area; Pantry; Tub with shower; Master bath
- Laundry & utility: Washer in unit; Dryer in unit
Neighborhood map
What this means for you Summary
Snapshot
- This is a 2-bed/1.0-bath condo listed at $195k.
Deal economics
- At list price, monthly cash flow is $152 ($2k/yr) — positive.
- The deal already cash-flows at list — no discount required.
- Meets the 1% rule at list price ($2k rent vs $195k).
- Recommended offer: $192k (1.5% below list) — sets the bar for market timing.
- Cap rate 7.2% vs local median 4.1% in Bel Air South — top-decile yield for the area; either an underpriced asset or a hidden risk that comps aren't pricing in. Stress-test before assuming the spread holds.
Location & tenants
- Location reads 82/100 on livability (#33 in MD, #1,172 nationally) — a professional / high-income tenant draw. Strengths: employment A+, housing A+, health & safety A+; Watch: crime D, cost of living D.
- Harford County Public Schools (suburban): math 22% / reading 39% proficiency, ranked #9 of 24 in MD (top 38%) — families likely to look elsewhere, expect single-tenant / working-renter base with shorter leases.
- Market conditions: Rents rising fast (+7.1%/yr); 158 active listings in the ZIP; 13 comparable units currently listed for rent nearby; rentals at typical pace (median 18d on market — plan ~3-4 weeks tenant-placement turnaround); high-income renter base; 803 units permitted in Harford County in 2024 (26 in 5+ unit buildings).
Forward outlook
- Local home prices are declining (-3.0%/yr); year-one equity from $1k of loan paydown is wiped out by about $6k of value loss. Plan a longer hold.
- At projected returns (-3.0% appreciation + 7.1% rent growth), your $55k cash investment doubles in ~10 years — after that, you're playing with house money.
Negotiation context
- It's been on market 23 days — a 2% lower offer ($192k) is reasonable based on typical stale-listing flexibility.
- Current owner paid $150k; 30% above their basis — modest negotiation headroom, anchor on the comps not their cost.
Risks & watch-outs
- Climate carrying-cost: moderate wind risk, 26% chance of damaging wind over 30y; extreme-heat days projected 7→15/yr by 2055 (HVAC capex compounding) — expect insurance premiums to compound above CPI over the hold.
Questions for the listing agent
- What does the HOA fee cover, when was the last increase, and are there any pending special assessments or reserve-fund shortfalls?
- Any open or pending special assessments — roof, HVAC, plumbing, elevator, façade? What's the per-unit balance and payoff schedule, and is the seller paying it off at close or rolling it to the buyer?
- Is there a deadline driving the sale (1031 exchange, divorce, estate, relocation)? That informs how much negotiation room exists.
- Schools are B-rated — typically a magnet for longer-tenancy family renters. What's the average tenant stay here, and is there a school-zone premium baked into asking?
- Crime grade is D in this area — have there been break-ins, vandalism, or insurance claims at this property in the last 3 years? What carrier currently insures it and at what premium?
- What's the average days-on-market for RENTAL listings here right now (not sales)? A rising rental-DOM trend means longer vacancies and softer asking-rent achievability than the comps imply.
- What's the recent tenant-quality profile in this submarket — average credit score on applications, eviction rate, late-payment / NSF rate, and stable-employment percentage? A property-management company in the area should have these aggregated.
- How much new apartment / multifamily construction is in the pipeline within 1–3 miles? Heavy new supply (>2% of stock underway) typically softens rents 12–24 months out; light construction supports rent growth.
Investment metrics
- 1% rule
- 1.10% ✓
- Cap rate
- 7.23%
- Cash-on-cash
- 3.34%
- DSCR
- 1.15
- GRM
- 7.6
CMA / ARV
No comps found within radius.
Projected returns pro-forma
-3.0% appreciation · 7.12% rent growth · sell at horizon
- IRR
- -5.9%
- Equity multiple
- 0.77×
- Total profit
- $-12,554
- Equity at exit
- $29,075
- IRR
- 8.6%
- Equity multiple
- 1.79×
- Total profit
- $43,356
- Equity at exit
- $16,860
Cash invested: $54,600 (down + closing). Projections, not guarantees.
Landlord ↔ Tenant lean methodology
- Overall (STATE)
- 27 Tenant-Leaning
- State Maryland
- 27 Tenant-Leaning · D+14
- County
- — inherits STATE
- City
- — inherits STATE
ZIP-level market 21009
- Rents YoY
- 7.1%
- Active inventory
- 158
- Price-to-rent
- 7.6×
Monthly cashflow live
- Estimated rent
- $2,138 high interval (Pro) →
- Mortgage (P&I)
- −$1,023
- Tax from tax record
- −$131 /mo · $1,577/yr
- Insurance
- −$81
- HOA
- −$302
- Vacancy / Maint / Mgmt
- −$449
- Net cashflow
- $152
Break-even live
UW: 25.0% down · 7.5% · 30yr · 1.5% tax · 5.0% vac · 8.0% maint · 8.0% mgmt
Financing live
Cash to close
- Down payment
- $48,750
- Closing costs
- $5,850
- Reserves months
- —
- Total cash needed
- —
Loan-product check · same deal, 3 products live
Conventional
25% down · 7.5% · 30yr
- Down + closing
- —
- Monthly P&I
- —
- Monthly cashflow
- —
- DSCR
- —
- Eligible?
- —
Personal DTI + credit; lowest rate.
DSCR
20% down · 8.5% · 30yr
- Down + closing
- —
- Monthly P&I
- —
- Monthly cashflow
- —
- DSCR
- —
- Eligible?
- —
No personal income docs; deal must DSCR.
Hard money
10% down · 12.0% · 12mo
- Down + closing
- —
- Monthly P&I
- —
- Monthly cashflow
- —
- DSCR
- —
- Eligible?
- —
Short-term bridge; refi at stabilization.
Rent comps 13 comps
| Address | Beds | Baths | Sqft | Rent | $/sqft | DOM | Units | Dist |
|---|---|---|---|---|---|---|---|---|
| 307L Tall Pines Ct Unit L Abingdon, MD | 3.0 | 2.0 | 1300 | $2,399 | $1.85 | 15d | 1 | 0.14mi |
| 2509 Merrick Ct Abingdon, MD | 3.0 | 1.5 | 1230 | $1,900 | $1.54 | 44d | 1 | 0.40mi |
| 129 Long Meadow Ct Abingdon, MD | 3.0 | 1.5 | 1240 | $2,200 | $1.77 | 44d | 1 | 0.46mi |
| 158 Glen View Ter Abingdon, MD | 2.0 | 2.5 | 1176 | $1,995 | $1.70 | 18d | 1 | 0.50mi |
| 3103 Cardinal Way Unit 1 Abingdon, MD | 2.0 | 1.0 | 976 | $1,800 | $1.84 | 18d | 1 | 0.83mi |
| 644 Berwick Ct Abingdon, MD | 3.0 | 2.5 | 1500 | $2,395 | $1.60 | 44d | 1 | 0.85mi |
| 200 Foxhall Dr Bel Air, MD | 1.0–3.0 | 1.0–2.0 | 924 | $1,904 | $2.06 | 2d | 28 | 0.88mi |
| 2814 Meredith Ct Abingdon, MD | 3.0 | 2.5 | 1320 | $2,300 | $1.74 | 24d | 1 | 0.90mi |
| 3361 Cheverly Ct Abingdon, MD | 3.0 | 2.5 | 1500 | $2,195 | $1.46 | 44d | 1 | 0.92mi |
| 321 Russo Way Bel Air, MD | 1.0–2.0 | 1.5–2.0 | 1199 | $2,459 | $2.05 | 2d | 16 | 1.17mi |
| 499 Crisfield Dr Abingdon, MD | 1.0–3.0 | 1.0–2.0 | 898 | $1,782 | $1.98 | 2d | 11 | 1.22mi |
| 499 Crisfield Dr Abingdon, MD | 1.0–3.0 | 1.0–2.0 | 898 | $1,864 | $2.08 | 44d | 20 | 1.22mi |
| 3101 White Oak Dr Abingdon, MD | 2.0 | 1.0–2.0 | 576 | $1,630 | $2.83 | 3d | 5 | 1.32mi |
HOA detail condo
- Monthly dues
- $302 · $3,624/yr
- Assessments
- None detected in remarks — confirm with the listing agent.
Listing history 19 events
-
2026-06-18days on market $195,000 Active 23 DOM
-
2026-06-17days on market $195,000 Active 22 DOM
-
2026-06-16days on market $195,000 Active 21 DOM
-
2026-06-15days on market $195,000 Active 20 DOM
-
2026-06-13days on market $195,000 Active 18 DOM
-
2026-06-09days on market $195,000 Active 14 DOM
-
2026-06-08days on market $195,000 Active 13 DOM
-
2026-06-07days on market $195,000 Active 12 DOM
-
2026-06-04days on market $195,000 Active 9 DOM
-
2026-06-03days on market $195,000 Active 8 DOM
-
2026-06-02days on market $195,000 Active 7 DOM
-
2026-06-01days on market $195,000 Active 6 DOM
-
2026-05-31days on market $195,000 Active 5 DOM
-
2026-05-26$195,000 Active
-
2021-04-30soldstatus $150,000
-
2008-10-15soldstatus $155,000
-
2004-04-07soldstatus $96,200
-
1998-01-06soldstatus $67,325
-
1991-06-26soldstatus $71,014
ⓘ Source: listings_history table (triggers on properties + properties_extension) + one-shot
backfill from property_details.listing_events for pre-trigger history.
Tax reassessment forecast MD · Partial reset (capped growth)
- Current annual tax
- $1,577 · $131/mo
- Projected year-2 tax
- $1,851 · $154/mo
- Expected delta
- +$274/yr (+$23/mo · 17.4%)
ⓘ Screening estimate from a state-policy table — verify with the county assessor before closing.
Climate risk First Street
- Flood 1/10 Low FEMA zone X (unshaded) · 0% chance over 30 yrs
- Wildfire 1/10 Low
- Heat 7/10 Severe 7 d/yr ≥105°F today · 15 d/yr by 30 yrs out
- Wind 5/10 Major 26% chance of damaging wind over 30 yrs
- Air quality 3/10 Moderate 2 unhealthy d/yr today · 3 by 30 yrs out
Nearby sold comps map
Loading sold comps map…
Walkable amenities ~0.75 mi
Loading nearby amenities…
Taxation est. · year 1
- Rental income
- $25,656
- − Mortgage interest
- −$10,923
- − Property taxes
- −$1,577
- − Insurance
- −$975
- − Repairs & maintenance
- −$2,052
- − Management
- −$2,052
- − HOA
- −$3,624
- − Depreciation
- −$5,673
- Taxable loss
- −$1,221
- Est. tax savings @ 24.0%
- +$293
- After-tax cash flow
- $2,114/yr
For passive investors: Depreciation is non-cash, so a rental often shows a tax loss while cash-flowing — sheltering income. Rental losses are passive: they offset passive income freely, and up to $25,000/yr can offset ordinary (W-2) income if you actively participate and your MAGI is under $100k (phasing out to $0 by $150k); unused losses carry forward. On sale, claimed depreciation is recaptured at up to 25%, and gains may owe capital-gains tax (a 1031 exchange can defer both). Figures are a year-1 estimate at your 24.0% rate — not tax advice; consult a CPA.
Schools (NCES district)
- District
- Harford County Public Schools
- NCES district ID
- 2400390
- Math proficiency
- 22% ▼ -23.00%
- Reading proficiency
- 39% ▼ -12.00%
- Median HH income
- $79,569
- Composite
- 29.38/100
- National rank
- #6527
- State rank
- #9 of 24 in MD
Livability — Bel Air South
- Score
- 82/100
- State rank
- #33
- US rank
- #1172
Category grades
Schools grade is shown separately in the Schools card above.
Census & demographics
- Census place
- Bel Air South, MD
- County
- Harford County · 198,512 people
- City population
- 63,895
- Metro
- Baltimore-Columbia-Towson, MD
- Population (ZIP)
- 33,679
- Household income
- $121,660
- Rent vs Own
- Severe rent burden
- 437.0
Population outlook (Harford County) Hauer SSP2
- Today (2025)
- 262,292 people
- By 2030
- 266,437 · +1.6%
- By 2040
- 269,954 · +2.9%
- By 2050
- 265,659 · +1.3%
- By 2075
- 252,886 · -3.6%
- By 2100
- 224,014 · -14.6%
Race, ethnicity, and origin ACS 2023
- Neighborhood character
- Predominantly White (68%)
- Race & ethnicity
- White 68% Black 18% Hispanic / Latino 6% Asian 4% Two or more races 4%
- Hispanic origin (detail)
- Mexican 2% Puerto Rican 1%
- Common ancestry
- Romanian 5% Lithuanian 2% Slovak 2%
- Foreign-born
- 7% · Canada, South Korea, China
- Languages at home
- 89% English-only · Spanish 3% Other Indo-European 2% Other Asian/Pacific 1%
Political lean MEDSL · Harford
- 2024 margin
- R (+13.8) · D 41.9% · R 55.7% · Other 2.4%
- 2008→2024 swing
- +5.0pp toward D · 2008: -18.8pp · 2024: -13.8pp
- All cycles
- 2024: R+13.8 2020: R+12.0 2016: R+24.5 2012: R+19.5 2008: R+18.8
Not yet ingested
- Civics
- —
Market trends
- HPI YoY
- ▼ -176.25%
- Current HPI
- 251.4376
- Rent YoY
- ▲ 7.12%
- Metro
- Baltimore-Columbia-Towson, MD
- State GDP YoY
- ▲ 2.97%
- F500 in state
- 12
Industry mix (Fortune 500 HQ in MD)
| Industry | F500 HQs | Revenue |
|---|---|---|
| Aerospace / Defense | 1 | $71B |
|
||
| Utilities | 1 | $25B |
|
||
| Hotels | 1 | $24B |
|
||
| Consumer Goods | 1 | $7B |
|
||
| Real Estate | 1 | $6B |
|
||
| Chemicals | 1 | $2B |
|
||
Price history
+174.6% since first listed6 events — show timeline
- 2026-05-26 Listed $195,000 BRIGHT MLS
- 2021-04-30 Sold (Public Records) $150,000 Public Records
- 2008-10-15 Sold (Public Records) $155,000 Public Records
- 2004-04-07 Sold (Public Records) $96,200 Public Records
- 1998-01-06 Sold (Public Records) $67,325 Public Records
- 1991-06-26 Sold (Public Records) $71,014 Public Records
Property tax history
+2.3%/yrLatest (2025): $1,577 · +9.3% YoY. Source: county tax records.
Cash-flow waterfall
monthlySold comps — $/sqft
last 12 mo · ≤1 miLoading sold comps…