 🏷️ Likely Rental
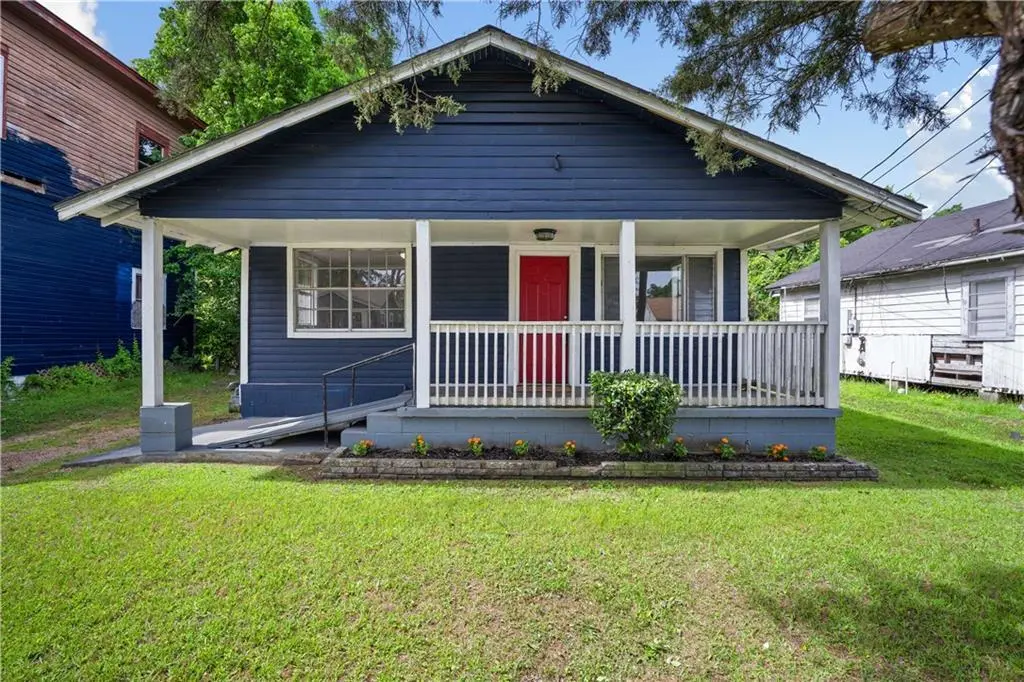
653 Carolina St N · Mobile, AL
Flood risk 9/10 · Severe
- FEMA flood zone
- X (shaded)
- Chance of flooding over 30 yrs
- 0.99%
- Est. flood insurance / yr
- $507 – $1,088
Fire risk 1/10 · Minimal
- Est. fire insurance / yr
- $916 – $1,700
Heat risk 9/10 · Severe
- Hot days now (above 105°F)
- 7 days/yr
- Hot days in 30 yrs
- 22 days/yr
Wind risk 9/10 · Severe
- Chance of severe wind over 30 yrs
- 99.0%
Air-quality risk 2/10 · Minimal
- Unhealthy air days now
- 1 days/yr
- Unhealthy air days in 30 yrs
- 1 days/yr
Risk factors via First Street. Map © Google.
Why this score? — see what drove the B+ grade
The composite is a weighted blend of 9 inputs, each scored 0–100. Each bar is that input's sub-score; the figure is the points it added to the 100-point composite (weight × sub-score).
- Cash flow +28.5/30.0
- ARV discount +15.0/15.0
- DSCR +10.0/10.0
- 1% rule +7.3/10.0
- Appreciation +5.7/10.0
- Livability +3.8/5.0
- Rent growth +2.5/5.0
- Condition / age +2.5/5.0
- Schools +2.3/10.0
$115,000
🖨 Deal sheet (PDF) 📄 Offer letter ✓ Due diligence
Listing remarks MLS
Income-producing rental property for sale! The subject property is a freshly remodeled 2 bedroom, 2 bathroom house. This property has the potential for a 3rd bedroom for an increase in rental income. A brand new roof was installed in 2022, a new HVAC system in 2021, new stainless steel appliances, fresh paint, added steel beams under the crawl space for structural support with a lifetime warranty, and more! This property currently rents for $975/mo. Tenant occupied, do not disturb tenants. Exterior photos in listing are outdated, rotted soffit/fascia has been replaced with new wood and painted. This property is professionally managed by Revitalize Realty.
Key facts
- 6,337 sq ft lot
- Built 1983
- Listed 45 days
Property features AI
Finance
- Other: No land lease; Property has a view; No pool or spa; No other exterior structures; No accessibility features listed
Exterior
- Parking: Driveway
- Utilities: Cable available; Electricity available (220 volts); Natural gas available; Public sewer; Public water
- Home design: Single family residence; Residential property; Built in 1983; Shingle roof; Pillar/post/pier foundation; Insulated windows
- Construction: Wood siding construction
- Exterior features: Private yard; Back yard fencing
Interior
- Kitchen: Electric oven; Refrigerator; Cabinets
- Bedrooms: 2 bedrooms
- Flooring: Ceramic tile; Vinyl
- Bathrooms: 2 full bathrooms
- Heating & cooling: Central heating; Central air conditioning
- Interior features: 9-foot ceilings on the main level; Open floorplan; Cabinets (kitchen)
- Laundry & utility: Washer; Dryer
Neighborhood map
What this means for you Summary
Snapshot
- This is a 2-bed/2.0-bath single-family listed at $115k.
Deal economics
- At list price, monthly cash flow is $311 ($4k/yr) — positive.
- The deal already cash-flows at list — no discount required.
- Meets the 1% rule at list price ($1k rent vs $115k).
- Recommended offer: $112k (3.0% below list) — sets the bar for market timing.
Location & tenants
- Location reads 75/100 on livability (#20 in AL, #4,262 nationally) — a middle-class / working-renter tenant base. Strengths: commute A+, cost of living A+, housing A+; Watch: crime F, employment D-.
- Mobile County (urban): math 15% / reading 39% proficiency, ranked #81 of 129 in AL (top 63%) — low school quality limits family demand, transient renter base, plan for 1-2y turnover; 67% free/reduced lunch — lower-income household profile, screen leases tightly.
- Zoned schools: Erwin Craighead Elementary School (math 2% / reading 22%, grade F, #536 of 627 statewide, top 88%, 420 students, 89% FRL); Calloway Smith Middle School (math 0% / reading 18%, grade F, #235 of 257 statewide, top 93%, 396 students, 96% FRL); Ben C Rain High School (math 2% / reading 2%, grade F, #291 of 305 statewide, top 100%, 589 students, 90% FRL) — zoned schools average 92% FRL vs 67% district-wide (24 pts higher); higher-poverty schools than district average — tighter screening recommended.
- Zoned-school proficiency averages 8% at this address vs 27% district-wide (-19 pts) — the specific schools serving this property underperform the Mobile County average; the district grade overstates school quality for this exact location.
- Market conditions: 36 active listings in the ZIP; 15 comparable units currently listed for rent nearby; rentals lingering (median 46d on market — plan ~5-8 weeks vacancy on turnover, expect pricing pressure); 53% of comp listings sitting > 30 days — soft ceiling on asking rent; 1,678 units permitted in Mobile County in 2024 (264 in 5+ unit buildings).
Forward outlook
- In year one you build about $2k of equity ($795 loan paydown + $2k appreciation (1.3% local appreciation)).
- Mobile County population projected to shrink 8% by 2050 — rents likely to lag national; underwrite the cash flow, not the appreciation.
- At projected returns (1.3% appreciation + 3.0% rent growth), your $32k cash investment doubles in ~5 years — after that, you're playing with house money.
Negotiation context
- It's been on market 45 days — a 3% lower offer ($112k) is reasonable based on typical stale-listing flexibility.
- 3 sale attempts since 4y ago with the ask held roughly flat each time — persistent listings suggest the price (not the market) is what's stuck; bring a comps-based counter.
- Current owner paid $89k; 29% above their basis — modest negotiation headroom, anchor on the comps not their cost.
Risks & watch-outs
- Watch-outs: flood insurance adds $66/mo.
- Climate carrying-cost: severe flood risk; severe wind risk, 99% chance of damaging wind over 30y; extreme-heat days projected 7→22/yr by 2055 (HVAC capex compounding) — expect insurance premiums to compound above CPI over the hold.
Questions for the listing agent
- It's been on market 45 days. Have you received any prior offers? Is the seller open to a 3% concession, seller financing, or rate buy-down credit?
- What's the actual annual flood-insurance premium (NFIP or private), and is the property in a SFHA with mandatory coverage?
- Is there a deadline driving the sale (1031 exchange, divorce, estate, relocation)? That informs how much negotiation room exists.
- Schools are D-rated, which usually means shorter tenancies and higher turnover. Who's the typical renter profile here, and what's been the actual vacancy rate?
- Crime grade is F in this area — have there been break-ins, vandalism, or insurance claims at this property in the last 3 years? What carrier currently insures it and at what premium?
- What's the average days-on-market for RENTAL listings here right now (not sales)? A rising rental-DOM trend means longer vacancies and softer asking-rent achievability than the comps imply.
- What's the recent tenant-quality profile in this submarket — average credit score on applications, eviction rate, late-payment / NSF rate, and stable-employment percentage? A property-management company in the area should have these aggregated.
- How much new for-sale + rental construction is in the pipeline within 1–3 miles? Heavy new supply typically softens prices + rents 12–24 months out; constrained supply supports both.
Investment metrics
- 1% rule
- 1.23% ✓
- Cap rate
- 10.23%
- Cash-on-cash
- 14.06%
- DSCR
- 1.63
- GRM
- 6.8
CMA / ARV
- ARV (median comp)
- $145,264
- List price
- $115,000
- Delta
- -20.83%
- Verdict
- UNDERPRICED
- Comps
- 20 within 1.0 mi
Show comp detail 12 sales within ~0.75 mi
| Address | Dist | Beds/Ba | Sqft | Sold | Price | $/sf | Match |
|---|---|---|---|---|---|---|---|
| 909 Dearborn St S | 0.04mi | 3/2.0 (+1) | 1,464 (+8%) | 7mo | $135,000 | $92 | 74 |
| 704 Marine St | 0.40mi | 2/2.0 | 1,220 (-10%) | 1mo | $167,000 | $137 | 65 |
| 808 Charles St | 0.45mi | 3/1.0 (+1) | 1,292 (-4%) | 1mo | $155,000 | $120 | 62 |
| 700 Marine St | 0.40mi | 3/2.0 (+1) | 1,322 (-2%) | 13mo | $152,000 | $115 | 62 |
| 700 Carolina St S | 0.07mi | 3/1.0 (+1) | 1,526 (+13%) | 15mo | $80,000 | $52 | 54 |
| 551 Marine St | 0.50mi | 3/2.0 (+1) | 1,204 (-11%) | 7mo | $127,000 | $105 | 47 |
| 1105 Marine St | 0.60mi | 3/2.0 (+1) | 1,500 (+11%) | 3mo | $235,000 | $157 | 46 |
| 1104 Marine St | 0.61mi | 3/2.0 (+1) | 1,500 (+11%) | 6mo | $235,000 | $157 | 44 |
| 502 George St | 0.73mi | 3/2.0 (+1) | 1,280 (-5%) | 11mo | $175,000 | $137 | 43 |
| 1103 Marine St | 0.59mi | 3/2.0 (+1) | 1,512 (+12%) | 8mo | $230,000 | $152 | 41 |
| 607 Texas St | 0.43mi | 3/2.0 (+1) | 1,539 (+14%) | 15mo | $189,500 | $123 | 40 |
| 906 Texas St | 0.55mi | 3/2.0 (+1) | 1,155 (-15%) | 18mo | $195,000 | $169 | 30 |
Match score weights: distance 35% · size 25% · config 20% · recency 20%. Top-matched comps best support the ARV.
Projected returns pro-forma
1.32% appreciation · 3.0% rent growth · sell at horizon
- IRR
- 14.2%
- Equity multiple
- 1.74×
- Total profit
- $23,793
- Equity at exit
- $41,195
- IRR
- 17.4%
- Equity multiple
- 3.18×
- Total profit
- $70,188
- Equity at exit
- $56,273
Cash invested: $32,200 (down + closing). Projections, not guarantees.
Landlord ↔ Tenant lean methodology
- Overall (STATE)
- 90 Strongly Landlord-Friendly
- State Alabama
- 90 Strongly Landlord-Friendly · R+15
- County
- — inherits STATE
- City
- — inherits STATE
ZIP-level market 36603
- Home prices YoY
- 2.8%
- Active inventory
- 36
- Price-to-rent
- 6.8×
Monthly cashflow live
- Estimated rent
- $1,413 high interval (Pro) →
- Mortgage (P&I)
- −$603
- Tax from tax record
- −$88 /mo · $1,060/yr
- Insurance
- −$48
- Flood insurance flood zone
- −$66 /mo · $798/yr
- HOA
- −$0
- Vacancy / Maint / Mgmt
- −$297
- Net cashflow
- $311
Break-even live
Sensitivity live
| Price | -10% $376 | -5% $343 | +0% $311 | +5% $278 | +10% $246 |
|---|---|---|---|---|---|
| Rent | -10% $199 | -5% $255 | +0% $311 | +5% $367 | +10% $422 |
| Rate | -1.0pp $369 | -0.5pp $340 | base $311 | +0.5pp $281 | +1.0pp $251 |
UW: 25.0% down · 7.5% · 30yr · 1.5% tax · 5.0% vac · 8.0% maint · 8.0% mgmt
Financing live
Cash to close
- Down payment
- $28,750
- Closing costs
- $3,450
- Reserves months
- —
- Total cash needed
- —
Loan-product check · same deal, 3 products live
Conventional
25% down · 7.5% · 30yr
- Down + closing
- —
- Monthly P&I
- —
- Monthly cashflow
- —
- DSCR
- —
- Eligible?
- —
Personal DTI + credit; lowest rate.
DSCR
20% down · 8.5% · 30yr
- Down + closing
- —
- Monthly P&I
- —
- Monthly cashflow
- —
- DSCR
- —
- Eligible?
- —
No personal income docs; deal must DSCR.
Hard money
10% down · 12.0% · 12mo
- Down + closing
- —
- Monthly P&I
- —
- Monthly cashflow
- —
- DSCR
- —
- Eligible?
- —
Short-term bridge; refi at stabilization.
Rent comps 15 comps
| Address | Beds | Baths | Sqft | Rent | $/sqft | DOM | Units | Dist |
|---|---|---|---|---|---|---|---|---|
| 711 Marine St Mobile, AL | 2.0 | 1.0 | 1100 | $1,150 | $1.05 | 45d | 1 | 0.35mi |
| 600 S Washington Ave Mobile, AL | 1.0–2.0 | 1.0 | 820 | $1,058 | $1.29 | 45d | 2 | 0.38mi |
| 1013 Elmira St Unit A Mobile, AL | 2.0 | 1.0 | 1000 | $995 | $0.99 | 23d | 1 | 0.71mi |
| 957 Savannah St Mobile, AL | 2.0 | 1.5 | 1054 | $1,400 | $1.33 | 23d | 1 | 0.77mi |
| 1204 Seneca St Mobile, AL | 3.0 | 2.0 | 1425 | $1,345 | $0.94 | 15d | 1 | 0.92mi |
| 500 Palmetto St Mobile, AL | 3.0 | 2.0 | 1786 | $1,450 | $0.81 | 45d | 1 | 0.95mi |
| 207 Michigan Ave Unit 3 Mobile, AL | 1.0 | 1.0 | 1000 | $795 | $0.80 | 23d | 1 | 1.21mi |
| 207 Michigan Ave Unit 3 Mobile, AL | 1.0 | 1.0 | 1000 | $795 | $0.80 | 45d | 1 | 1.21mi |
| 1417 Monroe St Mobile, AL | 2.0 | 1.0 | 1064 | $1,350 | $1.27 | 45d | 1 | 1.27mi |
| 1141 Montauk Ave Unit 1043864P Mobile, AL | 3.0 | 2.0 | 1420 | $2,741 | $1.93 | 15d | 1 | 1.27mi |
| 961 Old Shell Rd Unit A Mobile, AL | 3.0 | 2.5 | 1600 | $1,295 | $0.81 | 45d | 1 | 1.35mi |
| 558 Saint Francis St Unit 2D Mobile, AL | 1.0 | 1.0 | 1150 | $1,550 | $1.35 | 45d | 1 | 1.41mi |
| 250 Tuttle Ave Unit B Mobile, AL | 1.0 | 1.0 | 928 | $1,100 | $1.19 | 45d | 1 | 1.42mi |
| 412 Dauphin St Mobile, AL | 2.0 | 1.0–2.5 | 1553 | $2,350 | $1.51 | 15d | 2 | 1.43mi |
| 84 S Lafayette St Unit 1043577P Mobile, AL | 3.0 | 2.0 | 1496 | $3,116 | $2.08 | 15d | 1 | 1.48mi |
Listing history 24 events
-
2026-06-21days on market $115,000 Active 45 DOM
-
2026-06-18days on market $115,000 Active 42 DOM
-
2026-06-17days on market $115,000 Active 41 DOM
-
2026-06-16days on market $115,000 Active 40 DOM
-
2026-06-15days on market $115,000 Active 39 DOM
-
2026-06-14days on market $115,000 Active 37 DOM
-
2026-06-13pricedays on market $115,000 Active 36 DOM
-
2026-06-10days on market $120,000 Active 34 DOM
-
2026-06-09days on market $120,000 Active 33 DOM
-
2026-06-08days on market $120,000 Active 32 DOM
-
2026-06-07days on market $120,000 Active 31 DOM
-
2026-06-05days on market $120,000 Active 28 DOM
-
2026-06-03days on market $120,000 Active 27 DOM
-
2026-06-02days on market $120,000 Active 26 DOM
-
2026-06-01days on market $120,000 Active 25 DOM
-
2026-05-31days on market $120,000 Active 24 DOM
-
2026-05-30days on market $120,000 Active 23 DOM
-
2026-05-07$120,000 Active 1057-char remark
-
2024-11-18$115,000 Active
-
2023-03-22soldstatus $89,000
-
2023-03-21soldstatus $89,000 Closed
Show marketing remark (663 chars)
Income-producing rental property for sale! The subject property is a freshly remodeled 2 bedroom, 2 bathroom house. This property has the potential for a 3rd bedroom for an increase in rental income. A brand new roof was installed in 2022, a new HVAC system in 2021, new stainless steel appliances, fresh paint, added steel beams under the crawl space for structural support with a lifetime warranty, and more! This property currently rents for $975/mo. Tenant occupied, do not disturb tenants. Exterior photos in listing are outdated, rotted soffit/fascia has been replaced with new wood and painted. This property is professionally managed by Revitalize Realty.
-
2023-01-31historical Active Under Contract
Show marketing remark (663 chars)
Income-producing rental property for sale! The subject property is a freshly remodeled 2 bedroom, 2 bathroom house. This property has the potential for a 3rd bedroom for an increase in rental income. A brand new roof was installed in 2022, a new HVAC system in 2021, new stainless steel appliances, fresh paint, added steel beams under the crawl space for structural support with a lifetime warranty, and more! This property currently rents for $975/mo. Tenant occupied, do not disturb tenants. Exterior photos in listing are outdated, rotted soffit/fascia has been replaced with new wood and painted. This property is professionally managed by Revitalize Realty.
-
2022-12-31$90,000 Active
Show marketing remark (663 chars)
Income-producing rental property for sale! The subject property is a freshly remodeled 2 bedroom, 2 bathroom house. This property has the potential for a 3rd bedroom for an increase in rental income. A brand new roof was installed in 2022, a new HVAC system in 2021, new stainless steel appliances, fresh paint, added steel beams under the crawl space for structural support with a lifetime warranty, and more! This property currently rents for $975/mo. Tenant occupied, do not disturb tenants. Exterior photos in listing are outdated, rotted soffit/fascia has been replaced with new wood and painted. This property is professionally managed by Revitalize Realty.
-
2004-06-18soldstatus $50,000
ⓘ Source: listings_history table (triggers on properties + properties_extension) + one-shot
backfill from property_details.listing_events for pre-trigger history.
Tax reassessment forecast AL · Resets to sale price
- Current annual tax
- $1,060 · $88/mo
- Projected year-2 tax
- $1,060 · $88/mo
- Expected delta
- $0/yr ($0/mo · 0.0%)
ⓘ Screening estimate from a state-policy table — verify with the county assessor before closing.
Climate risk First Street
- Flood 9/10 Extreme FEMA zone X (shaded) · 99% chance over 30 yrs
- Wildfire 1/10 Low
- Heat 9/10 Extreme 7 d/yr ≥105°F today · 22 d/yr by 30 yrs out
- Wind 9/10 Extreme 99% chance of damaging wind over 30 yrs
- Air quality 2/10 Low 1 unhealthy d/yr today · 1 by 30 yrs out
Nearby sold comps map
Loading sold comps map…
Walkable amenities ~0.75 mi
Loading nearby amenities…
Taxation est. · year 1
- Rental income
- $16,961
- − Mortgage interest
- −$6,442
- − Property taxes
- −$1,060
- − Insurance
- −$1,372
- − Repairs & maintenance
- −$1,357
- − Management
- −$1,357
- − Depreciation
- −$3,345
- Taxable income
- $2,027
- Est. tax owed @ 24.0%
- −$487
- After-tax cash flow
- $3,243/yr
For passive investors: Depreciation is non-cash, so a rental often shows a tax loss while cash-flowing — sheltering income. Rental losses are passive: they offset passive income freely, and up to $25,000/yr can offset ordinary (W-2) income if you actively participate and your MAGI is under $100k (phasing out to $0 by $150k); unused losses carry forward. On sale, claimed depreciation is recaptured at up to 25%, and gains may owe capital-gains tax (a 1031 exchange can defer both). Figures are a year-1 estimate at your 24.0% rate — not tax advice; consult a CPA.
Schools (NCES district)
- District
- Mobile County
- NCES district ID
- 0102370
- Math proficiency
- 15% ▼ -28.00%
- Reading proficiency
- 39% ▬ 0.00%
- Median HH income
- $42,455
- Composite
- 22.9/100
- National rank
- #8002
- State rank
- #81 of 129 in AL
Livability — Mobile
- Score
- 75/100
- State rank
- #20
- US rank
- #4262
Category grades
Schools grade is shown separately in the Schools card above.
Census & demographics
- Census place
- Mobile, AL
- City population
- 205,729
- Population (ZIP)
- 7,805
Population outlook (Mobile County) Hauer SSP2
- Today (2025)
- 415,303 people
- By 2030
- 411,755 · -0.9%
- By 2040
- 399,670 · -3.8%
- By 2050
- 382,616 · -7.9%
- By 2075
- 337,353 · -18.8%
- By 2100
- 283,391 · -31.8%
Race, ethnicity, and origin ACS 2023
- Neighborhood character
- Predominantly Black (85%)
- Race & ethnicity
- Black 85% White 12% Two or more races 1% Hispanic / Latino 1%
- Common ancestry
- Lithuanian 1%
- Foreign-born
- 1% · Canada
- Languages at home
- 99% English-only · Spanish 1%
Political lean MEDSL · Mobile
- 2024 margin
- R (+16.4) · D 41.3% · R 57.7%
- 2008→2024 swing
- -7.7pp toward R · 2008: -8.7pp · 2024: -16.4pp
- All cycles
- 2024: R+16.4 2020: R+11.9 2016: R+13.9 2012: R+9.3 2008: R+8.7
Not yet ingested
- Civics
- —
Market trends
- HPI YoY
- ▲ 1.32%
- Current HPI
- 48.9551
- Rent YoY
- —
- Metro
- —
- State GDP YoY
- ▲ 2.94%
- F500 in state
- 4
Industry mix (Fortune 500 HQ in AL)
| Industry | F500 HQs | Revenue |
|---|---|---|
| Financial Services | 1 | $8B |
|
||
| Healthcare | 1 | $5B |
|
||
Price history
+130.0% since first listed8 events — show timeline
- 2026-06-12 Price Changed $115,000 GCMLS AL
- 2026-05-07 Listed $120,000 GCMLS AL
- 2024-11-18 Listed $115,000 BCAR
- 2023-03-22 Sold (Public Records) $89,000 Public Records
- 2023-03-21 Sold (MLS) $89,000 GCMLS AL
- 2023-01-31 Contingent — GCMLS AL
- 2022-12-31 Listed $90,000 GCMLS AL
- 2004-06-18 Sold (Public Records) $50,000 Public Records
Property tax history
+9.1%/yrLatest (2025): $1,060 · +1.3% YoY. Source: county tax records.
Cash-flow waterfall
monthlySold comps — $/sqft
last 12 mo · ≤1 miLoading sold comps…