 Triplex
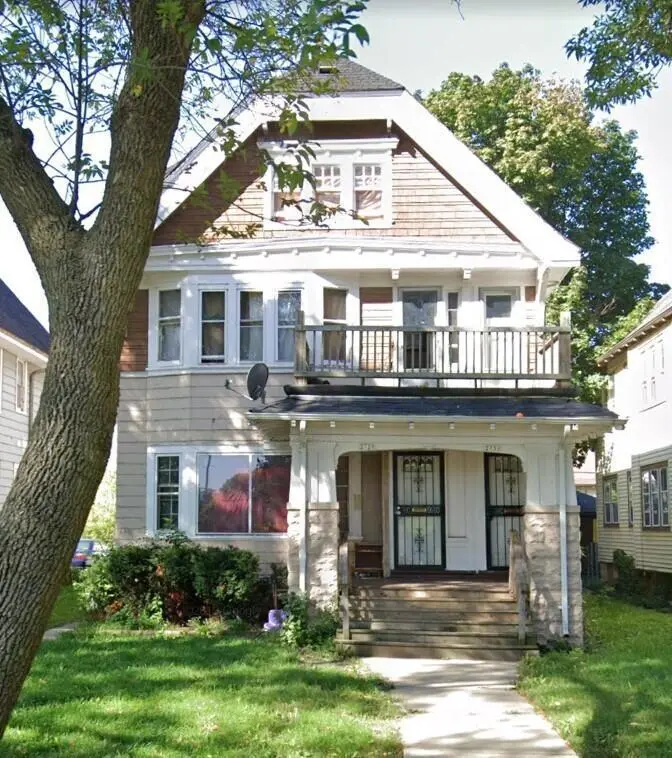
2729 N 36th St · Milwaukee, WI
Flood risk 1/10 · Minimal
- FEMA flood zone
- X (unshaded)
- Chance of flooding over 30 yrs
- 0.0%
- Est. flood insurance / yr
- $473 – $860
Fire risk 1/10 · Minimal
- Est. fire insurance / yr
- $636 – $1,182
Heat risk 2/10 · Minimal
- Hot days now (above 98°F)
- 7 days/yr
- Hot days in 30 yrs
- 13 days/yr
Wind risk 2/10 · Minimal
- Chance of severe wind over 30 yrs
- —
Air-quality risk 2/10 · Minimal
- Unhealthy air days now
- 2 days/yr
- Unhealthy air days in 30 yrs
- 2 days/yr
Risk factors via First Street. Map © Google.
Why this score? — see what drove the B- grade
The composite is a weighted blend of 9 inputs, each scored 0–100. Each bar is that input's sub-score; the figure is the points it added to the 100-point composite (weight × sub-score).
- Cash flow +30.0/30.0
- 1% rule +10.0/10.0
- DSCR +10.0/10.0
- ARV discount +7.5/15.0
- Livability +4.0/5.0
- Rent growth +3.5/5.0
- Condition / age +2.2/5.0
- Schools +1.2/10.0
- Appreciation +0.0/10.0
$185,000
🖨 Deal sheet 📄 Offer letter ✓ Due diligence
Multi-family units
County records classify this as Multi-Family (5+ Unit). Listing-text estimate: 3 units. estimate disagrees with records
5+ unit building — per-unit beds/baths from public records are typically unavailable; the breakdown below (if shown) is an estimate from the listing text.
Listing remarks
Triplex ready for a new owner. Currently rented at $2,675 per month. Two units have recent updates. Add this one to your portfolio.
Key facts
- 4,791 sq ft lot
- Built 1915
- Listed 14 days
Property features AI
Finance
- Other: Inclusions: three fridges, three stoves; Exclusions: tenants' personal property; Property located in the City of Milwaukee
Exterior
- Parking: Outdoor parking; Indoor parking; Outside parking spaces
- Utilities: Municipal water; Municipal sewer
- Home design: Multi-family property (Duplex+ configuration); 3–4 stories; Zoning: RT2
- Construction: Information source lists year built from assessor/public record
- Exterior features: Vinyl exterior; Wood exterior; Lot smaller than 1/2 acre
Interior
- Kitchen: Includes three refrigerators; Includes three stoves
- Heating & cooling: Individual heating units; Natural gas heat
- Interior features: Full basement; Three-unit building
Neighborhood map
What this means for you Summary
Snapshot
- This is a 3 × 2-bed/1.0-bath units multifamily listed at $185k. Condition is rated fair.
Deal economics
- At list price, monthly cash flow is $1k ($14k/yr) — positive. Per door: $380/mo.
- The deal already cash-flows at list — no discount required.
- Meets the 1% rule at list price ($3k rent vs $185k).
- Cap rate 13.7% vs local median 5.1% in Milwaukee — top-decile yield for the area; either an underpriced asset or a hidden risk that comps aren't pricing in. Stress-test before assuming the spread holds.
Location & tenants
- Location reads 81/100 on livability (#55 in WI, #1,534 nationally) — a professional / high-income tenant draw. Strengths: amenities A+, commute A+, cost of living A+; Watch: employment D+, schools F, crime F.
- Milwaukee School District (urban): math 10% / reading 18% proficiency, ranked #337 of 342 in WI (top 98%) — low school quality limits family demand, transient renter base, plan for 1-2y turnover; 77% free/reduced lunch — lower-income household profile, screen leases tightly.
- Market conditions: Rents rising (+3.8%/yr); 142 active listings in the ZIP; 40 comparable units currently listed for rent nearby; rentals at typical pace (median 24d on market — plan ~3-4 weeks tenant-placement turnaround); 45% of comp listings sitting > 30 days — soft ceiling on asking rent; 1,017 units permitted in Milwaukee County in 2024 (803 in 5+ unit buildings).
- At $3,062/mo this rent would consume 76% of the median local household income ($48k/yr) (locally 1730% of renters already pay >50% of income on rent) — very limited rent-growth headroom before tenants either downsize or default.
Forward outlook
- Local home prices are declining (-3.0%/yr); year-one equity from $1k of loan paydown is wiped out by about $6k of value loss. Plan a longer hold.
- Milwaukee County population projected at +4% by 2050 — modest demand growth; plan on rents tracking national, not racing it.
- At projected returns (-3.0% appreciation + 3.8% rent growth), your $52k cash investment doubles in ~5 years — after that, you're playing with house money.
Negotiation context
- Only 14 days on market — expect competitive offers; lowballing is unlikely to land.
- 4 sale attempts since 2y ago with the ask held roughly flat each time — persistent listings suggest the price (not the market) is what's stuck; bring a comps-based counter.
Risks & watch-outs
- Watch-outs: built in 1915 — expect roof / HVAC / electrical / plumbing capex.
Questions for the listing agent
- Can we see the unit-by-unit rent roll, current vacancy, and any below-market leases? What's the average tenancy length?
- What capital expenditures (roof, boiler, parking lot, exteriors) have been made in the last 5 years, and what's planned in the next 2?
- Have any recent inspections been done? Can we get a copy of the seller's disclosures and any deferred-maintenance estimates?
- Built in 1915 — when were the roof, HVAC, electrical panel, plumbing, and water heater last replaced?
- Is there a deadline driving the sale (1031 exchange, divorce, estate, relocation)? That informs how much negotiation room exists.
- Schools are F-rated, which usually means shorter tenancies and higher turnover. Who's the typical renter profile here, and what's been the actual vacancy rate?
- Crime grade is F in this area — have there been break-ins, vandalism, or insurance claims at this property in the last 3 years? What carrier currently insures it and at what premium?
- What's the average days-on-market for RENTAL listings here right now (not sales)? A rising rental-DOM trend means longer vacancies and softer asking-rent achievability than the comps imply.
- What's the recent tenant-quality profile in this submarket — average credit score on applications, eviction rate, late-payment / NSF rate, and stable-employment percentage? A property-management company in the area should have these aggregated.
- How much new apartment / multifamily construction is in the pipeline within 1–3 miles? Heavy new supply (>2% of stock underway) typically softens rents 12–24 months out; light construction supports rent growth.
Investment metrics
- 1% rule
- 1.66% ✓
- Cap rate
- 13.69%
- Cash-on-cash
- 26.42%
- DSCR
- 2.18
- GRM
- 5.0
CMA / ARV
No comps found within radius.
Show comp detail 12 sales within ~0.75 mi
| Address | Dist | Beds/Ba | Sqft | Sold | Price | $/sf | Match |
|---|---|---|---|---|---|---|---|
| 2857 N 34th St #2859 | 0.21mi | 6/2.0 | 2,314 | 1mo | $135,000 | $58 | 77 |
| 2631 N 33rd St #2633 | 0.22mi | 4/2.0 | 2,470 | 1mo | $72,500 | $29 | 76 |
| 2873 N 34th St #2875 | 0.23mi | 4/2.0 | 1,888 | 1mo | $108,500 | $57 | 76 |
| 2400 N 35th St #2402 | 0.42mi | 5/2.0 | 1,994 | 1mo | $65,000 | $33 | 67 |
| 3068 N 34th St Unit 3068A | 0.46mi | 5/2.0 | 2,087 | 0mo | $110,000 | $53 | 66 |
| 3233 W Auer Ave | 0.61mi | 4/2.0 | 1,657 | 1mo | $78,500 | $47 | 58 |
| 2972 N 28th St | 0.62mi | 4/2.0 | 1,757 | 0mo | $141,806 | $81 | 58 |
| 2873 N 26th St #2875 | 0.66mi | 6/2.0 | 2,488 | 1mo | $103,000 | $41 | 56 |
| 2200 N 42nd St #2202 | 0.72mi | 6/2.0 | 2,565 | 0mo | $37,000 | $14 | 54 |
| 3127 W Garfield Ave #3129 | 0.72mi | 5/2.0 | 2,332 | 0mo | $130,000 | $56 | 54 |
| 2118 N 38th St #2120 | 0.74mi | 4/2.0 | 2,341 | 0mo | $62,500 | $27 | 53 |
| 2137 N 31st St | 0.75mi | 5/2.0 | 1,919 | 1mo | $138,500 | $72 | 52 |
Match score weights: distance 35% · size 25% · config 20% · recency 20%. Top-matched comps best support the ARV.
Projected returns pro-forma
-3.0% appreciation · 3.82% rent growth · sell at horizon
- IRR
- 21.2%
- Equity multiple
- 1.87×
- Total profit
- $45,253
- Equity at exit
- $27,584
- IRR
- 29.8%
- Equity multiple
- 3.78×
- Total profit
- $143,754
- Equity at exit
- $15,995
Cash invested: $51,800 (down + closing). Projections, not guarantees.
Landlord ↔ Tenant lean methodology
- Overall (STATE)
- 73 Landlord-Friendly
- State Wisconsin
- 73 Landlord-Friendly · R+2
- County
- — inherits STATE
- City
- — inherits STATE
ZIP-level market 53210
- Home prices YoY
- -21.5%
- Rents YoY
- 3.8%
- Active inventory
- 142
- Price-to-rent
- 15.1×
Monthly cashflow live
- Estimated rent
- $3,062 high interval (Pro) →
- Mortgage (P&I)
- −$970
- Tax est. 1.5%
- −$231 /mo · $2,775/yr
- Insurance
- −$77
- HOA
- −$0
- Vacancy / Maint / Mgmt
- −$643
- Net cashflow
- $1,140
Break-even live
3-unit breakdown (identical units grouped — click to expand)
| Units | Beds | Baths | Est. rent |
|---|---|---|---|
| 3× units | 2 | 1 | $3,063 |
| #1 | 2 | 1 | $1,021 |
| #2 | 2 | 1 | $1,021 |
| #3 | 2 | 1 | $1,021 |
| Total (3 units) | $3,062 | ||
UW: 25.0% down · 7.5% · 30yr · 1.5% tax · 5.0% vac · 8.0% maint · 8.0% mgmt
Financing live
Cash to close
- Down payment
- $46,250
- Closing costs
- $5,550
- Reserves months
- —
- Total cash needed
- —
Loan-product check · same deal, 3 products live
Conventional
25% down · 7.5% · 30yr
- Down + closing
- —
- Monthly P&I
- —
- Monthly cashflow
- —
- DSCR
- —
- Eligible?
- —
Personal DTI + credit; lowest rate.
DSCR
20% down · 8.5% · 30yr
- Down + closing
- —
- Monthly P&I
- —
- Monthly cashflow
- —
- DSCR
- —
- Eligible?
- —
No personal income docs; deal must DSCR.
Hard money
10% down · 12.0% · 12mo
- Down + closing
- —
- Monthly P&I
- —
- Monthly cashflow
- —
- DSCR
- —
- Eligible?
- —
Short-term bridge; refi at stabilization.
Rent comps 40 comps
| Address | Beds | Baths | Sqft | Rent | $/sqft | DOM | Units | Dist |
|---|---|---|---|---|---|---|---|---|
| 2776 N 35th St Unit 8 Milwaukee, WI | 1.0 | 1.0 | — | $725 | — | 43d | 1 | 0.11mi |
| 2776 N 35th St Apt 5 Milwaukee, WI | 1.0 | 1.0 | — | $750 | — | 10d | 1 | 0.11mi |
| 2660 N 37th St Milwaukee, WI | 3.0 | 1.0 | — | $1,095 | — | 23d | 1 | 0.11mi |
| 2706 N 39th St Unit 2706 Milwaukee, WI | 2.0 | 1.0 | 866 | $845 | $0.98 | 43d | 1 | 0.16mi |
| 2867 N 37th St #2869 Milwaukee, WI | 2.0 | 1.0 | — | $995 | — | 16d | 1 | 0.16mi |
| 2869 N 37th St Milwaukee, WI | 2.0 | 1.0 | — | $995 | — | 20d | 1 | 0.16mi |
| 2646 N 34th St Unit 2646A Upper Milwaukee, WI | 2.0 | 1.0 | 609 | $895 | $1.47 | 23d | 1 | 0.20mi |
| 2866 N 34th St Unit 2866A Milwaukee, WI | 2.0 | 1.0 | 534 | $895 | $1.68 | 43d | 1 | 0.22mi |
| 2866 N 34th St Unit 2866 Milwaukee, WI | 3.0 | 1.0 | 534 | $1,095 | $2.05 | 4d | 1 | 0.22mi |
| 2767 N 40th St #2769 Milwaukee, WI | 2.0 | 1.0 | — | $1,199 | — | 43d | 1 | 0.24mi |
| 2550 N 36th St Unit 2550A Upper Milwaukee, WI | 2.0 | 1.0 | 711 | $845 | $1.19 | 23d | 1 | 0.25mi |
| 2571 N 34th St Unit 2571A Milwaukee, WI | 2.0 | 1.0 | — | $895 | — | 4d | 1 | 0.25mi |
| 2530 N 37th St Milwaukee, WI | 2.0 | 1.0 | 1037 | $1,000 | $0.96 | 14d | 1 | 0.28mi |
| 3100 W Center St Milwaukee, WI | 3.0 | 2.0 | 1174 | $1,531 | $1.30 | 1d | 1 | 0.29mi |
| 2566 N 40th St Milwaukee, WI | 2.0 | 1.0 | — | $1,100 | — | 43d | 1 | 0.31mi |
| 2512 N 41st St #2514 Milwaukee, WI | 2.0 | 1.0 | 1007 | $1,200 | $1.19 | 43d | 1 | 0.40mi |
| 3109 N 38th St Unit 10 Milwaukee, WI | 1.0 | 1.0 | — | $750 | — | 43d | 1 | 0.46mi |
| 2403-2405 N 39th St Unit 2403 Lower Milwaukee, WI | 3.0 | 1.0 | 1200 | $995 | $0.83 | 10d | 1 | 0.48mi |
| 2403-2405 N 39th St Unit 2405 Upper Milwaukee, WI | 3.0 | 1.0 | 1141 | $995 | $0.87 | 10d | 1 | 0.48mi |
| 2712 N 44th St Unit 2712A Milwaukee, WI | 2.0 | 1.0 | 911 | $995 | $1.09 | 23d | 1 | 0.48mi |
| 2909-2911 N 29th St Unit 2911 Milwaukee, WI | 3.0 | 1.0 | — | $995 | — | 43d | 1 | 0.49mi |
| 3127 N 34th St Milwaukee, WI | 2.0 | 1.0 | 2 | $1,050 | $525.00 | 16d | 1 | 0.49mi |
| 2909 N 29th St Unit 2909 Milwaukee, WI | 2.0 | 1.0 | — | $1,000 | — | 43d | 1 | 0.49mi |
| 2870 N 29th St #2872 Milwaukee, WI | 3.0 | 1.0 | 1300 | $1,250 | $0.96 | 43d | 1 | 0.51mi |
| 2931 W Chambers St Milwaukee, WI | 2.0 | 1.0 | 1400 | $1,050 | $0.75 | 23d | 1 | 0.51mi |
| 2713 N 44th St Milwaukee, WI | 3.0 | 1.0 | 1450 | $1,350 | $0.93 | 43d | 1 | 0.51mi |
| 3124 N 33rd St Milwaukee, WI | 2.0 | 1.0 | 1200 | $1,200 | $1.00 | 43d | 1 | 0.52mi |
| 2663 N 44th St Unit 1 Milwaukee, WI | 2.0 | 1.0 | 900 | $995 | $1.11 | 43d | 1 | 0.52mi |
| 3148 N 39th St Unit 1 Milwaukee, WI | 2.0 | 1.0 | 1000 | $1,100 | $1.10 | 14d | 1 | 0.52mi |
| 3148 N 39th St Milwaukee, WI | 2.0 | 1.0 | 1100 | $1,100 | $1.00 | 43d | 1 | 0.52mi |
| 2607-2609 N 44th St Milwaukee, WI | 3.0 | 1.0 | — | $1,200 | — | 43d | 1 | 0.54mi |
| 2809 W Clarke St Unit 12811 Milwaukee, WI | 3.0 | 1.0 | 1400 | $1,200 | $0.86 | 16d | 1 | 0.55mi |
| 3122 N 42nd St Milwaukee, WI | 3.0 | 1.0 | 1323 | $1,495 | $1.13 | 4d | 1 | 0.57mi |
| 3179 N 39th St Milwaukee, WI | 1.0 | 1.0 | 800 | $850 | $1.06 | 1d | 1 | 0.57mi |
| 3179 N 39th St Unit 3907AUER Milwaukee, WI | 1.0 | 1.0 | 800 | $750 | $0.94 | 2d | 1 | 0.57mi |
| 2769 N 27th St Unit 2 Milwaukee, WI | 2.0 | 1.0 | — | $1,100 | — | 19d | 1 | 0.58mi |
| 2769 N 27th St Unit 1 Milwaukee, WI | 2.0 | 1.0 | — | $1,100 | — | 43d | 1 | 0.58mi |
| 2729 N 27th St Unit 2729 Milwaukee, WI | 2.0 | 1.0 | — | $850 | — | 43d | 1 | 0.58mi |
| 3133 N 42nd St Milwaukee, WI | 3.0 | 1.0 | 1 | $1,300 | $1300.00 | 43d | 1 | 0.59mi |
| 2530 N 28th St Unit 2530 Lower Milwaukee, WI | 2.0 | 1.0 | 764 | $995 | $1.30 | 14d | 1 | 0.60mi |
Listing history 12 events
-
2026-06-18days on market $185,000 Active 14 DOM
-
2026-06-17days on market $185,000 Active 13 DOM
-
2026-06-16days on market $185,000 Active 12 DOM
-
2026-06-15days on market $185,000 Active 11 DOM
-
2026-06-13days on market $185,000 Active 9 DOM
-
2026-06-13days on market $185,000 Active 8 DOM
-
2026-06-09days on market $185,000 Active 5 DOM
-
2026-06-08status $185,000 Active 4 DOM
-
2026-06-08status $185,000 Pending 4 DOM
-
2026-06-07days on market $185,000 Active 4 DOM
-
2026-06-05remarks 131-char remark
-
2026-06-05$185,000 Active 1 DOM
ⓘ Source: listings_history table (triggers on properties + properties_extension) + one-shot
backfill from property_details.listing_events for pre-trigger history.
Climate risk First Street
- Flood 1/10 Low FEMA zone X (unshaded) · 0% chance over 30 yrs
- Wildfire 1/10 Low
- Heat 2/10 Low 7 d/yr ≥98°F today · 13 d/yr by 30 yrs out
- Wind 2/10 Low
- Air quality 2/10 Low 2 unhealthy d/yr today · 2 by 30 yrs out
Nearby sold comps map
Loading sold comps map…
Walkable amenities ~0.75 mi
Loading nearby amenities…
Taxation est. · year 1
- Rental income
- $36,744
- − Mortgage interest
- −$10,363
- − Property taxes
- −$2,775
- − Insurance
- −$925
- − Repairs & maintenance
- −$2,940
- − Management
- −$2,940
- − Depreciation
- −$5,382
- Taxable income
- $11,420
- Est. tax owed @ 24.0%
- −$2,741
- After-tax cash flow
- $10,945/yr
For passive investors: Depreciation is non-cash, so a rental often shows a tax loss while cash-flowing — sheltering income. Rental losses are passive: they offset passive income freely, and up to $25,000/yr can offset ordinary (W-2) income if you actively participate and your MAGI is under $100k (phasing out to $0 by $150k); unused losses carry forward. On sale, claimed depreciation is recaptured at up to 25%, and gains may owe capital-gains tax (a 1031 exchange can defer both). Figures are a year-1 estimate at your 24.0% rate — not tax advice; consult a CPA.
Condition & rehab AI · 3 photos
The property is in fair condition with moderate rehabilitation needs. Repainting the exterior and improving landscaping would significantly enhance its value.
Repairs flagged
- Minor Exterior paint — The exterior shows some discoloration.
- Minor Roof inspection — No major damage is visible, but a thorough inspection is recommended.
Value-add opportunities
- Both Paint exterior — Fresh paint can improve curb appeal and property value.
- Both Landscaping improvements — A well-maintained yard can enhance the property's appeal and value.
- Rental HVAC inspection and maintenance — A functional HVAC system is crucial for tenant satisfaction and rental value.
Renovation cost estimate screening
| Repair item | Severity | Est. cost |
|---|---|---|
| Exterior paint · The exterior shows some discoloration. | Minor | $500–3,000 |
| Roof inspection · No major damage is visible, but a thorough inspection is recommended. | Minor | $500–3,000 |
| Total estimated repair cost · 2 items | $1,000–6,000 |
Value-add ROI direction
- Both Paint exterior — Fresh paint can improve curb appeal and property value. ↑
- Both Landscaping improvements — A well-maintained yard can enhance the property's appeal and value. ↑
- Rental HVAC inspection and maintenance — A functional HVAC system is crucial for tenant satisfaction and rental value. ↑
ⓘ Cost ranges are severity-bucket heuristics (US national rule-of-thumb). Get contractor quotes + a written scope before underwriting a rehab budget.
Schools (NCES district)
- District
- Milwaukee School District
- NCES district ID
- 5509600
- Math proficiency
- 10% ▼ -5.00%
- Reading proficiency
- 18% ▬ 0.00%
- Median HH income
- $36,339
- Composite
- 11.61/100
- National rank
- #9696
- State rank
- #337 of 342 in WI
Livability — Milwaukee
- Score
- 81/100
- State rank
- #55
- US rank
- #1534
Category grades
Schools grade is shown separately in the Schools card above.
Census & demographics
- Census place
- Milwaukee, WI
- County
- Milwaukee County · 926,379 people
- City population
- 573,768
- Metro
- Milwaukee-Waukesha, WI
- Population (ZIP)
- 23,922
- Household income
- $48,217
- Rent vs Own
- Severe rent burden
- 1730.0
Population outlook (Milwaukee County) Hauer SSP2
- Today (2025)
- 995,758 people
- By 2030
- 1,009,124 · +1.3%
- By 2040
- 1,028,128 · +3.3%
- By 2050
- 1,040,066 · +4.4%
- By 2075
- 1,057,849 · +6.2%
- By 2100
- 1,039,774 · +4.4%
Race, ethnicity, and origin ACS 2023
- Neighborhood character
- Predominantly Black (71%)
- Race & ethnicity
- Black 71% White 17% Hispanic / Latino 6% Two or more races 6% Asian 2%
- Hispanic origin (detail)
- Mexican 3% Puerto Rican 1%
- Common ancestry
- Romanian 2% Portuguese 1% Italian 1%
- Foreign-born
- 3% · Canada, Philippines
- Languages at home
- 94% English-only · Spanish 3% Other Asian/Pacific 2%
Political lean MEDSL · Milwaukee
- 2024 margin
- Solid D (+38.5) · D 68.3% · R 29.8% · Other 1.8%
- 2008→2024 swing
- +2.7pp toward D · 2008: 35.9pp · 2024: 38.5pp
- All cycles
- 2024: D+38.5 2020: D+39.9 2016: D+37.5 2012: D+34.6 2008: D+35.9
Not yet ingested
- Civics
- —
Market trends
- HPI YoY
- ▼ -76.77%
- Current HPI
- 280.0133
- Rent YoY
- ▲ 3.82%
- Metro
- Milwaukee-Waukesha, WI
- State GDP YoY
- ▲ 2.10%
- F500 in state
- 20
Industry mix (Fortune 500 HQ in WI)
| Industry | F500 HQs | Revenue |
|---|---|---|
| Industrial Machinery | 4 | $23B |
|
||
| Industrial Technology | 2 | $36B |
|
||
| Insurance | 1 | $36B |
|
||
| Professional Services | 1 | $19B |
|
||
| Utilities | 1 | $9B |
|
||
| Consumer Goods | 1 | $3B |
|
||
Price history
7 events — show timeline
- 2026-06-03 Listed $185,000 METROMLS
- 2024-05-18 Rental Removed $945 APPFOLIO
- 2024-05-09 Listed for Rent $945 APPFOLIO
- 2024-04-18 Rental Removed $995 APPFOLIO
- 2024-04-12 Listed for Rent $995 APPFOLIO
- 2024-04-10 Rental Removed $995 APPFOLIO
- 2024-04-05 Listed for Rent $995 APPFOLIO
Cash-flow waterfall
monthlySold comps — $/sqft
last 12 mo · ≤1 miLoading sold comps…