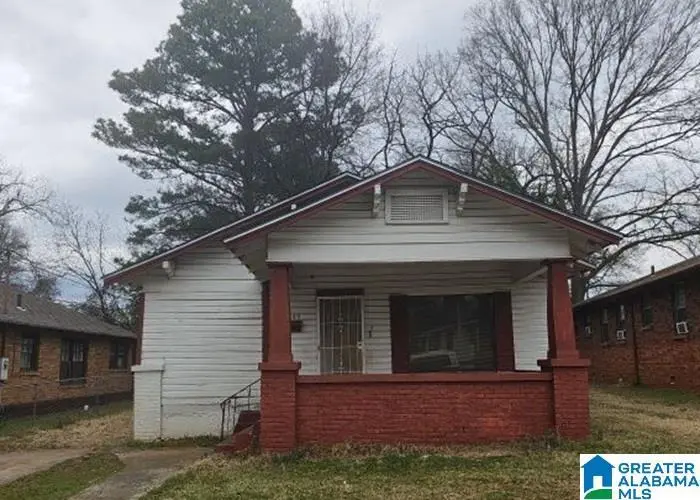
1249 14th Pl SW · Birmingham, AL
Flood risk 1/10 · Minimal
- FEMA flood zone
- X (unshaded)
- Chance of flooding over 30 yrs
- 0.0%
- Est. flood insurance / yr
- $507 – $1,088
Fire risk 2/10 · Minimal
- Est. fire insurance / yr
- $916 – $1,700
Heat risk 7/10 · Major
- Hot days now (above 106°F)
- 7 days/yr
- Hot days in 30 yrs
- 19 days/yr
Wind risk 6/10 · Moderate
- Chance of severe wind over 30 yrs
- 27.0%
Air-quality risk 4/10 · Minor
- Unhealthy air days now
- 6 days/yr
- Unhealthy air days in 30 yrs
- 8 days/yr
Risk factors via First Street. Map © Google.
Why this score? — see what drove the B- grade
The composite is a weighted blend of 9 inputs, each scored 0–100. Each bar is that input's sub-score; the figure is the points it added to the 100-point composite (weight × sub-score).
- Cash flow +30.0/30.0
- 1% rule +10.0/10.0
- DSCR +10.0/10.0
- ARV discount +7.5/15.0
- Livability +3.4/5.0
- Rent growth +2.5/5.0
- Condition / age +2.5/5.0
- Schools +0.9/10.0
- Appreciation +0.0/10.0
$35,000
🖨 Deal sheet 📄 Offer letter ✓ Due diligence
Listing remarks MLS
Discover this charming three-bedroom, one-bath home conveniently located near the desirable Green Springs area of Birmingham. Enjoy relaxing mornings on the spacious covered front porch and take advantage of the generously sized backyard—perfect for entertaining, gardening, or pets. Inside, you’ll find thoughtful updates completed over the years, including refreshed kitchen cabinets and countertops, along with a modern electrical breaker panel for added peace of mind. Don’t miss your opportunity to see this inviting home—schedule your private showing today before it’s gone!
Key facts
- Solid foundation
- 6,969 sq ft lot
- Built 1930
Tags
Neighborhood map
What this means for you Summary
Snapshot
- This is a 3-bed/1.0-bath single-family listed at $35k.
Deal economics
- At list price, monthly cash flow is $717 ($9k/yr) — positive.
- The deal already cash-flows at list — no discount required.
- Meets the 1% rule at list price ($1k rent vs $35k).
- Cap rate 30.9% vs local median 6.2% in Birmingham — top-decile yield for the area; either an underpriced asset or a hidden risk that comps aren't pricing in. Stress-test before assuming the spread holds.
Location & tenants
- Location reads 67/100 on livability (#78 in AL) — a middle-class / working-renter tenant base. Strengths: commute A+, cost of living A+, housing A+; Watch: amenities C-, schools F, crime F.
- Birmingham City (urban): math 4% / reading 20% proficiency, ranked #116 of 129 in AL (top 90%) — low school quality limits family demand, transient renter base, plan for 1-2y turnover; 82% free/reduced lunch — lower-income household profile, screen leases tightly.
- Market conditions: Rents soft (-0.0%/yr); 152 active listings in the ZIP; 40 comparable units currently listed for rent nearby; rentals at typical pace (median 24d on market — plan ~3-4 weeks tenant-placement turnaround); 48% of comp listings sitting > 30 days — soft ceiling on asking rent; lower-income renter base — watch delinquency; 2,114 units permitted in Jefferson County in 2024 (556 in 5+ unit buildings).
- This rent runs 42% of the median local income ($35k/yr) — at the standard rent-burdened threshold; future hikes will face affordability resistance.
Forward outlook
- Local home prices are declining (-3.0%/yr); year-one equity from $242 of loan paydown is wiped out by about $1k of value loss. Plan a longer hold.
- Jefferson County population projected to shrink 4% by 2050 — rents likely to lag national; underwrite the cash flow, not the appreciation.
- At projected returns (-3.0% appreciation + 0.0% rent growth), your $10k cash investment doubles in ~2 years — after that, you're playing with house money.
Negotiation context
- Only 5 days on market — expect competitive offers; lowballing is unlikely to land.
- Current owner paid $20k; list at $35k implies a 75% gain — meaningful room to come down on a strong offer.
Risks & watch-outs
- Watch-outs: built in 1930 — expect roof / HVAC / electrical / plumbing capex.
- Climate carrying-cost: major wind risk, 27% chance of damaging wind over 30y; extreme-heat days projected 7→19/yr by 2055 (HVAC capex compounding) — expect insurance premiums to compound above CPI over the hold.
Questions for the listing agent
- Built in 1930 — when were the roof, HVAC, electrical panel, plumbing, and water heater last replaced?
- Is there a deadline driving the sale (1031 exchange, divorce, estate, relocation)? That informs how much negotiation room exists.
- Schools are F-rated, which usually means shorter tenancies and higher turnover. Who's the typical renter profile here, and what's been the actual vacancy rate?
- Crime grade is F in this area — have there been break-ins, vandalism, or insurance claims at this property in the last 3 years? What carrier currently insures it and at what premium?
- What's the average days-on-market for RENTAL listings here right now (not sales)? A rising rental-DOM trend means longer vacancies and softer asking-rent achievability than the comps imply.
- What's the recent tenant-quality profile in this submarket — average credit score on applications, eviction rate, late-payment / NSF rate, and stable-employment percentage? A property-management company in the area should have these aggregated.
- How much new for-sale + rental construction is in the pipeline within 1–3 miles? Heavy new supply typically softens prices + rents 12–24 months out; constrained supply supports both.
Investment metrics
- 1% rule
- 3.49% ✓
- Cap rate
- 30.89%
- Cash-on-cash
- 87.85%
- DSCR
- 4.91
- GRM
- 2.4
CMA / ARV
- ARV (median comp)
- $70,658
- List price
- $35,000
- Delta
- -52.45%
- Verdict
- UNDERPRICED
- Comps
- 20 within 1.0 mi
Show comp detail 12 sales within ~0.75 mi
| Address | Dist | Beds/Ba | Sqft | Sold | Price | $/sf | Match |
|---|---|---|---|---|---|---|---|
| 1245 15th St SW | 0.07mi | 3/1.0 | 1,002 (-15%) | 6mo | $12,500 | $12 | 68 |
| 600 Pride Way SW | 0.67mi | 3/1.0 | 1,191 (+1%) | 6mo | $80,000 | $67 | 62 |
| 1245 16th St SW | 0.27mi | 3/2.0 | 1,336 (+14%) | 5mo | $145,000 | $109 | 57 |
| 809 11th St SW | 0.67mi | 2/1.0 (-1) | 1,113 (-5%) | 0mo | $7,500 | $7 | 54 |
| 1527 14th St | 0.56mi | 3/2.0 | 1,088 (-8%) | 5mo | $105,000 | $97 | 53 |
| 1557 Pearson Ave SW | 0.56mi | 3/2.0 | 1,168 (-1%) | 21mo | $33,200 | $28 | 52 |
| 1257 16th Pl SW | 0.35mi | 3/1.0 | 1,036 (-12%) | 15mo | $40,000 | $39 | 51 |
| 529 15th Pl SW | 0.75mi | 3/1.0 | 1,178 (+0%) | 16mo | $46,000 | $39 | 51 |
| 1609 SW Jefferson Ave | 0.45mi | 3/1.0 | 1,302 (+11%) | 13mo | $61,000 | $47 | 50 |
| 232 11th Ave SW | 0.74mi | 3/1.0 | 1,192 (+1%) | 17mo | $90,000 | $76 | 49 |
| 1501 Princeton Ave SW | 0.70mi | 3/2.0 | 1,260 (+7%) | 14mo | $129,900 | $103 | 40 |
| 1516 16th Way SW | 0.72mi | 3/1.0 | 1,038 (-12%) | 9mo | $125,000 | $120 | 39 |
Match score weights: distance 35% · size 25% · config 20% · recency 20%. Top-matched comps best support the ARV.
Projected returns pro-forma
-3.0% appreciation · 0.0% rent growth · sell at horizon
- IRR
- 85.0%
- Equity multiple
- 4.72×
- Total profit
- $36,460
- Equity at exit
- $5,219
- IRR
- 87.5%
- Equity multiple
- 8.84×
- Total profit
- $76,827
- Equity at exit
- $3,026
Cash invested: $9,800 (down + closing). Projections, not guarantees.
Landlord ↔ Tenant lean methodology
- Overall (STATE)
- 90 Strongly Landlord-Friendly
- State Alabama
- 90 Strongly Landlord-Friendly · R+15
- County
- — inherits STATE
- City
- — inherits STATE
ZIP-level market 35211
- Rents YoY
- -0.0%
- Active inventory
- 152
- Price-to-rent
- 2.4×
Monthly cashflow live
- Estimated rent
- $1,223 high interval (Pro) →
- Mortgage (P&I)
- −$184
- Tax from tax record
- −$51 /mo · $608/yr
- Insurance
- −$15
- HOA
- −$0
- Vacancy / Maint / Mgmt
- −$257
- Net cashflow
- $717
Break-even live
UW: 25.0% down · 7.5% · 30yr · 1.5% tax · 5.0% vac · 8.0% maint · 8.0% mgmt
Financing live
Cash to close
- Down payment
- $8,750
- Closing costs
- $1,050
- Reserves months
- —
- Total cash needed
- —
Loan-product check · same deal, 3 products live
Conventional
25% down · 7.5% · 30yr
- Down + closing
- —
- Monthly P&I
- —
- Monthly cashflow
- —
- DSCR
- —
- Eligible?
- —
Personal DTI + credit; lowest rate.
DSCR
20% down · 8.5% · 30yr
- Down + closing
- —
- Monthly P&I
- —
- Monthly cashflow
- —
- DSCR
- —
- Eligible?
- —
No personal income docs; deal must DSCR.
Hard money
10% down · 12.0% · 12mo
- Down + closing
- —
- Monthly P&I
- —
- Monthly cashflow
- —
- DSCR
- —
- Eligible?
- —
Short-term bridge; refi at stabilization.
Rent comps 40 comps
| Address | Beds | Baths | Sqft | Rent | $/sqft | DOM | Units | Dist |
|---|---|---|---|---|---|---|---|---|
| 1256 15th St SW Birmingham, AL | 3.0 | 1.0 | 1206 | $1,300 | $1.08 | 3d | 1 | 0.09mi |
| 1332 15th Pl SW Birmingham, AL | 2.0 | 1.0 | 1115 | $950 | $0.85 | 3d | 1 | 0.17mi |
| 1508 Dennison Ave SW Birmingham, AL | 2.0 | 1.0 | 924 | $890 | $0.96 | 43d | 1 | 0.22mi |
| 1233 15th Way SW Birmingham, AL | 3.0 | 1.0 | 1119 | $1,050 | $0.94 | 43d | 1 | 0.22mi |
| 1136 15th St SW Birmingham, AL | 4.0 | 2.0 | 1296 | $1,395 | $1.08 | 23d | 1 | 0.24mi |
| 916 14th St SW Unit A Birmingham, AL | 2.0 | 1.0 | 870 | $800 | $0.92 | 23d | 1 | 0.43mi |
| 916 14th St SW Unit F Birmingham, AL | 2.0 | 1.0 | 870 | $800 | $0.92 | 43d | 1 | 0.43mi |
| 916 14th St SW Unit F Birmingham, AL | 2.0 | 1.0 | 800 | $800 | $1.00 | 11d | 1 | 0.43mi |
| 1620 Alemeda Ave SW Birmingham, AL | 3.0 | 2.0 | 1314 | $1,295 | $0.99 | 2d | 1 | 0.46mi |
| 1100 Cotton Ave SW Unit b Birmingham, AL | 2.0 | 1.5 | 816 | $988 | $1.21 | 43d | 1 | 0.72mi |
| 1000 17th Pl SW Birmingham, AL | 3.0 | 2.0 | 1200 | $1,275 | $1.06 | 19d | 1 | 0.73mi |
| 1501 Princeton Ave SW Birmingham, AL | 3.0 | 2.0 | 1260 | $1,350 | $1.07 | 44d | 1 | 0.74mi |
| 1012 Cotton Ave SW Birmingham, AL | 3.0 | 1.0 | 1232 | $1,000 | $0.81 | 43d | 1 | 0.75mi |
| 521 16th St SW Unit 523 Birmingham, AL | 2.0 | 1.0 | 800 | $800 | $1.00 | 43d | 1 | 0.81mi |
| 1217 Fulton Ave SW Birmingham, AL | 4.0 | 2.0 | 1397 | $1,395 | $1.00 | 43d | 1 | 0.86mi |
| 1228 Fulton Ave SW Birmingham, AL | 2.0 | 1.0 | 900 | $800 | $0.89 | 44d | 1 | 0.88mi |
| 261 3rd Ave SW Birmingham, AL | 1.0–2.0 | 1.0 | 634 | $850 | $1.34 | 3d | 14 | 0.89mi |
| 1734 Lee Ave SW Birmingham, AL | 4.0 | 1.0 | 1142 | $1,150 | $1.01 | 19d | 1 | 0.92mi |
| 856 Center Way SW Birmingham, AL | 3.0 | 2.0 | 1142 | $1,200 | $1.05 | 43d | 1 | 0.95mi |
| 1728 Princeton Ave SW Birmingham, AL | 4.0 | 2.0 | 1334 | $1,300 | $0.97 | 43d | 1 | 0.96mi |
| 1220 Alabama Ave SW Birmingham, AL | 3.0 | 1.5 | 1175 | $1,350 | $1.15 | 43d | 1 | 0.97mi |
| 405 11th St SW Unit B Birmingham, AL | 2.0 | 1.0 | 1065 | $800 | $0.75 | 43d | 1 | 0.99mi |
| 1437 Woodland Ave SW Birmingham, AL | 3.0 | 1.0 | 1369 | $1,100 | $0.80 | 3d | 1 | 1.00mi |
| 1645 Woodland Ave SW Birmingham, AL | 4.0 | 2.0 | 1298 | $1,300 | $1.00 | 19d | 1 | 1.04mi |
| 401 Skyview Dr Birmingham, AL | 2.0 | 1.0 | 864 | $950 | $1.10 | 43d | 1 | 1.06mi |
| 741 Center Pl SW Birmingham, AL | 3.0 | 1.0 | 1101 | $1,250 | $1.14 | 16d | 1 | 1.06mi |
| 1816 Saint Charles Ave SW Birmingham, AL | 3.0 | 1.0 | 1395 | $1,295 | $0.93 | 23d | 1 | 1.07mi |
| 218 Olympia Dr Homewood, AL | 1.0–3.0 | 1.0–2.5 | 958 | $1,659 | $1.73 | 1d | 33 | 1.10mi |
| 1800 Woodland Ave SW Birmingham, AL | 4.0 | 1.0 | 1411 | $1,195 | $0.85 | 2d | 1 | 1.13mi |
| 1252 18th Pl SW Birmingham, AL | 3.0 | 1.0 | 950 | $1,000 | $1.05 | 16d | 1 | 1.13mi |
| 1520 17th Way SW Birmingham, AL | 3.0 | 1.0 | 900 | $900 | $1.00 | 11d | 1 | 1.14mi |
| 1520 17th Way SW Birmingham, AL | 3.0 | 1.0 | 900 | $900 | $1.00 | 21d | 1 | 1.14mi |
| 719 Washington Ave SW Birmingham, AL | 3.0 | 1.0 | 1064 | $950 | $0.89 | 11d | 1 | 1.17mi |
| 12 4th Ave SW Unit 1 Birmingham, AL | 3.0 | 1.0 | 1336 | $1,100 | $0.82 | 43d | 1 | 1.18mi |
| 132 17th St SW Birmingham, AL | 2.0 | 1.0 | 738 | $945 | $1.28 | 43d | 1 | 1.18mi |
| 1319 18th Way SW Birmingham, AL | 4.0 | 2.0 | 1337 | $1,345 | $1.01 | 23d | 1 | 1.19mi |
| 1537 18th St SW Birmingham, AL | 3.0 | 1.0 | 1049 | $1,130 | $1.08 | 43d | 1 | 1.25mi |
| 644 Alabama Ave SW Birmingham, AL | 3.0 | 1.0 | 1274 | $1,125 | $0.88 | 23d | 1 | 1.27mi |
| 1209 19th Pl SW Birmingham, AL | 3.0 | 1.0 | 1050 | $1,275 | $1.21 | 43d | 1 | 1.28mi |
| 1544 18th St SW Birmingham, AL | 3.0 | 1.0 | 950 | $1,130 | $1.19 | 43d | 1 | 1.29mi |
Listing history 9 events
-
2026-06-07status $35,000 Pending 5 DOM
-
2026-06-03days on market $35,000 Active 5 DOM
-
2026-06-02days on market $35,000 Active 4 DOM
-
2026-06-01days on market $35,000 Active 3 DOM
-
2026-05-31days on market $35,000 Active 2 DOM
-
2026-05-02price $33,600 610-char remark
Show marketing remark (610 chars)
Discover this charming three-bedroom, one-bath home conveniently located near the desirable Green Springs area of Birmingham. Enjoy relaxing mornings on the spacious covered front porch and take advantage of the generously sized backyard—perfect for entertaining, gardening, or pets. Inside, you’ll find thoughtful updates completed over the years, including refreshed kitchen cabinets and countertops, along with a modern electrical breaker panel for added peace of mind. Don’t miss your opportunity to see this inviting home—schedule your private showing today before it’s gone!
-
2026-04-02price $35,300 610-char remark
Show marketing remark (610 chars)
Discover this charming three-bedroom, one-bath home conveniently located near the desirable Green Springs area of Birmingham. Enjoy relaxing mornings on the spacious covered front porch and take advantage of the generously sized backyard—perfect for entertaining, gardening, or pets. Inside, you’ll find thoughtful updates completed over the years, including refreshed kitchen cabinets and countertops, along with a modern electrical breaker panel for added peace of mind. Don’t miss your opportunity to see this inviting home—schedule your private showing today before it’s gone!
-
2026-03-03$37,100 Active 610-char remark
Show marketing remark (610 chars)
Discover this charming three-bedroom, one-bath home conveniently located near the desirable Green Springs area of Birmingham. Enjoy relaxing mornings on the spacious covered front porch and take advantage of the generously sized backyard—perfect for entertaining, gardening, or pets. Inside, you’ll find thoughtful updates completed over the years, including refreshed kitchen cabinets and countertops, along with a modern electrical breaker panel for added peace of mind. Don’t miss your opportunity to see this inviting home—schedule your private showing today before it’s gone!
-
1989-12-12soldstatus $20,000
ⓘ Source: listings_history table (triggers on properties + properties_extension) + one-shot
backfill from property_details.listing_events for pre-trigger history.
Tax reassessment forecast AL · Resets to sale price
- Current annual tax
- $608 · $51/mo
- Projected year-2 tax
- $608 · $51/mo
- Expected delta
- $0/yr ($0/mo · 0.0%)
ⓘ Screening estimate from a state-policy table — verify with the county assessor before closing.
Climate risk First Street
- Flood 1/10 Low FEMA zone X (unshaded) · 0% chance over 30 yrs
- Wildfire 2/10 Low
- Heat 7/10 Severe 7 d/yr ≥106°F today · 19 d/yr by 30 yrs out
- Wind 6/10 Major 27% chance of damaging wind over 30 yrs
- Air quality 4/10 Moderate 6 unhealthy d/yr today · 8 by 30 yrs out
Nearby sold comps map
Loading sold comps map…
Walkable amenities ~0.75 mi
Loading nearby amenities…
Taxation est. · year 1
- Rental income
- $14,676
- − Mortgage interest
- −$1,961
- − Property taxes
- −$608
- − Insurance
- −$175
- − Repairs & maintenance
- −$1,174
- − Management
- −$1,174
- − Depreciation
- −$1,018
- Taxable income
- $8,567
- Est. tax owed @ 24.0%
- −$2,056
- After-tax cash flow
- $6,553/yr
For passive investors: Depreciation is non-cash, so a rental often shows a tax loss while cash-flowing — sheltering income. Rental losses are passive: they offset passive income freely, and up to $25,000/yr can offset ordinary (W-2) income if you actively participate and your MAGI is under $100k (phasing out to $0 by $150k); unused losses carry forward. On sale, claimed depreciation is recaptured at up to 25%, and gains may owe capital-gains tax (a 1031 exchange can defer both). Figures are a year-1 estimate at your 24.0% rate — not tax advice; consult a CPA.
Schools (NCES district)
- District
- Birmingham City
- NCES district ID
- 0100390
- Math proficiency
- 4% ▼ -17.00%
- Reading proficiency
- 20% ▼ -4.00%
- Median HH income
- $31,988
- Composite
- 9.49/100
- National rank
- #9850
- State rank
- #116 of 129 in AL
Livability — Birmingham
- Score
- 67/100
- State rank
- #78
- US rank
- #10412
Category grades
Schools grade is shown separately in the Schools card above.
Census & demographics
- Census place
- Birmingham, AL
- County
- Jefferson County · 527,445 people
- City population
- 210,422
- Metro
- Birmingham-Hoover, AL
- Population (ZIP)
- 24,924
- Household income
- $34,884
- Rent vs Own
- Severe rent burden
- 2161.0
Population outlook (Jefferson County) Hauer SSP2
- Today (2025)
- 669,185 people
- By 2030
- 669,694 · +0.1%
- By 2040
- 661,388 · -1.2%
- By 2050
- 643,086 · -3.9%
- By 2075
- 577,267 · -13.7%
- By 2100
- 474,758 · -29.1%
Race, ethnicity, and origin ACS 2023
- Neighborhood character
- Predominantly Black (77%)
- Race & ethnicity
- Black 77% White 10% Hispanic / Latino 10% Two or more races 4%
- Hispanic origin (detail)
- Mexican 7%
- Foreign-born
- 6% · Canada
- Languages at home
- 91% English-only · Spanish 8% French/Haitian/Cajun 1%
Political lean MEDSL · Jefferson
- 2024 margin
- D (+10.4) · D 54.6% · R 44.2% · Other 1.2%
- 2008→2024 swing
- +5.4pp toward D · 2008: 5.1pp · 2024: 10.4pp
- All cycles
- 2024: D+10.4 2020: D+13.2 2016: D+7.2 2012: D+6.0 2008: D+5.1
Not yet ingested
- Civics
- —
Market trends
- HPI YoY
- ▼ -49.29%
- Current HPI
- 91.2903
- Rent YoY
- ▬ -0.01%
- Metro
- Birmingham-Hoover, AL
- State GDP YoY
- ▲ 2.94%
- F500 in state
- 4
Industry mix (Fortune 500 HQ in AL)
| Industry | F500 HQs | Revenue |
|---|---|---|
| Financial Services | 1 | $8B |
|
||
| Healthcare | 1 | $5B |
|
||
Price history
+68.0% since first listed4 events — show timeline
- 2026-05-02 Price Changed $33,600 Greater Alabama MLS
- 2026-04-02 Price Changed $35,300 Greater Alabama MLS
- 2026-03-03 Listed $37,100 Greater Alabama MLS
- 1989-12-12 Sold (Public Records) $20,000 Public Records
Property tax history
+12.4%/yrLatest (2025): $608 · -27.9% YoY. Source: county tax records.
Cash-flow waterfall
monthlySold comps — $/sqft
last 12 mo · ≤1 miLoading sold comps…