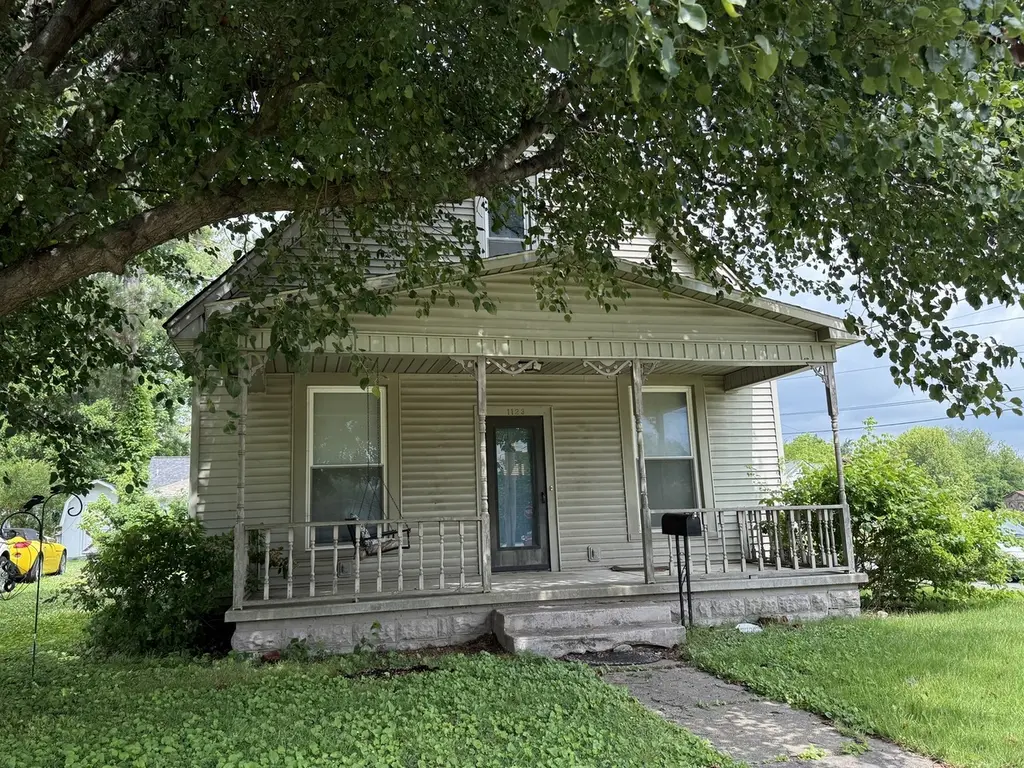
1123 Metropolis St · Metropolis, IL
Flood risk 1/10 · Minimal
- FEMA flood zone
- X
- Chance of flooding over 30 yrs
- 0.0%
- Est. flood insurance / yr
- $507 – $1,088
Fire risk 3/10 · Minor
- Est. fire insurance / yr
- $804 – $1,492
Heat risk 6/10 · Moderate
- Hot days now (above 109°F)
- 7 days/yr
- Hot days in 30 yrs
- 20 days/yr
Wind risk 3/10 · Minor
- Chance of severe wind over 30 yrs
- 6.0%
Air-quality risk 2/10 · Minimal
- Unhealthy air days now
- 1 days/yr
- Unhealthy air days in 30 yrs
- 2 days/yr
Risk factors via First Street. Map © Google.
Why this score? — see what drove the D grade
The composite is a weighted blend of 9 inputs, each scored 0–100. Each bar is that input's sub-score; the figure is the points it added to the 100-point composite (weight × sub-score).
- Cash flow +17.0/30.0
- ARV discount +7.5/15.0
- DSCR +5.3/10.0
- Livability +3.8/5.0
- 1% rule +3.4/10.0
- Rent growth +2.5/5.0
- Condition / age +2.5/5.0
- Schools +2.2/10.0
- Appreciation +0.0/10.0
$125,000
🖨 Deal sheet (PDF) 📄 Offer letter ✓ Due diligence
Listing remarks
Charming 3-bedroom, 1-bath home situated on a corner lot in Metropolis with excellent curb appeal, a welcoming covered front porch, attached carport, and a large storage shed/workshop offering plenty of space for hobbies or extra storage. This property is currently under renovation and priced based on the completed project, but the seller is also willing to sell now at an "as is, where is" price, creating a great opportunity for investors or buyers looking to add their own finishing touches. Planned updates include a new roof, new HVAC system, updated kitchen with new appliances, remodeled bathroom, new flooring, and fresh paint throughout. Seller is willing to accept a sale contr
Key facts
- Covered front porch
- Attached carport
- Corner lot
Tags
Property features AI
Finance
- Financial info: Special service area: No
- HOA & community: No master association fee required
Exterior
- Parking: Two parking spaces; Concrete parking surface
- Utilities: Public water; Public sewer; 100-amp electric service
- Home design: Detached single-family home; 1.5-story design; Approximately 1,106 total finished square feet; Main level approx. 806 sq ft; Upper level approx. 300 sq ft; Rehab planned/completed in 2026; Built more than 100 years ago; Property faces unspecified direction
- Construction: Vinyl siding; Asphalt roof; Crawl space foundation; Built before 1978
- Exterior features: Corner lot (50 x 120)
Interior
- Kitchen: Eating area / table space
- Bedrooms: Master bedroom on main level (11 x 12); Two additional bedrooms on second level (each 9 x 10)
- Flooring: Luxury vinyl flooring throughout main living areas and bedrooms
- Bathrooms: One full bathroom
- Heating & cooling: Natural gas heating; Central air conditioning
- Interior features: Finished attic with interior stair; Separate dining room; 1st-floor full bath; Six total rooms
- Laundry & utility: Main-level laundry (7 x 9)
Neighborhood map
What this means for you Summary
Snapshot
- This is a 3-bed/1.0-bath single-family listed at $125k.
Deal economics
- At list price, monthly cash flow is $86 ($1k/yr) — positive.
- The deal already cash-flows at list — no discount required.
- To meet the 1% rule (rent ≥ 1% of price), the offer needs to be $105k (15.6% below list).
- Recommended offer: $105k (15.6% below list) — sets the bar for 1% rule.
- Cap rate 7.1% vs local median 5.3% in Metropolis — top-decile yield for the area; either an underpriced asset or a hidden risk that comps aren't pricing in. Stress-test before assuming the spread holds.
Location & tenants
- Location reads 75/100 on livability (#217 in IL, #4,091 nationally) — a middle-class / working-renter tenant base. Strengths: cost of living A+, housing A+, health & safety A+; Watch: commute F, employment D-.
- Massac UD 1 (rural): math 24% / reading 28% proficiency, ranked #318 of 620 in IL (top 51%) — low school quality limits family demand, transient renter base, plan for 1-2y turnover.
- Zoned schools: Metropolis Elem School (math 11% / reading 15%, grade F, #1,362 of 2,056 statewide, top 66%, 484 students, 0% FRL); Massac Jr High School (math 25% / reading 36%, grade F, #241 of 665 statewide, top 37%, 244 students, 0% FRL); Massac County High School (math 12% / reading 27%, grade F, #397 of 693 statewide, top 61%, 583 students, 0% FRL) — zoned schools average 0% FRL vs 52% district-wide (52 pts lower); this property's tenant base skews higher-income than the district average.
- Market conditions: 72 active listings in the ZIP; 5 units permitted in Massac County in 2024 (0 in 5+ unit buildings).
Forward outlook
- Local home prices are declining (-3.0%/yr); year-one equity from $864 of loan paydown is wiped out by about $4k of value loss. Plan a longer hold.
- Massac County population projected at -28% by 2050 — secular population decline; favor cash flow + early exit over multi-decade hold.
Negotiation context
- It's been on market 25 days — a 2% lower offer ($123k) is reasonable based on typical stale-listing flexibility.
- Current owner paid $50k; list at $125k implies a 150% gain — meaningful room to come down on a strong offer.
Risks & watch-outs
- Watch-outs: built in 1923 — expect roof / HVAC / electrical / plumbing capex.
- Climate carrying-cost: extreme-heat days projected 7→20/yr by 2055 (HVAC capex compounding) — expect insurance premiums to compound above CPI over the hold.
Questions for the listing agent
- Built in 1923 — when were the roof, HVAC, electrical panel, plumbing, and water heater last replaced?
- Is there a deadline driving the sale (1031 exchange, divorce, estate, relocation)? That informs how much negotiation room exists.
- Schools are D-rated, which usually means shorter tenancies and higher turnover. Who's the typical renter profile here, and what's been the actual vacancy rate?
- The area grade is low — what's the realistic commute time and amenity access for the typical tenant pool here? Any planned neighborhood developments (good or bad) we should know about?
- What's the average days-on-market for RENTAL listings here right now (not sales)? A rising rental-DOM trend means longer vacancies and softer asking-rent achievability than the comps imply.
- What's the recent tenant-quality profile in this submarket — average credit score on applications, eviction rate, late-payment / NSF rate, and stable-employment percentage? A property-management company in the area should have these aggregated.
- How much new for-sale + rental construction is in the pipeline within 1–3 miles? Heavy new supply typically softens prices + rents 12–24 months out; constrained supply supports both.
Investment metrics
- 1% rule
- 0.84% ✗
- Cap rate
- 7.11%
- Cash-on-cash
- 2.93%
- DSCR
- 1.13
- GRM
- 9.9
CMA / ARV
- ARV (on-the-fly)
- $69,678
- Comps found
- 12
Show comp detail 12 sales within ~0.75 mi
| Address | Dist | Beds/Ba | Sqft | Sold | Price | $/sf | Match |
|---|---|---|---|---|---|---|---|
| 1120 Girard St | 0.12mi | 2/1.0 (-1) | 1,147 (+4%) | 0mo | $60,000 | $52 | 83 |
| 307 E 8th St | 0.31mi | 3/1.5 | 1,125 (+2%) | 0mo | $70,500 | $63 | 80 |
| 1806 Market St | 0.35mi | 3/1.0 | 1,094 (-1%) | 2mo | $94,500 | $86 | 80 |
| 1018 Girard St | 0.14mi | 3/1.0 | 1,197 (+8%) | 0mo | $19,000 | $16 | 80 |
| 1302 Catherine St | 0.19mi | 2/1.0 (-1) | 1,064 (-4%) | 7mo | $93,900 | $88 | 74 |
| 404 E 7th St | 0.43mi | 3/1.0 | 1,088 (-2%) | 7mo | $37,500 | $34 | 72 |
| 1002 Ferry St | 0.13mi | 3/1.5 | 1,200 (+8%) | 8mo | $59,000 | $49 | 71 |
| 212 E 19th St St | 0.37mi | 3/1.0 | 1,000 (-10%) | 4mo | $140,000 | $140 | 63 |
| 718 Girard St | 0.33mi | 2/1.0 (-1) | 1,200 (+8%) | 8mo | $73,000 | $61 | 58 |
| 508 Hillcrest St | 0.62mi | 3/1.0 | 1,216 (+10%) | 3mo | $118,500 | $97 | 52 |
| 113 E 21st St | 0.51mi | 3/2.0 | 1,216 (+10%) | 6mo | $76,500 | $63 | 50 |
| 528 W 20th St | 0.61mi | 3/2.0 | 1,231 (+11%) | 2mo | $130,000 | $106 | 47 |
Match score weights: distance 35% · size 25% · config 20% · recency 20%. Top-matched comps best support the ARV.
Projected returns pro-forma
-3.0% appreciation · 3.0% rent growth · sell at horizon
- IRR
- -11.7%
- Equity multiple
- 0.58×
- Total profit
- $-14,865
- Equity at exit
- $18,638
- IRR
- -2.6%
- Equity multiple
- 0.82×
- Total profit
- $-6,157
- Equity at exit
- $10,808
Cash invested: $35,000 (down + closing). Projections, not guarantees.
Landlord ↔ Tenant lean methodology
- Overall (STATE)
- 43 Moderately Tenant-Leaning
- State Illinois
- 43 Moderately Tenant-Leaning · D+7
- County
- — inherits STATE
- City
- — inherits STATE
ZIP-level market 62960
- Home prices YoY
- -19.6%
- Active inventory
- 72
- Price-to-rent
- 9.9×
Monthly cashflow live
- Estimated rent
- $1,055 medium interval (Pro) →
- Mortgage (P&I)
- −$656
- Tax from tax record
- −$40 /mo · $482/yr
- Insurance
- −$52
- HOA
- −$0
- Vacancy / Maint / Mgmt
- −$222
- Net cashflow
- $86
Break-even live
Sensitivity live
| Price | -10% $156 | -5% $121 | +0% $86 | +5% $50 | +10% $15 |
|---|---|---|---|---|---|
| Rent | -10% $2 | -5% $44 | +0% $86 | +5% $127 | +10% $169 |
| Rate | -1.0pp $148 | -0.5pp $117 | base $86 | +0.5pp $53 | +1.0pp $20 |
UW: 25.0% down · 7.5% · 30yr · 1.5% tax · 5.0% vac · 8.0% maint · 8.0% mgmt
Financing live
Cash to close
- Down payment
- $31,250
- Closing costs
- $3,750
- Reserves months
- —
- Total cash needed
- —
Loan-product check · same deal, 3 products live
Conventional
25% down · 7.5% · 30yr
- Down + closing
- —
- Monthly P&I
- —
- Monthly cashflow
- —
- DSCR
- —
- Eligible?
- —
Personal DTI + credit; lowest rate.
DSCR
20% down · 8.5% · 30yr
- Down + closing
- —
- Monthly P&I
- —
- Monthly cashflow
- —
- DSCR
- —
- Eligible?
- —
No personal income docs; deal must DSCR.
Hard money
10% down · 12.0% · 12mo
- Down + closing
- —
- Monthly P&I
- —
- Monthly cashflow
- —
- DSCR
- —
- Eligible?
- —
Short-term bridge; refi at stabilization.
Listing history 20 events
-
2026-06-22days on market $125,000 Active 25 DOM
-
2026-06-21days on market $125,000 Active 24 DOM
-
2026-06-21days on market $125,000 Active 23 DOM
-
2026-06-18days on market $125,000 Active 21 DOM
-
2026-06-17days on market $125,000 Active 20 DOM
-
2026-06-16days on market $125,000 Active 19 DOM
-
2026-06-15days on market $125,000 Active 18 DOM
-
2026-06-13days on market $125,000 Active 16 DOM
-
2026-06-12days on market $125,000 Active 15 DOM
-
2026-06-09days on market $125,000 Active 12 DOM
-
2026-06-08days on market $125,000 Active 11 DOM
-
2026-06-07days on market $125,000 Active 10 DOM
-
2026-06-05days on market $125,000 Active 8 DOM
-
2026-06-04days on market $125,000 Active 6 DOM
-
2026-06-02days on market $125,000 Active 5 DOM
-
2026-06-01days on market $125,000 Active 4 DOM
-
2026-05-31days on market $125,000 Active 3 DOM
-
2026-05-31days on market $125,000 Active 2 DOM
-
2026-05-28$125,000 Active
-
2006-05-11soldstatus $50,000
ⓘ Source: listings_history table (triggers on properties + properties_extension) + one-shot
backfill from property_details.listing_events for pre-trigger history.
Tax reassessment forecast IL · Partial reset (capped growth)
- Current annual tax
- $482 · $40/mo
- Projected year-2 tax
- $1,660 · $138/mo
- Expected delta
- +$1,178/yr (+$98/mo · 244.1%)
ⓘ Screening estimate from a state-policy table — verify with the county assessor before closing.
Climate risk First Street
- Flood 1/10 Low FEMA zone X · 0% chance over 30 yrs
- Wildfire 3/10 Moderate
- Heat 6/10 Major 7 d/yr ≥109°F today · 20 d/yr by 30 yrs out
- Wind 3/10 Moderate 6% chance of damaging wind over 30 yrs
- Air quality 2/10 Low 1 unhealthy d/yr today · 2 by 30 yrs out
Nearby sold comps map
Loading sold comps map…
Walkable amenities ~0.75 mi
Loading nearby amenities…
Taxation est. · year 1
- Rental income
- $12,658
- − Mortgage interest
- −$7,002
- − Property taxes
- −$482
- − Insurance
- −$625
- − Repairs & maintenance
- −$1,013
- − Management
- −$1,013
- − Depreciation
- −$3,636
- Taxable loss
- −$1,113
- Est. tax savings @ 24.0%
- +$267
- After-tax cash flow
- $1,293/yr
For passive investors: Depreciation is non-cash, so a rental often shows a tax loss while cash-flowing — sheltering income. Rental losses are passive: they offset passive income freely, and up to $25,000/yr can offset ordinary (W-2) income if you actively participate and your MAGI is under $100k (phasing out to $0 by $150k); unused losses carry forward. On sale, claimed depreciation is recaptured at up to 25%, and gains may owe capital-gains tax (a 1031 exchange can defer both). Figures are a year-1 estimate at your 24.0% rate — not tax advice; consult a CPA.
Schools (NCES district)
- District
- Massac UD 1
- NCES district ID
- 1725000
- Math proficiency
- 24% ▼ -13.00%
- Reading proficiency
- 28% ▼ -13.00%
- Median HH income
- $41,431
- Composite
- 22.06/100
- National rank
- #8192
- State rank
- #318 of 620 in IL
Livability — Metropolis
- Score
- 75/100
- State rank
- #217
- US rank
- #4091
Category grades
Schools grade is shown separately in the Schools card above.
Census & demographics
- Census place
- Metropolis, IL
- Population (ZIP)
- 10,823
Population outlook (Massac County) Hauer SSP2
- Today (2025)
- 13,461 people
- By 2030
- 12,675 · -5.8%
- By 2040
- 11,124 · -17.4%
- By 2050
- 9,711 · -27.9%
- By 2075
- 7,253 · -46.1%
- By 2100
- 5,666 · -57.9%
Race, ethnicity, and origin ACS 2023
- Neighborhood character
- Predominantly White (86%)
- Race & ethnicity
- White 86% Black 7% Two or more races 5% Hispanic / Latino 3%
- Common ancestry
- Romanian 2% Serbian 2% Lithuanian 2%
- Foreign-born
- 2% · Canada
- Languages at home
- 97% English-only · Spanish 2%
Political lean MEDSL · Massac
- 2024 margin
- Solid R (+48.8) · D 25.2% · R 74.0%
- 2008→2024 swing
- -25.4pp toward R · 2008: -23.4pp · 2024: -48.8pp
- All cycles
- 2024: R+48.8 2020: R+48.0 2016: R+49.6 2012: R+33.7 2008: R+23.4
Not yet ingested
- Civics
- —
Market trends
- HPI YoY
- ▼ -33.38%
- Current HPI
- 137.0772
- Rent YoY
- —
- Metro
- —
- State GDP YoY
- ▲ 1.59%
- F500 in state
- 60
Industry mix (Fortune 500 HQ in IL)
| Industry | F500 HQs | Revenue |
|---|---|---|
| Insurance | 4 | $201B |
|
||
| Consumer Goods | 4 | $87B |
|
||
| Industrial Machinery | 3 | $64B |
|
||
| Healthcare | 2 | $55B |
|
||
| Retail / Pharmacy | 1 | $148B |
|
||
| Agriculture / Food | 1 | $86B |
|
||
Price history
+150.0% since first listed2 events — show timeline
- 2026-05-28 Listed $125,000 MRED as Distributed by MLS Grid
- 2006-05-11 Sold (Public Records) $50,000 Public Records
Property tax history
-0.7%/yrLatest (2024): $482 · -8.0% YoY. Source: county tax records.
Cash-flow waterfall
monthlySold comps — $/sqft
last 12 mo · ≤1 miLoading sold comps…