 Multi-family
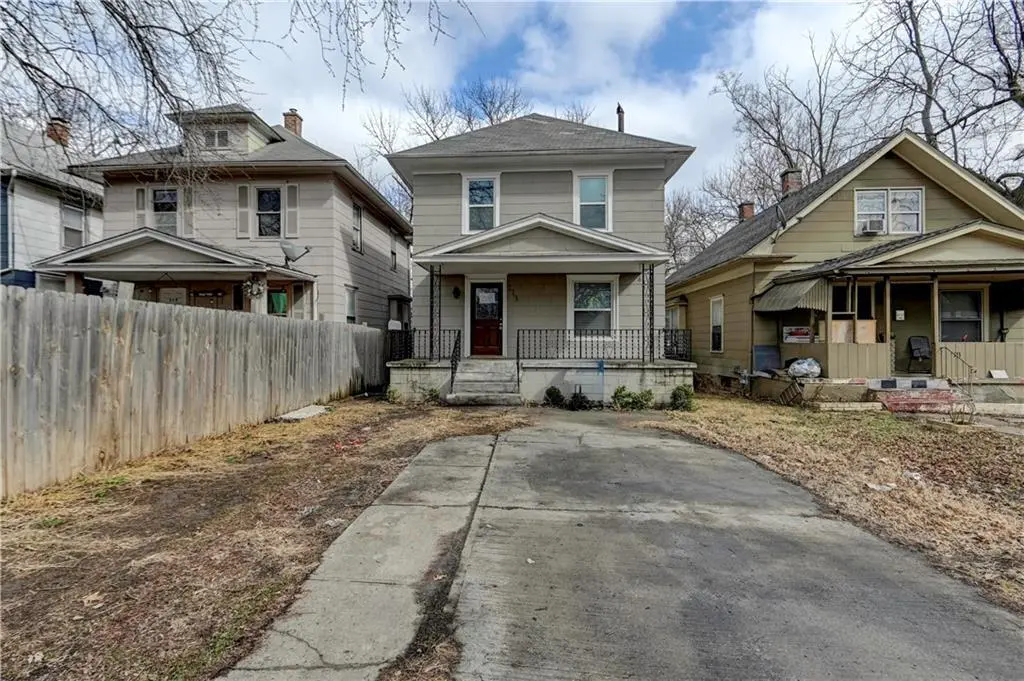
113 N White Ave · Kansas City, MO
Flood risk 1/10 · Minimal
- FEMA flood zone
- X (unshaded)
- Chance of flooding over 30 yrs
- 0.0%
- Est. flood insurance / yr
- $473 – $860
Fire risk 4/10 · Minor
- Est. fire insurance / yr
- $1,054 – $1,958
Heat risk 4/10 · Minor
- Hot days now (above 107°F)
- 7 days/yr
- Hot days in 30 yrs
- 17 days/yr
Wind risk 2/10 · Minimal
- Chance of severe wind over 30 yrs
- —
Air-quality risk 3/10 · Minor
- Unhealthy air days now
- 2 days/yr
- Unhealthy air days in 30 yrs
- 3 days/yr
Risk factors via First Street. Map © Google.
Why this score? — see what drove the B- grade
The composite is a weighted blend of 9 inputs, each scored 0–100. Each bar is that input's sub-score; the figure is the points it added to the 100-point composite (weight × sub-score).
- Cash flow +27.4/30.0
- ARV discount +14.4/15.0
- DSCR +9.6/10.0
- 1% rule +6.7/10.0
- Livability +3.9/5.0
- Rent growth +2.5/5.0
- Condition / age +2.2/5.0
- Schools +1.5/10.0
- Appreciation +0.0/10.0
$139,200
🖨 Deal sheet (PDF) 📄 Offer letter ✓ Due diligence
Multi-family units
County records classify this as Multi-Family (2-4 Unit). Listing-text estimate: 1 unit. estimate disagrees with records
Listing remarks MLS
Classic Kansas City architecture. Light and bright inside. Well maintained, move in ready. Fully renovated, beautiful hardwood flooring. This Home is Case Number: 291-616229. A bid can get canceled or rejected at any time so check HUDHomeStore DAILY for status. Buyer Must Have a Mortgage Commitment or proof of cash before bidding. HUD owned homes are sold AS IS.
Key facts
- 3,972 sq ft lot
- Built 1908
- Listed 82 days
Neighborhood map
What this means for you Summary
Snapshot
- This is a 4-bed/2.0-bath multifamily listed at $139k. Condition is rated fair.
Deal economics
- At list price, monthly cash flow is $406 ($5k/yr) — positive.
- The deal already cash-flows at list — no discount required.
- Meets the 1% rule at list price ($2k rent vs $139k).
- Recommended offer: $131k (6.0% below list) — sets the bar for market timing.
- Cap rate 9.8% vs local median 3.9% in Kansas City — top-decile yield for the area; either an underpriced asset or a hidden risk that comps aren't pricing in. Stress-test before assuming the spread holds.
Location & tenants
- Location reads 78/100 on livability (#28 in MO, #2,671 nationally) — a middle-class / working-renter tenant base. Strengths: amenities A+, commute A+, cost of living A+; Watch: crime F.
- Kansas City 33 (urban): math 12% / reading 24% proficiency, ranked #308 of 324 in MO (top 95%) — low school quality limits family demand, transient renter base, plan for 1-2y turnover; 75% free/reduced lunch — lower-income household profile, screen leases tightly.
- Zoned schools: Ac Prep Elementary (math 12% / reading 27%, grade F, #941 of 1,115 statewide, top 86%, 341 students, 99% FRL); Northeast Middle School (math 4% / reading 9%, grade F, #384 of 391 statewide, top 98%, 555 students, 100% FRL); East High School (math 0% / reading 13%, grade F, #516 of 521 statewide, top 99%, 1,112 students, 100% FRL) — zoned schools average 99% FRL vs 75% district-wide (24 pts higher); higher-poverty schools than district average — tighter screening recommended.
- Market conditions: 61 active listings in the ZIP; 9 comparable units currently listed for rent nearby; rentals at typical pace (median 23d on market — plan ~3-4 weeks tenant-placement turnaround); 4,002 units permitted in Jackson County in 2024 (2,271 in 5+ unit buildings).
- This rent runs 36% of the median local income ($54k/yr) — at the standard rent-burdened threshold; future hikes will face affordability resistance.
Forward outlook
- Local home prices are declining (-3.0%/yr); year-one equity from $962 of loan paydown is wiped out by about $4k of value loss. Plan a longer hold.
- Jackson County population projected at +4% by 2050 — modest demand growth; plan on rents tracking national, not racing it.
- At projected returns (-3.0% appreciation + 3.0% rent growth), your $39k cash investment doubles in ~10 years — after that, you're playing with house money.
Negotiation context
- It's been on market 83 days — a 6% lower offer ($131k) is reasonable based on typical stale-listing flexibility.
Risks & watch-outs
- Watch-outs: built in 1908 — expect roof / HVAC / electrical / plumbing capex.
Questions for the listing agent
- It's been on market 83 days. Have you received any prior offers? Is the seller open to a 6% concession, seller financing, or rate buy-down credit?
- Have any recent inspections been done? Can we get a copy of the seller's disclosures and any deferred-maintenance estimates?
- Built in 1908 — when were the roof, HVAC, electrical panel, plumbing, and water heater last replaced?
- Why hasn't it sold? Are there any deal-killer items the seller is aware of (foundation, flood, title, zoning, code violations)?
- Is there a deadline driving the sale (1031 exchange, divorce, estate, relocation)? That informs how much negotiation room exists.
- Crime grade is F in this area — have there been break-ins, vandalism, or insurance claims at this property in the last 3 years? What carrier currently insures it and at what premium?
- What's the average days-on-market for RENTAL listings here right now (not sales)? A rising rental-DOM trend means longer vacancies and softer asking-rent achievability than the comps imply.
- What's the recent tenant-quality profile in this submarket — average credit score on applications, eviction rate, late-payment / NSF rate, and stable-employment percentage? A property-management company in the area should have these aggregated.
- How much new apartment / multifamily construction is in the pipeline within 1–3 miles? Heavy new supply (>2% of stock underway) typically softens rents 12–24 months out; light construction supports rent growth.
Investment metrics
- 1% rule
- 1.17% ✓
- Cap rate
- 9.79%
- Cash-on-cash
- 12.49%
- DSCR
- 1.56
- GRM
- 7.1
CMA / ARV
- ARV (median comp)
- $164,436
- List price
- $139,200
- Delta
- -15.35%
- Verdict
- UNDERPRICED
- Comps
- 20 within 1.0 mi
Projected returns pro-forma
-3.0% appreciation · 3.0% rent growth · sell at horizon
- IRR
- 2.2%
- Equity multiple
- 1.08×
- Total profit
- $3,255
- Equity at exit
- $20,755
- IRR
- 11.7%
- Equity multiple
- 1.92×
- Total profit
- $35,997
- Equity at exit
- $12,035
Cash invested: $38,976 (down + closing). Projections, not guarantees.
Landlord ↔ Tenant lean methodology
- Overall (STATE)
- 81 Strongly Landlord-Friendly
- State Missouri
- 81 Strongly Landlord-Friendly · R+10
- County
- — inherits STATE
- City
- — inherits STATE
ZIP-level market 64123
- Home prices YoY
- -8.3%
- Active inventory
- 61
- Price-to-rent
- 7.1×
Monthly cashflow live
- Estimated rent
- $1,627 high interval (Pro) →
- Mortgage (P&I)
- −$730
- Tax from tax record
- −$91 /mo · $1,096/yr
- Insurance
- −$58
- HOA
- −$0
- Lot rent
- −$0
- Vacancy / Maint / Mgmt
- −$342
- Net cashflow
- $406
Break-even live
Sensitivity live
| Price | -10% $484 | -5% $445 | +0% $406 | +5% $366 | +10% $327 |
|---|---|---|---|---|---|
| Rent | -10% $277 | -5% $341 | +0% $406 | +5% $470 | +10% $534 |
| Rate | -1.0pp $476 | -0.5pp $441 | base $406 | +0.5pp $370 | +1.0pp $333 |
UW: 25.0% down · 7.5% · 30yr · 1.5% tax · 5.0% vac · 8.0% maint · 8.0% mgmt
Financing live
Cash to close
- Down payment
- $34,800
- Closing costs
- $4,176
- Reserves months
- —
- Total cash needed
- —
Loan-product check · same deal, 3 products live
Conventional
25% down · 7.5% · 30yr
- Down + closing
- —
- Monthly P&I
- —
- Monthly cashflow
- —
- DSCR
- —
- Eligible?
- —
Personal DTI + credit; lowest rate.
DSCR
20% down · 8.5% · 30yr
- Down + closing
- —
- Monthly P&I
- —
- Monthly cashflow
- —
- DSCR
- —
- Eligible?
- —
No personal income docs; deal must DSCR.
Hard money
10% down · 12.0% · 12mo
- Down + closing
- —
- Monthly P&I
- —
- Monthly cashflow
- —
- DSCR
- —
- Eligible?
- —
Short-term bridge; refi at stabilization.
Rent comps 9 comps
| Address | Beds | Baths | Sqft | Rent | $/sqft | DOM | Units | Dist |
|---|---|---|---|---|---|---|---|---|
| 216 N Wheeling Ave Kansas City, MO | 3.0 | 2.0 | 1474 | $1,495 | $1.01 | 22d | 1 | 0.05mi |
| 216 N Wheeling Ave Kansas City, MO | 3.0 | 2.0 | 1474 | $1,495 | $1.01 | 19d | 1 | 0.05mi |
| 135 Lawndale Ave Kansas City, MO | 3.0 | 2.0 | 920 | $1,500 | $1.63 | 10d | 1 | 0.26mi |
| 5213 Wilburn Ct Kansas City, MO | 3.0 | 1.0 | 1274 | $1,375 | $1.08 | 24d | 1 | 0.49mi |
| 441 N Hardesty Ave Kansas City, MO | 4.0 | 1.0 | 1511 | $1,550 | $1.03 | 26d | 1 | 0.49mi |
| 218 N Elmwood Ave Kansas City, MO | 4.0 | 2.0 | 1184 | $1,500 | $1.27 | 46d | 1 | 0.93mi |
| 6011 E 11th St Kansas City, MO | 3.0 | 1.0 | 900 | $1,200 | $1.33 | 19d | 1 | 0.95mi |
| 4405 Norledge Ave Kansas City, MO | 3.0 | 1.0 | 1510 | $1,600 | $1.06 | 46d | 1 | 1.03mi |
| 815 Elmwood Ave Kansas City, MO | 3.0 | 1.5 | 1302 | $1,600 | $1.23 | 17d | 1 | 1.18mi |
Listing history 20 events
-
2026-06-22days on market $139,200 Active 83 DOM
-
2026-06-21days on market $139,200 Active 82 DOM
-
2026-06-18days on market $139,200 Active 79 DOM
-
2026-06-17days on market $139,200 Active 78 DOM
-
2026-06-16pricedays on market $139,200 Active 77 DOM
-
2026-06-15days on market $160,080 Active 76 DOM
-
2026-06-13remarks 382-char remark
-
2026-06-13days on market $160,080 Active 74 DOM
-
2026-06-09days on market $160,080 Active 70 DOM
-
2026-06-08days on market $160,080 Active 69 DOM
-
2026-06-07days on market $160,080 Active 68 DOM
-
2026-06-05days on market $160,080 Active 65 DOM
-
2026-06-03days on market $160,080 Active 64 DOM
-
2026-06-02days on market $160,080 Active 63 DOM
-
2026-06-01days on market $160,080 Active 62 DOM
-
2026-05-31days on market $160,080 Active 61 DOM
-
2026-05-12price $160,080 364-char remark
Show marketing remark (364 chars)
Classic Kansas City architecture. Light and bright inside. Well maintained, move in ready. Fully renovated, beautiful hardwood flooring. This Home is Case Number: 291-616229. A bid can get canceled or rejected at any time so check HUDHomeStore DAILY for status. Buyer Must Have a Mortgage Commitment or proof of cash before bidding. HUD owned homes are sold AS IS.
-
2026-03-31$174,000 Active 364-char remark
Show marketing remark (364 chars)
Classic Kansas City architecture. Light and bright inside. Well maintained, move in ready. Fully renovated, beautiful hardwood flooring. This Home is Case Number: 291-616229. A bid can get canceled or rejected at any time so check HUDHomeStore DAILY for status. Buyer Must Have a Mortgage Commitment or proof of cash before bidding. HUD owned homes are sold AS IS.
-
2022-02-24soldstatus
-
1998-06-12soldstatus
ⓘ Source: listings_history table (triggers on properties + properties_extension) + one-shot
backfill from property_details.listing_events for pre-trigger history.
Tax reassessment forecast MO · Resets to sale price
- Current annual tax
- $1,096 · $91/mo
- Projected year-2 tax
- $1,350 · $113/mo
- Expected delta
- +$254/yr (+$21/mo · 23.2%)
ⓘ Screening estimate from a state-policy table — verify with the county assessor before closing.
Climate risk First Street
- Flood 1/10 Low FEMA zone X (unshaded) · 0% chance over 30 yrs
- Wildfire 4/10 Moderate
- Heat 4/10 Moderate 7 d/yr ≥107°F today · 17 d/yr by 30 yrs out
- Wind 2/10 Low
- Air quality 3/10 Moderate 2 unhealthy d/yr today · 3 by 30 yrs out
Nearby sold comps map
Loading sold comps map…
Walkable amenities ~0.75 mi
Loading nearby amenities…
Taxation est. · year 1
- Rental income
- $19,519
- − Mortgage interest
- −$7,797
- − Property taxes
- −$1,096
- − Insurance
- −$696
- − Repairs & maintenance
- −$1,562
- − Management
- −$1,562
- − Depreciation
- −$4,049
- Taxable income
- $2,757
- Est. tax owed @ 24.0%
- −$662
- After-tax cash flow
- $4,206/yr
For passive investors: Depreciation is non-cash, so a rental often shows a tax loss while cash-flowing — sheltering income. Rental losses are passive: they offset passive income freely, and up to $25,000/yr can offset ordinary (W-2) income if you actively participate and your MAGI is under $100k (phasing out to $0 by $150k); unused losses carry forward. On sale, claimed depreciation is recaptured at up to 25%, and gains may owe capital-gains tax (a 1031 exchange can defer both). Figures are a year-1 estimate at your 24.0% rate — not tax advice; consult a CPA.
Condition & rehab AI · 12 photos
This multi-family home requires moderate renovations to improve its curb appeal and interior condition, significantly increasing its resale and rental value.
Repairs flagged
- Major siding — Significant wear and tear
- Major paint — Peeling and chipping
- Major flooring — Worn and outdated carpet
- Moderate kitchen cabinets — Outdated design
Value-add opportunities
- Both new siding and paint — Enhances curb appeal and value
- Both new flooring — Improves living space and rental appeal
- Both updated kitchen cabinets — Modernizes the space and attracts buyers
Renovation cost estimate screening
| Repair item | Severity | Est. cost |
|---|---|---|
| siding · Significant wear and tear | Major | $15,000–50,000 |
| paint · Peeling and chipping | Major | $15,000–50,000 |
| flooring · Worn and outdated carpet | Major | $15,000–50,000 |
| kitchen cabinets · Outdated design | Moderate | $3,000–15,000 |
| Total estimated repair cost · 4 items | $48,000–165,000 |
Value-add ROI direction
- Both new siding and paint — Enhances curb appeal and value ↑
- Both new flooring — Improves living space and rental appeal ↑
- Both updated kitchen cabinets — Modernizes the space and attracts buyers ↑
ⓘ Cost ranges are severity-bucket heuristics (US national rule-of-thumb). Get contractor quotes + a written scope before underwriting a rehab budget.
Schools (NCES district)
- District
- Kansas City 33
- NCES district ID
- 2916400
- Math proficiency
- 12% ▼ -8.00%
- Reading proficiency
- 24% ▬ 0.00%
- Median HH income
- $35,227
- Composite
- 14.8/100
- National rank
- #9387
- State rank
- #308 of 324 in MO
Livability — Kansas City
- Score
- 78/100
- State rank
- #28
- US rank
- #2671
Category grades
Schools grade is shown separately in the Schools card above.
Census & demographics
- Census place
- Kansas City, MO
- County
- Jackson County · 687,798 people
- City population
- 439,467
- Metro
- Kansas City, MO-KS
- Population (ZIP)
- 11,833
- Household income
- $54,443
- Rent vs Own
- Severe rent burden
- 338.0
Population outlook (Jackson County) Hauer SSP2
- Today (2025)
- 719,589 people
- By 2030
- 731,456 · +1.6%
- By 2040
- 746,689 · +3.8%
- By 2050
- 749,289 · +4.1%
- By 2075
- 736,227 · +2.3%
- By 2100
- 668,210 · -7.1%
Race, ethnicity, and origin ACS 2023
- Neighborhood character
- Diverse neighborhood (Simpson 0.64)
- Race & ethnicity
- Hispanic / Latino 48% White 34% Two or more races 25% Black 10% Asian 5% Native American 2%
- Hispanic origin (detail)
- Mexican 37% Puerto Rican 1% Cuban 3%
- Common ancestry
- Italian 2% Arab 2% Romanian 1%
- Foreign-born
- 22% · Canada, Vietnam, Philippines
- Languages at home
- 58% English-only · Spanish 35% Arabic 2% Vietnamese 1%
Political lean MEDSL · Jackson
- 2024 margin
- D (+19.3) · D 58.9% · R 39.5% · Other 1.6%
- 2008→2024 swing
- -6.1pp toward R · 2008: 25.4pp · 2024: 19.3pp
- All cycles
- 2024: D+19.3 2020: D+22.0 2016: D+16.6 2012: D+19.0 2008: D+25.4
Not yet ingested
- Civics
- —
Market trends
- HPI YoY
- ▼ -35.35%
- Current HPI
- 392.4402
- Rent YoY
- —
- Metro
- Kansas City, MO-KS
- State GDP YoY
- ▲ 1.84%
- F500 in state
- 20
Industry mix (Fortune 500 HQ in MO)
| Industry | F500 HQs | Revenue |
|---|---|---|
| Healthcare | 1 | $163B |
|
||
| Insurance | 1 | $21B |
|
||
| Industrial Technology | 1 | $17B |
|
||
| Retail | 1 | $16B |
|
||
| Industrial Distribution | 1 | $10B |
|
||
| Utilities | 1 | $9B |
|
||
Price history
-8.0% since first listed4 events — show timeline
- 2026-05-12 Price Changed $160,080 Heartland MLS as Distributed by MLS Grid
- 2026-03-31 Listed $174,000 Heartland MLS as Distributed by MLS Grid
- 2022-02-24 Sold (Public Records) — Public Records
- 1998-06-12 Sold (Public Records) — Public Records
Property tax history
+10.5%/yrLatest (2025): $1,096 · -44.5% YoY. Source: county tax records.
Cash-flow waterfall
monthlySold comps — $/sqft
last 12 mo · ≤1 miLoading sold comps…