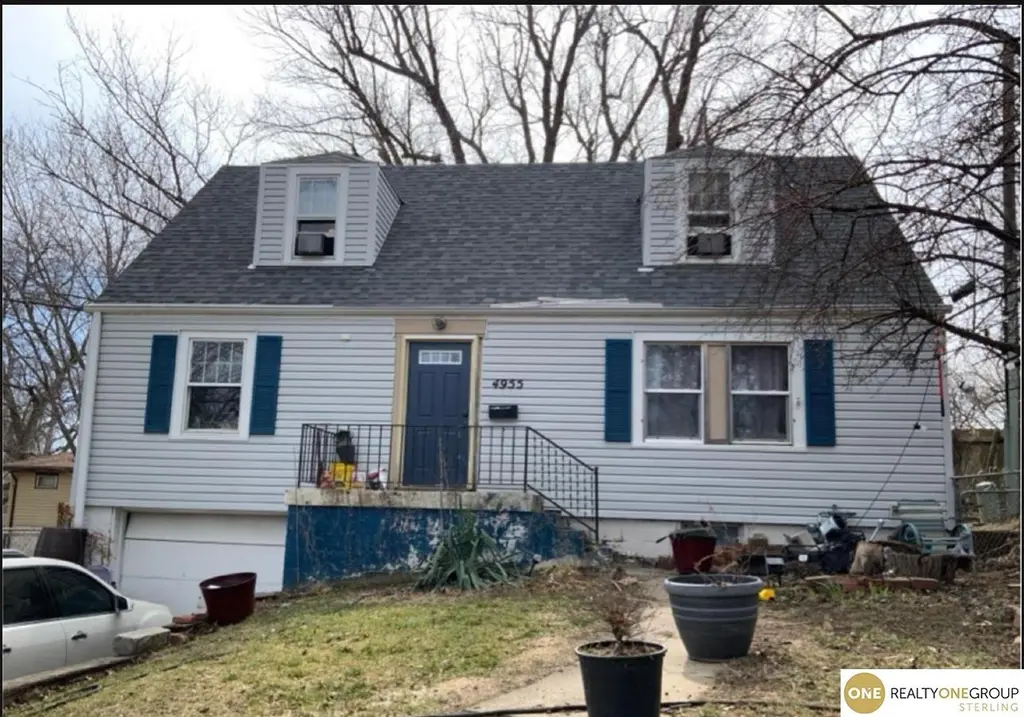
4955 Bedford Ave · Omaha, NE
Flood risk 1/10 · Minimal
- FEMA flood zone
- X (unshaded)
- Chance of flooding over 30 yrs
- 0.0%
- Est. flood insurance / yr
- $473 – $860
Fire risk 1/10 · Minimal
- Est. fire insurance / yr
- $1,161 – $2,155
Heat risk 3/10 · Minor
- Hot days now (above 104°F)
- 7 days/yr
- Hot days in 30 yrs
- 15 days/yr
Wind risk 2/10 · Minimal
- Chance of severe wind over 30 yrs
- —
Air-quality risk 2/10 · Minimal
- Unhealthy air days now
- 0 days/yr
- Unhealthy air days in 30 yrs
- 1 days/yr
Risk factors via First Street. Map © Google.
Why this score? — see what drove the B- grade
The composite is a weighted blend of 9 inputs, each scored 0–100. Each bar is that input's sub-score; the figure is the points it added to the 100-point composite (weight × sub-score).
- Cash flow +30.0/30.0
- 1% rule +10.0/10.0
- DSCR +10.0/10.0
- ARV discount +7.5/15.0
- Livability +4.2/5.0
- Rent growth +3.1/5.0
- Condition / age +2.5/5.0
- Schools +2.1/10.0
- Appreciation +0.0/10.0
$105,000
🖨 Deal sheet 📄 Offer letter ✓ Due diligence
Listing remarks
Looking for a project? This home presents a great opportunity for buyers ready to put in some work and create value. The property will require updates and repairs but offers a solid starting point for renovation. Bring your ideas and make it your own. Sold as-is.
Key facts
- 6,534 sq ft lot
- Garage
- Built 1935
Neighborhood map
What this means for you Summary
Snapshot
- This is a 4-bed/1.5-bath other listed at $105k.
Deal economics
- At list price, monthly cash flow is $828 ($10k/yr) — positive.
- The deal already cash-flows at list — no discount required.
- Meets the 1% rule at list price ($2k rent vs $105k).
- Cap rate 15.8% vs local median 3.6% in Omaha — top-decile yield for the area; either an underpriced asset or a hidden risk that comps aren't pricing in. Stress-test before assuming the spread holds.
Location & tenants
- Location reads 84/100 on livability (#7 in NE, #663 nationally) — a professional / high-income tenant draw. Strengths: amenities A+, commute A+, cost of living A+; Watch: crime F.
- Omaha Public Schools (urban): math 20% / reading 28% proficiency, ranked #110 of 111 in NE (top 99%) — low school quality limits family demand, transient renter base, plan for 1-2y turnover; 62% free/reduced lunch — lower-income household profile, screen leases tightly.
- Zoned schools: Fontenelle Elementary School (math 8% / reading 16%, grade F, #489 of 502 statewide, top 98%, 457 students, 0% FRL); Monroe Middle School (math 8% / reading 15%, grade F, #127 of 128 statewide, top 99%, 769 students, 0% FRL); Benson High School (math 9% / reading 12%, grade F, #257 of 261 statewide, top 98%, 1,570 students, 0% FRL) — zoned schools average 0% FRL vs 62% district-wide (62 pts lower); this property's tenant base skews higher-income than the district average.
- Zoned-school proficiency averages 11% at this address vs 24% district-wide (-13 pts) — the specific schools serving this property underperform the Omaha Public Schools average; the district grade overstates school quality for this exact location.
- Market conditions: Rents rising (+2.4%/yr); 172 active listings in the ZIP; 10 comparable units currently listed for rent nearby; rentals at typical pace (median 15d on market — plan ~3-4 weeks tenant-placement turnaround); 4,539 units permitted in Douglas County in 2024 (2,583 in 5+ unit buildings).
- This rent runs 42% of the median local income ($61k/yr) — at the standard rent-burdened threshold; future hikes will face affordability resistance.
Forward outlook
- Local home prices are declining (-3.0%/yr); year-one equity from $726 of loan paydown is wiped out by about $3k of value loss. Plan a longer hold.
- Douglas County population projected at +28% by 2050 — long-run rental-demand tailwind backs the buy-and-hold thesis.
- At projected returns (-3.0% appreciation + 2.4% rent growth), your $29k cash investment doubles in ~4 years — after that, you're playing with house money.
Negotiation context
- Only 0 days on market — expect competitive offers; lowballing is unlikely to land.
- 4 sale attempts since 15y ago with the ask held roughly flat each time — persistent listings suggest the price (not the market) is what's stuck; bring a comps-based counter.
Risks & watch-outs
- Watch-outs: property tax is 2.8% of price; built in 1935 — expect roof / HVAC / electrical / plumbing capex.
Questions for the listing agent
- Built in 1935 — when were the roof, HVAC, electrical panel, plumbing, and water heater last replaced?
- Property tax is high relative to price — has the assessment been appealed recently, and will the sale trigger a re-assessment?
- Is there a deadline driving the sale (1031 exchange, divorce, estate, relocation)? That informs how much negotiation room exists.
- Crime grade is F in this area — have there been break-ins, vandalism, or insurance claims at this property in the last 3 years? What carrier currently insures it and at what premium?
- What's the average days-on-market for RENTAL listings here right now (not sales)? A rising rental-DOM trend means longer vacancies and softer asking-rent achievability than the comps imply.
- What's the recent tenant-quality profile in this submarket — average credit score on applications, eviction rate, late-payment / NSF rate, and stable-employment percentage? A property-management company in the area should have these aggregated.
- How much new for-sale + rental construction is in the pipeline within 1–3 miles? Heavy new supply typically softens prices + rents 12–24 months out; constrained supply supports both.
Investment metrics
- 1% rule
- 2.02% ✓
- Cap rate
- 15.76%
- Cash-on-cash
- 33.80%
- DSCR
- 2.50
- GRM
- 4.1
CMA / ARV
No comps found within radius.
Projected returns pro-forma
-3.0% appreciation · 2.35% rent growth · sell at horizon
- IRR
- 28.4%
- Equity multiple
- 2.17×
- Total profit
- $34,459
- Equity at exit
- $15,656
- IRR
- 35.4%
- Equity multiple
- 4.16×
- Total profit
- $92,778
- Equity at exit
- $9,078
Cash invested: $29,400 (down + closing). Projections, not guarantees.
Landlord ↔ Tenant lean methodology
- Overall (STATE)
- 83 Strongly Landlord-Friendly
- State Nebraska
- 83 Strongly Landlord-Friendly · R+13
- County
- — inherits STATE
- City
- — inherits STATE
ZIP-level market 68104
- Rents YoY
- 2.4%
- Active inventory
- 172
- Price-to-rent
- 4.1×
Monthly cashflow live
- Estimated rent
- $2,116 high interval (Pro) →
- Mortgage (P&I)
- −$551
- Tax from tax record
- −$249 /mo · $2,990/yr
- Insurance
- −$44
- HOA
- −$0
- Vacancy / Maint / Mgmt
- −$444
- Net cashflow
- $828
Break-even live
UW: 25.0% down · 7.5% · 30yr · 1.5% tax · 5.0% vac · 8.0% maint · 8.0% mgmt
Financing live
Cash to close
- Down payment
- $26,250
- Closing costs
- $3,150
- Reserves months
- —
- Total cash needed
- —
Loan-product check · same deal, 3 products live
Conventional
25% down · 7.5% · 30yr
- Down + closing
- —
- Monthly P&I
- —
- Monthly cashflow
- —
- DSCR
- —
- Eligible?
- —
Personal DTI + credit; lowest rate.
DSCR
20% down · 8.5% · 30yr
- Down + closing
- —
- Monthly P&I
- —
- Monthly cashflow
- —
- DSCR
- —
- Eligible?
- —
No personal income docs; deal must DSCR.
Hard money
10% down · 12.0% · 12mo
- Down + closing
- —
- Monthly P&I
- —
- Monthly cashflow
- —
- DSCR
- —
- Eligible?
- —
Short-term bridge; refi at stabilization.
Rent comps 10 comps
| Address | Beds | Baths | Sqft | Rent | $/sqft | DOM | Units | Dist |
|---|---|---|---|---|---|---|---|---|
| 5011 Miami St Omaha, NE | 3.0 | 3.0 | 2180 | $2,200 | $1.01 | 43d | 1 | 0.35mi |
| 3204 N 56th St Omaha, NE | 3.0 | 2.0 | 1800 | $1,700 | $0.94 | 10d | 1 | 0.53mi |
| 4114 N 54th St Omaha, NE | 3.0 | 2.0 | 1683 | $1,745 | $1.04 | 2d | 1 | 0.71mi |
| 4542 Franklin St Unit Labs Omaha, NE | 5.0 | 2.5 | 2000 | $1,900 | $0.95 | 43d | 1 | 0.94mi |
| 6116 Pinkney St Omaha, NE | 3.0 | 1.5 | 1700 | $1,800 | $1.06 | 11d | 1 | 0.95mi |
| 5610 Seward St Omaha, NE | 4.0 | 2.0 | 1682 | $2,200 | $1.31 | 43d | 1 | 1.09mi |
| 5002 Lafayette Ave Omaha, NE | 5.0 | 2.0 | 2324 | $2,450 | $1.05 | 14d | 1 | 1.13mi |
| 4240 Fowler Ave Omaha, NE | 4.0 | 2.0 | 1956 | $1,895 | $0.97 | 23d | 1 | 1.14mi |
| 5115 Lafayette Ave Omaha, NE | 5.0 | 4.5 | 3228 | $3,650 | $1.13 | 2d | 1 | 1.18mi |
| 6547 Bedford Ave Omaha, NE | 4.0 | 2.0 | 2500 | $1,795 | $0.72 | 14d | 1 | 1.26mi |
Listing history 13 events
-
2026-04-29historical
-
2026-04-29$105,000
-
2026-04-14historical
-
2026-03-02$170,000 New
-
2018-05-08soldstatus $120,000
-
2016-08-01historical
-
2016-07-28price $110,000
-
2016-07-12$115,000 Active - New
-
2012-01-18soldstatus $95,000
-
2011-12-28soldstatus $95,000
-
2011-12-03historical
-
2011-09-05$95,000
-
2000-01-19soldstatus $76,000
ⓘ Source: listings_history table (triggers on properties + properties_extension) + one-shot
backfill from property_details.listing_events for pre-trigger history.
Tax reassessment forecast NE · Resets to sale price
- Current annual tax
- $2,990 · $249/mo
- Projected year-2 tax
- $2,990 · $249/mo
- Expected delta
- $0/yr ($0/mo · 0.0%)
ⓘ Screening estimate from a state-policy table — verify with the county assessor before closing.
Climate risk First Street
- Flood 1/10 Low FEMA zone X (unshaded) · 0% chance over 30 yrs
- Wildfire 1/10 Low
- Heat 3/10 Moderate 7 d/yr ≥104°F today · 15 d/yr by 30 yrs out
- Wind 2/10 Low
- Air quality 2/10 Low 0 unhealthy d/yr today · 1 by 30 yrs out
Nearby sold comps map
Loading sold comps map…
Walkable amenities ~0.75 mi
Loading nearby amenities…
Taxation est. · year 1
- Rental income
- $25,392
- − Mortgage interest
- −$5,882
- − Property taxes
- −$2,990
- − Insurance
- −$525
- − Repairs & maintenance
- −$2,031
- − Management
- −$2,031
- − Depreciation
- −$3,055
- Taxable income
- $8,879
- Est. tax owed @ 24.0%
- −$2,131
- After-tax cash flow
- $7,807/yr
For passive investors: Depreciation is non-cash, so a rental often shows a tax loss while cash-flowing — sheltering income. Rental losses are passive: they offset passive income freely, and up to $25,000/yr can offset ordinary (W-2) income if you actively participate and your MAGI is under $100k (phasing out to $0 by $150k); unused losses carry forward. On sale, claimed depreciation is recaptured at up to 25%, and gains may owe capital-gains tax (a 1031 exchange can defer both). Figures are a year-1 estimate at your 24.0% rate — not tax advice; consult a CPA.
Schools (NCES district)
- District
- Omaha Public Schools
- NCES district ID
- 3174820
- Math proficiency
- 20% ▼ -10.00%
- Reading proficiency
- 28% ▼ -5.00%
- Median HH income
- $46,039
- Composite
- 20.83/100
- National rank
- #8502
- State rank
- #110 of 111 in NE
Livability — Omaha
- Score
- 84/100
- State rank
- #7
- US rank
- #663
Category grades
Schools grade is shown separately in the Schools card above.
Census & demographics
- Census place
- Omaha, NE
- County
- Douglas County · 538,646 people
- City population
- 552,986
- Metro
- Omaha-Council Bluffs, NE-IA
- Population (ZIP)
- 36,673
- Household income
- $60,549
- Rent vs Own
- Severe rent burden
- 1738.0
Population outlook (Douglas County) Hauer SSP2
- Today (2025)
- 625,245 people
- By 2030
- 661,613 · +5.8%
- By 2040
- 732,395 · +17.1%
- By 2050
- 801,988 · +28.3%
- By 2075
- 968,637 · +54.9%
- By 2100
- 1,101,871 · +76.2%
Race, ethnicity, and origin ACS 2023
- Neighborhood character
- Diverse neighborhood (Simpson 0.68)
- Race & ethnicity
- White 50% Black 23% Asian 12% Two or more races 11% Hispanic / Latino 7%
- Hispanic origin (detail)
- Mexican 6%
- Common ancestry
- Slovak 2% Lithuanian 2% Romanian 2%
- Foreign-born
- 13% · Philippines, Canada, India
- Languages at home
- 83% English-only · Other Asian/Pacific 8% Spanish 5% Other Indo-European 2%
Political lean MEDSL · Douglas
- 2024 margin
- D (+10.2) · D 54.4% · R 44.2% · Other 1.4%
- 2008→2024 swing
- +5.5pp toward D · 2008: 4.6pp · 2024: 10.2pp
- All cycles
- 2024: D+10.2 2020: D+11.3 2016: D+1.4 2012: R+4.3 2008: D+4.6
Not yet ingested
- Civics
- —
Market trends
- HPI YoY
- ▼ -196.54%
- Current HPI
- 298.8625
- Rent YoY
- ▲ 2.35%
- Metro
- Omaha-Council Bluffs, NE-IA
- State GDP YoY
- ▲ 0.68%
- F500 in state
- 2
Industry mix (Fortune 500 HQ in NE)
| Industry | F500 HQs | Revenue |
|---|---|---|
| Conglomerate | 1 | $371B |
|
||
Price history
+38.2% since first listed13 events — show timeline
- 2026-04-29 Listed $105,000 GPRMLS
- 2026-04-29 Listing Removed — GPRMLS
- 2026-04-14 Listing Removed — GPRMLS
- 2026-03-02 Listed $170,000 GPRMLS
- 2018-05-08 Sold (Public Records) $120,000 Public Records
- 2016-08-01 Listing Removed — GPRMLS
- 2016-07-28 Price Changed $110,000 GPRMLS
- 2016-07-12 Listed $115,000 GPRMLS
- 2012-01-18 Sold (Public Records) $95,000 Public Records
- 2011-12-28 Sold (MLS) $95,000 GPRMLS
- 2011-12-03 Listing Removed — GPRMLS
- 2011-09-05 Listed $95,000 GPRMLS
- 2000-01-19 Sold (Public Records) $76,000 Public Records
Property tax history
+4.2%/yrLatest (2025): $2,990 · -1.3% YoY. Source: county tax records.
Cash-flow waterfall
monthlySold comps — $/sqft
last 12 mo · ≤1 miLoading sold comps…