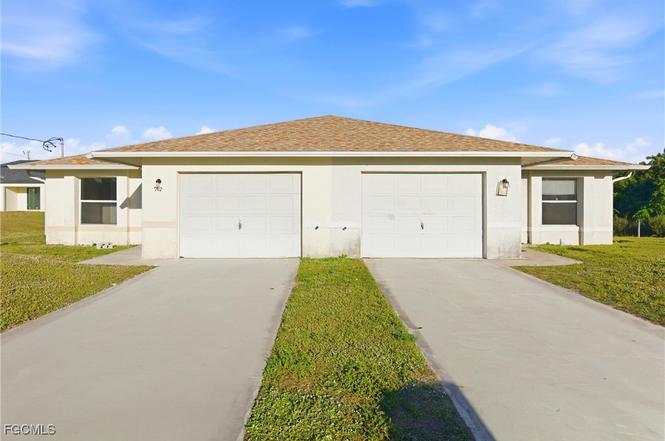
 Duplex
967 Eisenhower Blvd · Lehigh Acres, FL
Flood risk 1/10 · Minimal
- FEMA flood zone
- X (unshaded)
- Chance of flooding over 30 yrs
- 0.0%
- Est. flood insurance / yr
- $507 – $1,088
Fire risk 3/10 · Minor
- Est. fire insurance / yr
- $947 – $1,759
Heat risk 9/10 · Severe
- Hot days now (above 109°F)
- 7 days/yr
- Hot days in 30 yrs
- 27 days/yr
Wind risk 10/10 · Severe
- Chance of severe wind over 30 yrs
- 99.0%
Air-quality risk 2/10 · Minimal
- Unhealthy air days now
- 1 days/yr
- Unhealthy air days in 30 yrs
- 2 days/yr
Risk factors via First Street. Map © Google.
Why this score? — see what drove the B- grade
The composite is a weighted blend of 9 inputs, each scored 0–100. Each bar is that input's sub-score; the figure is the points it added to the 100-point composite (weight × sub-score).
- Cash flow +18.9/30.0
- ARV discount +15.0/15.0
- Appreciation +10.0/10.0
- DSCR +6.0/10.0
- 1% rule +4.6/10.0
- Schools +4.1/10.0
- Livability +3.0/5.0
- Condition / age +2.5/5.0
- Rent growth +1.3/5.0
$369,990
🖨 Deal sheet (PDF) 📄 Offer letter ✓ Due diligence
Multi-family units
County records classify this as Multi-Family (2-4 Unit). Listing-text estimate: 2 units. confirmed
Listing remarks MLS
Great investment opportunity to own this well-maintained income producing duplex. There are 3 bedrooms and 2 full bathrooms on each side and each unit features tile throughout. Both sides are rented so start out with a positive cash flow. The duplex also sits on an over-sized lot and is located close to 82. This property offers many possibilities. Price to sell, it won’t last long! Schedule your showing today.
Key facts
- Brand new roof
- Updated a c system
- New water heater
Tags
Neighborhood map
What this means for you Summary
Snapshot
- This is a 2 × 3-bed/2.0-bath units multifamily listed at $370k.
Deal economics
- At list price, monthly cash flow is $380 ($5k/yr) — positive. Per door: $190/mo.
- The deal already cash-flows at list — no discount required.
- To meet the 1% rule (rent ≥ 1% of price), the offer needs to be $354k (4.4% below list).
- Recommended offer: $354k (4.4% below list) — sets the bar for 1% rule.
- Cap rate 7.5% vs local median 4.7% in Lehigh Acres — top-decile yield for the area; either an underpriced asset or a hidden risk that comps aren't pricing in. Stress-test before assuming the spread holds.
Location & tenants
- Location reads 59/100 on livability (#826 in FL) — a working-class tenant base; expect higher turnover. Strengths: cost of living A+, housing A+; Watch: crime C-, employment D+, amenities F.
- Lee (suburban): math 47% / reading 50% proficiency, ranked #42 of 73 in FL (top 58%) — families likely to look elsewhere, expect single-tenant / working-renter base with shorter leases.
- Zoned schools: Veterans Park Academy For The Arts (math 41% / reading 45%, grade F, #1,366 of 2,144 statewide, top 64%, 2,133 students, 36% FRL); Oak Hammock Middle School (math 43% / reading 41%, grade D-, #340 of 571 statewide, top 61%, 1,563 students, 56% FRL); Lehigh Senior High School (math 23% / reading 45%, grade F, #394 of 667 statewide, top 60%, 2,476 students, 57% FRL).
- Market conditions: Rents falling (-4.7%/yr); 2481 active listings in the ZIP; 15,411 units permitted in Lee County in 2024 (4,686 in 5+ unit buildings).
Forward outlook
- In year one you build about $40k of equity ($3k loan paydown + $37k appreciation (10.0% local appreciation)).
- Lee County population projected at +44% by 2050 — long-run rental-demand tailwind backs the buy-and-hold thesis.
- At projected returns (10.0% appreciation + 0.0% rent growth), your $104k cash investment doubles in ~3 years — after that, you're playing with house money.
- By year 2, paydown + projected appreciation supports a ~$64k cash-out refi (75% LTV) — recoverable capital for the next deal without selling this one.
Negotiation context
- It's been on market 60 days — a 3% lower offer ($359k) is reasonable based on typical stale-listing flexibility.
- 3 sale attempts since 6y ago with the ask held roughly flat each time — persistent listings suggest the price (not the market) is what's stuck; bring a comps-based counter.
- Current owner paid $240k; list at $370k implies a 54% gain — meaningful room to come down on a strong offer.
Risks & watch-outs
- Climate carrying-cost: severe wind risk, 99% chance of damaging wind over 30y; extreme-heat days projected 7→27/yr by 2055 (HVAC capex compounding) — expect insurance premiums to compound above CPI over the hold.
Questions for the listing agent
- It's been on market 60 days. Have you received any prior offers? Is the seller open to a 4% concession, seller financing, or rate buy-down credit?
- Can we see the unit-by-unit rent roll, current vacancy, and any below-market leases? What's the average tenancy length?
- What capital expenditures (roof, boiler, parking lot, exteriors) have been made in the last 5 years, and what's planned in the next 2?
- Is there a deadline driving the sale (1031 exchange, divorce, estate, relocation)? That informs how much negotiation room exists.
- Schools are D-rated, which usually means shorter tenancies and higher turnover. Who's the typical renter profile here, and what's been the actual vacancy rate?
- What's the average days-on-market for RENTAL listings here right now (not sales)? A rising rental-DOM trend means longer vacancies and softer asking-rent achievability than the comps imply.
- What's the recent tenant-quality profile in this submarket — average credit score on applications, eviction rate, late-payment / NSF rate, and stable-employment percentage? A property-management company in the area should have these aggregated.
- How much new apartment / multifamily construction is in the pipeline within 1–3 miles? Heavy new supply (>2% of stock underway) typically softens rents 12–24 months out; light construction supports rent growth.
Investment metrics
- 1% rule
- 0.96% ✗
- Cap rate
- 7.53%
- Cash-on-cash
- 4.40%
- DSCR
- 1.20
- GRM
- 8.7
CMA / ARV
- ARV (on-the-fly)
- $507,984
- Comps found
- 2
Show comp detail 2 sales within ~0.75 mi
| Address | Dist | Beds/Ba | Sqft | Sold | Price | $/sf | Match |
|---|---|---|---|---|---|---|---|
| 1145-1147 Edgerton Ave | 0.66mi | 6/4.0 | 2,364 (+6%) | 17mo | $539,900 | $228 | 45 |
| 1131 Graystone Ave | 0.63mi | 6/4.0 | 2,050 (-8%) | 20mo | $455,000 | $222 | 41 |
Match score weights: distance 35% · size 25% · config 20% · recency 20%. Top-matched comps best support the ARV.
Projected returns pro-forma
10.0% appreciation · 0.0% rent growth · sell at horizon
- IRR
- 26.4%
- Equity multiple
- 3.08×
- Total profit
- $215,308
- Equity at exit
- $333,316
- IRR
- 22.4%
- Equity multiple
- 6.76×
- Total profit
- $596,393
- Equity at exit
- $718,809
Cash invested: $103,597 (down + closing). Projections, not guarantees.
Landlord ↔ Tenant lean methodology
- Overall (STATE)
- 87 Strongly Landlord-Friendly
- State Florida
- 87 Strongly Landlord-Friendly · R+3
- County
- — inherits STATE
- City
- — inherits STATE
ZIP-level market 33974
- Home prices YoY
- 5.8%
- Rents YoY
- -4.7%
- Active inventory
- 2481
- Price-to-rent
- 17.4×
Monthly cashflow live
- Estimated rent
- $3,536 high interval (Pro) →
- Mortgage (P&I)
- −$1,940
- Tax from tax record
- −$319 /mo · $3,829/yr
- Insurance
- −$154
- HOA
- −$0
- Lot rent
- −$0
- Vacancy / Maint / Mgmt
- −$743
- Net cashflow
- $380
Break-even live
Sensitivity live
| Price | -10% $589 | -5% $485 | +0% $380 | +5% $275 | +10% $171 |
|---|---|---|---|---|---|
| Rent | -10% $101 | -5% $240 | +0% $380 | +5% $520 | +10% $659 |
| Rate | -1.0pp $566 | -0.5pp $474 | base $380 | +0.5pp $284 | +1.0pp $187 |
2-unit breakdown (identical units grouped — click to expand)
| Units | Beds | Baths | Est. rent |
|---|---|---|---|
| 2× units | 3 | 2 | $3,536 |
| #1 | 3 | 2 | $1,768 |
| #2 | 3 | 2 | $1,768 |
| Total (2 units) | $3,536 | ||
UW: 25.0% down · 7.5% · 30yr · 1.5% tax · 5.0% vac · 8.0% maint · 8.0% mgmt
Financing live
Cash to close
- Down payment
- $92,498
- Closing costs
- $11,100
- Reserves months
- —
- Total cash needed
- —
Loan-product check · same deal, 3 products live
Conventional
25% down · 7.5% · 30yr
- Down + closing
- —
- Monthly P&I
- —
- Monthly cashflow
- —
- DSCR
- —
- Eligible?
- —
Personal DTI + credit; lowest rate.
DSCR
20% down · 8.5% · 30yr
- Down + closing
- —
- Monthly P&I
- —
- Monthly cashflow
- —
- DSCR
- —
- Eligible?
- —
No personal income docs; deal must DSCR.
Hard money
10% down · 12.0% · 12mo
- Down + closing
- —
- Monthly P&I
- —
- Monthly cashflow
- —
- DSCR
- —
- Eligible?
- —
Short-term bridge; refi at stabilization.
Listing history 8 events
-
2026-02-09status Pending
-
2026-01-15price $369,990
-
2025-12-11$379,990 Active
-
2021-03-09soldstatus $240,000 Closed 429-char remark
Show marketing remark (429 chars)
Great investment opportunity to own this well-maintained income producing duplex. There are 3 bedrooms and 2 full bathrooms on each side and each unit features tile throughout. Both sides are rented so start out with a positive cash flow. The duplex also sits on an over-sized lot and is located close to 82. This property offers many possibilities. Price to sell, it won’t last long! Schedule your showing today.
-
2021-01-28status Pending 429-char remark
Show marketing remark (429 chars)
Great investment opportunity to own this well-maintained income producing duplex. There are 3 bedrooms and 2 full bathrooms on each side and each unit features tile throughout. Both sides are rented so start out with a positive cash flow. The duplex also sits on an over-sized lot and is located close to 82. This property offers many possibilities. Price to sell, it won’t last long! Schedule your showing today.
-
2021-01-17status Active 429-char remark
Show marketing remark (429 chars)
Great investment opportunity to own this well-maintained income producing duplex. There are 3 bedrooms and 2 full bathrooms on each side and each unit features tile throughout. Both sides are rented so start out with a positive cash flow. The duplex also sits on an over-sized lot and is located close to 82. This property offers many possibilities. Price to sell, it won’t last long! Schedule your showing today.
-
2020-12-31status Pending 429-char remark
Show marketing remark (429 chars)
Great investment opportunity to own this well-maintained income producing duplex. There are 3 bedrooms and 2 full bathrooms on each side and each unit features tile throughout. Both sides are rented so start out with a positive cash flow. The duplex also sits on an over-sized lot and is located close to 82. This property offers many possibilities. Price to sell, it won’t last long! Schedule your showing today.
-
2020-11-16$254,900 Active 429-char remark
Show marketing remark (429 chars)
Great investment opportunity to own this well-maintained income producing duplex. There are 3 bedrooms and 2 full bathrooms on each side and each unit features tile throughout. Both sides are rented so start out with a positive cash flow. The duplex also sits on an over-sized lot and is located close to 82. This property offers many possibilities. Price to sell, it won’t last long! Schedule your showing today.
ⓘ Source: listings_history table (triggers on properties + properties_extension) + one-shot
backfill from property_details.listing_events for pre-trigger history.
Tax reassessment forecast FL · Resets to sale price
- Current annual tax
- $3,829 · $319/mo
- Projected year-2 tax
- $3,829 · $319/mo
- Expected delta
- $0/yr ($0/mo · 0.0%)
ⓘ Screening estimate from a state-policy table — verify with the county assessor before closing.
Climate risk First Street
- Flood 1/10 Low FEMA zone X (unshaded) · 0% chance over 30 yrs
- Wildfire 3/10 Moderate
- Heat 9/10 Extreme 7 d/yr ≥109°F today · 27 d/yr by 30 yrs out
- Wind 10/10 Extreme 99% chance of damaging wind over 30 yrs
- Air quality 2/10 Low 1 unhealthy d/yr today · 2 by 30 yrs out
Nearby sold comps map
Loading sold comps map…
Walkable amenities ~0.75 mi
Loading nearby amenities…
Taxation est. · year 1
- Rental income
- $42,432
- − Mortgage interest
- −$20,725
- − Property taxes
- −$3,829
- − Insurance
- −$1,850
- − Repairs & maintenance
- −$3,395
- − Management
- −$3,395
- − Depreciation
- −$10,763
- Taxable loss
- −$1,524
- Est. tax savings @ 24.0%
- +$366
- After-tax cash flow
- $4,925/yr
For passive investors: Depreciation is non-cash, so a rental often shows a tax loss while cash-flowing — sheltering income. Rental losses are passive: they offset passive income freely, and up to $25,000/yr can offset ordinary (W-2) income if you actively participate and your MAGI is under $100k (phasing out to $0 by $150k); unused losses carry forward. On sale, claimed depreciation is recaptured at up to 25%, and gains may owe capital-gains tax (a 1031 exchange can defer both). Figures are a year-1 estimate at your 24.0% rate — not tax advice; consult a CPA.
Schools (NCES district)
- District
- Lee
- NCES district ID
- 1201080
- Math proficiency
- 47% ▼ -11.00%
- Reading proficiency
- 50% ▼ -4.00%
- Median HH income
- $49,518
- Composite
- 41.49/100
- National rank
- #3458
- State rank
- #42 of 73 in FL
Livability — Lehigh Acres
- Score
- 59/100
- State rank
- #826
- US rank
- #20055
Category grades
Schools grade is shown separately in the Schools card above.
Census & demographics
- Census place
- Lehigh Acres, FL
- County
- Lee County · 788,662 people
- City population
- 130,638
- Metro
- Cape Coral-Fort Myers, FL
- Population (ZIP)
- 19,927
- Household income
- $72,192
- Rent vs Own
- Severe rent burden
- 434.0
Population outlook (Lee County) Hauer SSP2
- Today (2025)
- 871,946 people
- By 2030
- 955,468 · +9.6%
- By 2040
- 1,113,587 · +27.7%
- By 2050
- 1,256,891 · +44.1%
- By 2075
- 1,560,270 · +78.9%
- By 2100
- 1,726,848 · +98.0%
Race, ethnicity, and origin ACS 2023
- Neighborhood character
- Diverse neighborhood (Simpson 0.64)
- Race & ethnicity
- Hispanic / Latino 52% Two or more races 31% White 26% Black 18%
- Hispanic origin (detail)
- Mexican 12% Puerto Rican 7% Cuban 20% Dominican 4%
- Common ancestry
- Hispanic 7% Italian 1% Portuguese 1%
- Foreign-born
- 32% · Canada, Jamaica
- Languages at home
- 48% English-only · Spanish 43% French/Haitian/Cajun 7% Other Indo-European 1%
Political lean MEDSL · Lee
- 2024 margin
- Strong R (+28.4) · D 35.5% · R 63.9%
- 2008→2024 swing
- -18.0pp toward R · 2008: -10.4pp · 2024: -28.4pp
- All cycles
- 2024: R+28.4 2020: R+19.2 2016: R+20.4 2012: R+16.6 2008: R+10.4
Not yet ingested
- Civics
- —
Market trends
- HPI YoY
- ▲ 16.53%
- Current HPI
- 303.3399
- Rent YoY
- ▼ -4.68%
- Metro
- Cape Coral-Fort Myers, FL
- State GDP YoY
- ▲ 3.28%
- F500 in state
- 36
Industry mix (Fortune 500 HQ in FL)
| Industry | F500 HQs | Revenue |
|---|---|---|
| Industrial Technology | 2 | $29B |
|
||
| Insurance | 2 | $17B |
|
||
| Retail | 1 | $60B |
|
||
| Technology Distribution | 1 | $58B |
|
||
| Homebuilding | 1 | $35B |
|
||
| Technology Manufacturing | 1 | $35B |
|
||
Price history
+45.2% since first listed8 events — show timeline
- 2026-02-09 Pending — FORTMLS
- 2026-01-15 Price Changed $369,990 FORTMLS
- 2025-12-11 Listed $379,990 FORTMLS
- 2021-03-09 Sold (MLS) $240,000 FORTMLS
- 2021-01-28 Pending — FORTMLS
- 2021-01-17 Relisted — FORTMLS
- 2020-12-31 Pending — FORTMLS
- 2020-11-16 Listed $254,900 FORTMLS
Property tax history
+11.7%/yrLatest (2022): $3,829 · +47.4% YoY. Source: county tax records.
Cash-flow waterfall
monthlySold comps — $/sqft
last 12 mo · ≤1 miLoading sold comps…