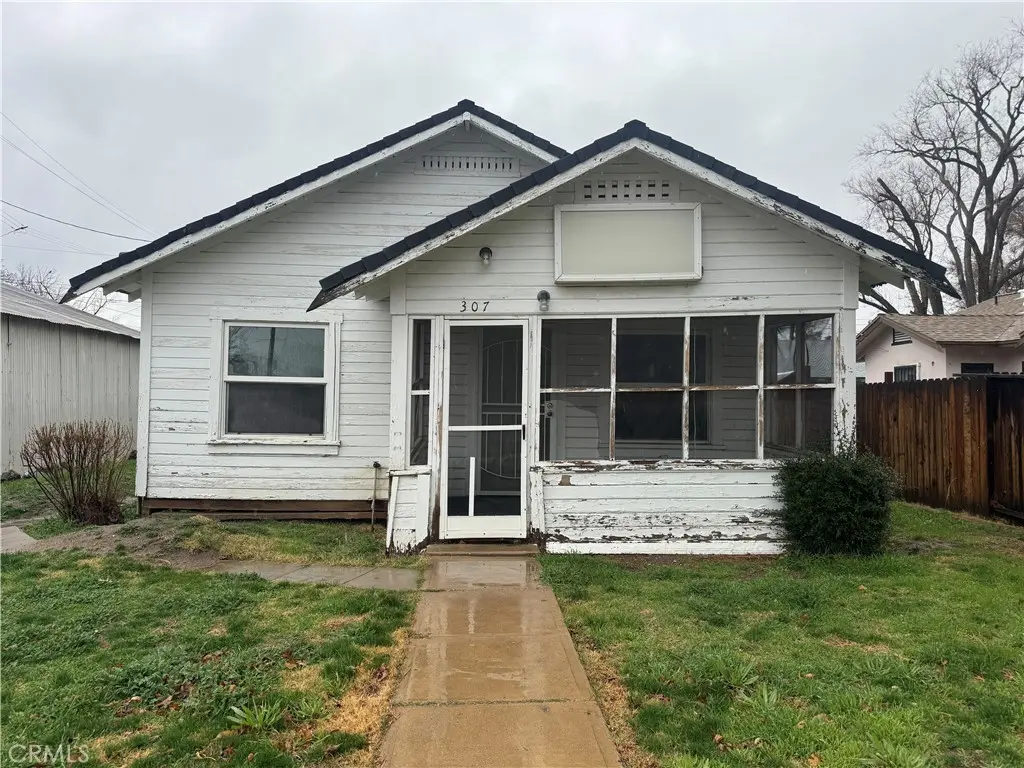
307 S Curry St · Tehachapi, CA
Flood risk 1/10 · Minimal
- FEMA flood zone
- X (shaded)
- Chance of flooding over 30 yrs
- 0.0%
- Est. flood insurance / yr
- $507 – $1,088
Fire risk 8/10 · Major
- Est. fire insurance / yr
- $659 – $1,223
Heat risk 4/10 · Minor
- Hot days now (above 90°F)
- 7 days/yr
- Hot days in 30 yrs
- 17 days/yr
Wind risk 1/10 · Minimal
- Chance of severe wind over 30 yrs
- —
Air-quality risk 8/10 · Major
- Unhealthy air days now
- 17 days/yr
- Unhealthy air days in 30 yrs
- 21 days/yr
Risk factors via First Street. Map © Google.
Why this score? — see what drove the B- grade
The composite is a weighted blend of 9 inputs, each scored 0–100. Each bar is that input's sub-score; the figure is the points it added to the 100-point composite (weight × sub-score).
- Cash flow +30.0/30.0
- DSCR +10.0/10.0
- 1% rule +8.0/10.0
- ARV discount +7.5/15.0
- Schools +3.0/10.0
- Livability +2.6/5.0
- Rent growth +2.5/5.0
- Condition / age +2.5/5.0
- Appreciation +0.0/10.0
$125,000
🖨 Deal sheet (PDF) 📄 Offer letter ✓ Due diligence
Listing remarks MLS
307 S Curry St is an in-town Tehachapi home with a downtown-close location and quick Hwy 58 access. 2 bedrooms, 1 bathroom, approx. 795 sq ft, built 1929, on an approx. 3,485 sq ft lot. Single-level layout with kitchen + laundry area and two bedrooms. Composition roof. Zoning noted as R1 (buyer to verify allowable uses, setbacks, and any development standards). EZ access to City events, shopping, and schools. No garage. Solid option for an investor rental hold or a buyer looking for a smaller footprint in a central Tehachapi location. Buyer to verify all information including square footage, lot size, zoning, utilities, permits, and property condition. Property is being sold "as-is" and will require rehabilitation to bring into compliance with City correction requirements. Buyer to perform their own due diligence and will be required to enter into an agreement with the City of Tehachapi to repair the property as a condition of Court approval.
Key facts
- Quick hwy 58 access
- Access to shopping
- Single-level layout
Tags
Neighborhood map
What this means for you Summary
Snapshot
- This is a 2-bed/1.0-bath single-family listed at $125k.
Deal economics
- At list price, monthly cash flow is $525 ($6k/yr) — positive.
- The deal already cash-flows at list — no discount required.
- Meets the 1% rule at list price ($2k rent vs $125k).
- Recommended offer: $121k (3.0% below list) — sets the bar for market timing.
- Cap rate 11.3% vs local median 3.5% in Tehachapi — top-decile yield for the area; either an underpriced asset or a hidden risk that comps aren't pricing in. Stress-test before assuming the spread holds.
Location & tenants
- Location reads 51/100 on livability (#1,093 in CA) — a working-class tenant base; expect higher turnover. Strengths: housing A; Watch: employment D+, crime F, amenities F.
- Tehachapi Unified (town): math 26% / reading 40% proficiency, ranked #285 of 517 in CA (top 55%) — families likely to look elsewhere, expect single-tenant / working-renter base with shorter leases.
- Zoned schools: Tompkins Elementary (math 26% / reading 32%, grade F, #891 of 1,571 statewide, top 57%, 642 students, 44% FRL); Jacobsen Middle (math 20% / reading 38%, grade F, #224 of 498 statewide, top 46%, 917 students, 33% FRL); Tehachapi High (math 32% / reading 57%, grade F, #434 of 1,170 statewide, top 39%, 1,254 students, 32% FRL) — zoned schools at 36% FRL track the district average.
- Market conditions: Rents flat; 658 active listings in the ZIP; 11 comparable units currently listed for rent nearby; rentals leasing fast (median 5d on market — plan ~1-2 weeks tenant-placement turnaround); solid renter incomes; 3,244 units permitted in Kern County in 2024 (73 in 5+ unit buildings).
Forward outlook
- Local home prices are declining (-3.0%/yr); year-one equity from $864 of loan paydown is wiped out by about $4k of value loss. Plan a longer hold.
- Kern County population projected at +17% by 2050 — long-run rental-demand tailwind backs the buy-and-hold thesis.
- At projected returns (-3.0% appreciation + 0.1% rent growth), your $35k cash investment doubles in ~9 years — after that, you're playing with house money.
Negotiation context
- It's been on market 57 days — a 3% lower offer ($121k) is reasonable based on typical stale-listing flexibility.
- 3 sale attempts with the ask held roughly flat each time — persistent listings suggest the price (not the market) is what's stuck; bring a comps-based counter.
- Current owner paid $25k; list at $125k implies a 400% gain — meaningful room to come down on a strong offer.
Risks & watch-outs
- Watch-outs: built in 1929 — expect roof / HVAC / electrical / plumbing capex.
- Climate carrying-cost: severe wildfire risk — expect insurance premiums to compound above CPI over the hold.
Questions for the listing agent
- It's been on market 57 days. Have you received any prior offers? Is the seller open to a 3% concession, seller financing, or rate buy-down credit?
- Built in 1929 — when were the roof, HVAC, electrical panel, plumbing, and water heater last replaced?
- Is there a deadline driving the sale (1031 exchange, divorce, estate, relocation)? That informs how much negotiation room exists.
- Schools are F-rated, which usually means shorter tenancies and higher turnover. Who's the typical renter profile here, and what's been the actual vacancy rate?
- Crime grade is F in this area — have there been break-ins, vandalism, or insurance claims at this property in the last 3 years? What carrier currently insures it and at what premium?
- What's the average days-on-market for RENTAL listings here right now (not sales)? A rising rental-DOM trend means longer vacancies and softer asking-rent achievability than the comps imply.
- What's the recent tenant-quality profile in this submarket — average credit score on applications, eviction rate, late-payment / NSF rate, and stable-employment percentage? A property-management company in the area should have these aggregated.
- How much new for-sale + rental construction is in the pipeline within 1–3 miles? Heavy new supply typically softens prices + rents 12–24 months out; constrained supply supports both.
Investment metrics
- 1% rule
- 1.30% ✓
- Cap rate
- 11.34%
- Cash-on-cash
- 18.01%
- DSCR
- 1.80
- GRM
- 6.4
CMA / ARV
- ARV (median comp)
- $258,126
- List price
- $125,000
- Delta
- -51.57%
- Verdict
- UNDERPRICED
- Comps
- 20 within 1.0 mi
Show comp detail 4 sales within ~0.75 mi
| Address | Dist | Beds/Ba | Sqft | Sold | Price | $/sf | Match |
|---|---|---|---|---|---|---|---|
| 28250 Griffin St | 0.65mi | 2/1.0 | 788 (-1%) | 5mo | $185,000 | $235 | 64 |
| 131 W H St | 0.27mi | 3/1.0 (+1) | 836 (+5%) | 13mo | $165,000 | $197 | 63 |
| 225 E H St | 0.37mi | 2/1.0 | 773 (-3%) | 23mo | $275,000 | $356 | 59 |
| 909 S Curry St | 0.60mi | 2/1.0 | 688 (-14%) | 6mo | $240,000 | $349 | 44 |
Match score weights: distance 35% · size 25% · config 20% · recency 20%. Top-matched comps best support the ARV.
Projected returns pro-forma
-3.0% appreciation · 0.05% rent growth · sell at horizon
- IRR
- 6.4%
- Equity multiple
- 1.24×
- Total profit
- $8,464
- Equity at exit
- $18,638
- IRR
- 13.2%
- Equity multiple
- 1.92×
- Total profit
- $32,110
- Equity at exit
- $10,808
Cash invested: $35,000 (down + closing). Projections, not guarantees.
Landlord ↔ Tenant lean methodology
- Overall (STATE)
- 18 Strongly Tenant-Friendly
- State California
- 18 Strongly Tenant-Friendly · D+13
- County
- — inherits STATE
- City
- — inherits STATE
ZIP-level market 93561
- Home prices YoY
- -23.9%
- Rents YoY
- 0.1%
- Active inventory
- 658
- Price-to-rent
- 6.4×
Monthly cashflow live
- Estimated rent
- $1,631 high interval (Pro) →
- Mortgage (P&I)
- −$656
- Tax from tax record
- −$56 /mo · $668/yr
- Insurance
- −$52
- HOA
- −$0
- Vacancy / Maint / Mgmt
- −$343
- Net cashflow
- $525
Break-even live
Sensitivity live
| Price | -10% $596 | -5% $561 | +0% $525 | +5% $490 | +10% $455 |
|---|---|---|---|---|---|
| Rent | -10% $396 | -5% $461 | +0% $525 | +5% $590 | +10% $654 |
| Rate | -1.0pp $588 | -0.5pp $557 | base $525 | +0.5pp $493 | +1.0pp $460 |
UW: 25.0% down · 7.5% · 30yr · 1.5% tax · 5.0% vac · 8.0% maint · 8.0% mgmt
Financing live
Cash to close
- Down payment
- $31,250
- Closing costs
- $3,750
- Reserves months
- —
- Total cash needed
- —
Loan-product check · same deal, 3 products live
Conventional
25% down · 7.5% · 30yr
- Down + closing
- —
- Monthly P&I
- —
- Monthly cashflow
- —
- DSCR
- —
- Eligible?
- —
Personal DTI + credit; lowest rate.
DSCR
20% down · 8.5% · 30yr
- Down + closing
- —
- Monthly P&I
- —
- Monthly cashflow
- —
- DSCR
- —
- Eligible?
- —
No personal income docs; deal must DSCR.
Hard money
10% down · 12.0% · 12mo
- Down + closing
- —
- Monthly P&I
- —
- Monthly cashflow
- —
- DSCR
- —
- Eligible?
- —
Short-term bridge; refi at stabilization.
Rent comps 11 comps
| Address | Beds | Baths | Sqft | Rent | $/sqft | DOM | Units | Dist |
|---|---|---|---|---|---|---|---|---|
| 207 E E St Tehachapi, CA | 2.0 | 1.0 | 704 | $1,300 | $1.85 | 45d | 1 | 0.24mi |
| 217 E I St Tehachapi, CA | 2.0 | 1.0 | 854 | $1,795 | $2.10 | 4d | 1 | 0.41mi |
| 212 E J St Tehachapi, CA | 1.0 | 1.0 | 690 | $1,350 | $1.96 | 4d | 1 | 0.43mi |
| 420 N Mill St Tehachapi, CA | 2.0 | 1.0 | 850 | $1,875 | $2.21 | 4d | 1 | 0.49mi |
| 516 Valley Blvd Apt 8 Tehachapi, CA | 2.0 | 1.0 | 790 | $1,325 | $1.68 | 4d | 1 | 0.53mi |
| 814 Aspen Dr Apt A Tehachapi, CA | 2.0 | 1.0 | 800 | $1,575 | $1.97 | 45d | 1 | 0.67mi |
| 630 Cherry Ln Unit 642A Tehachapi, CA | 2.0 | 2.0 | 1032 | $1,599 | $1.55 | 25d | 1 | 0.81mi |
| 630 Cherry Ln Unit 634B Tehachapi, CA | 1.0 | 1.0 | 758 | $1,399 | $1.85 | 22d | 1 | 0.81mi |
| 630 Cherry Ln Tehachapi, CA | 2.0 | 2.0 | 1032 | $1,549 | $1.50 | 45d | 1 | 0.81mi |
| 600 Cherry Ln Tehachapi, CA | 2.0 | 1.0 | 720 | $1,475 | $2.05 | 4d | 1 | 0.82mi |
| 49500 Alan Ave Tehachapi, CA | 3.0 | 2.0 | 936 | $2,200 | $2.35 | 4d | 1 | 1.08mi |
Listing history 4 events
-
2026-03-29$125,000 Active 966-char remark
Show marketing remark (966 chars)
307 S Curry St is an in-town Tehachapi home with a downtown-close location and quick Hwy 58 access. 2 bedrooms, 1 bathroom, approx. 795 sq ft, built 1929, on an approx. 3,485 sq ft lot. Single-level layout with kitchen + laundry area and two bedrooms. Composition roof. Zoning noted as R1 (buyer to verify allowable uses, setbacks, and any development standards). EZ access to City events, shopping, and schools. No garage. Solid option for an investor rental hold or a buyer looking for a smaller footprint in a central Tehachapi location. Buyer to verify all information including square footage, lot size, zoning, utilities, permits, and property condition. Property is being sold "as-is" and will require rehabilitation to bring into compliance with City correction requirements. Buyer to perform their own due diligence and will be required to enter into an agreement with the City of Tehachapi to repair the property as a condition of Court approval.
-
2026-02-09$125,000 Active
-
2025-10-23$125,000 Active
-
1995-11-17soldstatus $25,000
ⓘ Source: listings_history table (triggers on properties + properties_extension) + one-shot
backfill from property_details.listing_events for pre-trigger history.
Tax reassessment forecast CA · Resets to sale price
- Current annual tax
- $668 · $56/mo
- Projected year-2 tax
- $950 · $79/mo
- Expected delta
- +$282/yr (+$23/mo · 42.2%)
ⓘ Screening estimate from a state-policy table — verify with the county assessor before closing.
Climate risk First Street
- Flood 1/10 Low FEMA zone X (shaded) · 0% chance over 30 yrs
- Wildfire 8/10 Severe
- Heat 4/10 Moderate 7 d/yr ≥90°F today · 17 d/yr by 30 yrs out
- Wind 1/10 Low
- Air quality 8/10 Severe 17 unhealthy d/yr today · 21 by 30 yrs out
Nearby sold comps map
Loading sold comps map…
Walkable amenities ~0.75 mi
Loading nearby amenities…
Taxation est. · year 1
- Rental income
- $19,574
- − Mortgage interest
- −$7,002
- − Property taxes
- −$668
- − Insurance
- −$625
- − Repairs & maintenance
- −$1,566
- − Management
- −$1,566
- − Depreciation
- −$3,636
- Taxable income
- $4,511
- Est. tax owed @ 24.0%
- −$1,083
- After-tax cash flow
- $5,222/yr
For passive investors: Depreciation is non-cash, so a rental often shows a tax loss while cash-flowing — sheltering income. Rental losses are passive: they offset passive income freely, and up to $25,000/yr can offset ordinary (W-2) income if you actively participate and your MAGI is under $100k (phasing out to $0 by $150k); unused losses carry forward. On sale, claimed depreciation is recaptured at up to 25%, and gains may owe capital-gains tax (a 1031 exchange can defer both). Figures are a year-1 estimate at your 24.0% rate — not tax advice; consult a CPA.
Schools (NCES district)
- District
- Tehachapi Unified
- NCES district ID
- 0638880
- Math proficiency
- 26% ▼ -5.00%
- Reading proficiency
- 40% ▼ -6.00%
- Median HH income
- $59,230
- Composite
- 29.52/100
- National rank
- #6497
- State rank
- #285 of 517 in CA
Livability — Tehachapi
- Score
- 51/100
- State rank
- #1093
- US rank
- #25419
Category grades
Schools grade is shown separately in the Schools card above.
Census & demographics
- Census place
- Tehachapi, CA
- County
- Kern County · 710,371 people
- City population
- 31,175
- Metro
- Bakersfield, CA
- Population (ZIP)
- 31,175
- Household income
- $87,357
- Rent vs Own
- Severe rent burden
- 568.0
Population outlook (Kern County) Hauer SSP2
- Today (2025)
- 947,286 people
- By 2030
- 978,984 · +3.3%
- By 2040
- 1,045,018 · +10.3%
- By 2050
- 1,105,232 · +16.7%
- By 2075
- 1,229,538 · +29.8%
- By 2100
- 1,238,059 · +30.7%
Race, ethnicity, and origin ACS 2023
- Neighborhood character
- Predominantly White (68%)
- Race & ethnicity
- White 68% Hispanic / Latino 24% Two or more races 9% Asian 2% Native American 1%
- Hispanic origin (detail)
- Mexican 21%
- Common ancestry
- Italian 6% Lithuanian 3% Slovak 3%
- Foreign-born
- 10% · Canada, China
- Languages at home
- 83% English-only · Spanish 13% Chinese 1% Other Indo-European 1%
Political lean MEDSL · Kern
- 2024 margin
- Strong R (+21.1) · D 38.2% · R 59.3% · Other 2.5%
- 2008→2024 swing
- -3.3pp toward R · 2008: -17.8pp · 2024: -21.1pp
- All cycles
- 2024: R+21.1 2020: R+10.2 2016: R+15.0 2012: R+20.9 2008: R+17.8
Not yet ingested
- Civics
- —
Market trends
- HPI YoY
- ▼ -116.70%
- Current HPI
- 371.6546
- Rent YoY
- ▬ 0.05%
- Metro
- Bakersfield, CA
- State GDP YoY
- ▲ 3.21%
- F500 in state
- 116
Industry mix (Fortune 500 HQ in CA)
| Industry | F500 HQs | Revenue |
|---|---|---|
| Technology | 27 | $1,492B |
|
||
| Financial Services | 3 | $174B |
|
||
| Retail | 3 | $44B |
|
||
| Insurance | 3 | $26B |
|
||
| Media / Entertainment | 2 | $115B |
|
||
| Pharmaceuticals / Biotech | 2 | $62B |
|
||
Price history
+400.0% since first listed4 events — show timeline
- 2026-03-29 Listed $125,000 CRMLS
- 2026-02-09 Listed $125,000 SSMLS
- 2025-10-23 Listed $125,000 TAAR
- 1995-11-17 Sold (Public Records) $25,000 Public Records
Property tax history
+2.8%/yrLatest (2025): $668 · +1.3% YoY. Source: county tax records.
Cash-flow waterfall
monthlySold comps — $/sqft
last 12 mo · ≤1 miLoading sold comps…