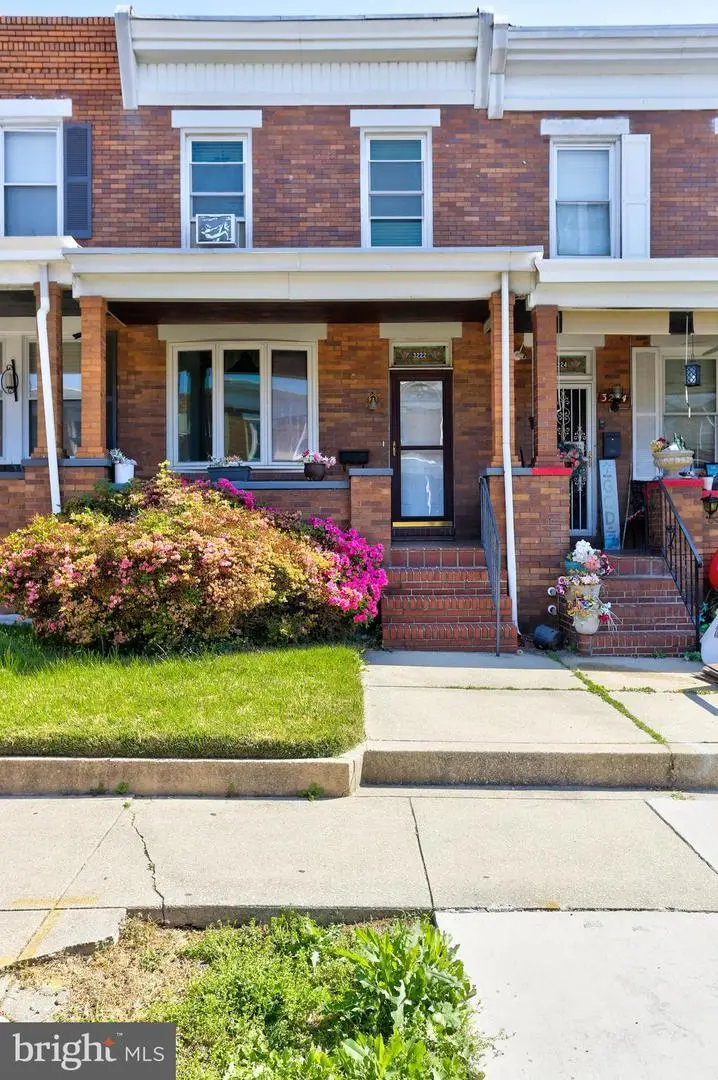
3222 Chesterfield Ave · Baltimore, MD
Flood risk 8/10 · Major
- FEMA flood zone
- X (unshaded)
- Chance of flooding over 30 yrs
- 0.99%
- Est. flood insurance / yr
- $473 – $860
Fire risk 1/10 · Minimal
- Est. fire insurance / yr
- $755 – $1,403
Heat risk 8/10 · Major
- Hot days now (above 103°F)
- 7 days/yr
- Hot days in 30 yrs
- 15 days/yr
Wind risk 6/10 · Moderate
- Chance of severe wind over 30 yrs
- 27.0%
Air-quality risk 4/10 · Minor
- Unhealthy air days now
- 6 days/yr
- Unhealthy air days in 30 yrs
- 7 days/yr
Risk factors via First Street. Map © Google.
Why this score? — see what drove the B+ grade
The composite is a weighted blend of 9 inputs, each scored 0–100. Each bar is that input's sub-score; the figure is the points it added to the 100-point composite (weight × sub-score).
- Cash flow +30.0/30.0
- ARV discount +14.6/15.0
- DSCR +10.0/10.0
- 1% rule +9.6/10.0
- Appreciation +4.7/10.0
- Rent growth +3.8/5.0
- Livability +3.8/5.0
- Condition / age +2.5/5.0
- Schools +1.0/10.0
$114,900
🖨 Deal sheet 📄 Offer letter ✓ Due diligence
Listing remarks
Back on the market after buyer financing fell through. .. "Coastline Mortgage is offering a one year 1% rate buydown" Beautifully maintained and full of classic Baltimore charm, this all-brick porch-front townhouse in Belair-Edison is a must-see. From the inviting covered front porch to the timeless brick exterior, this home offers warmth, character, and everyday practicality. Notable features include lead-free thermal replacement windows and an efficient replacement gas heating system, offering added comfort and peace of mind. Ideally situated near neighborhood amenities, parks, schools, shopping, public transportation, and commuter routes, the location is as convenient as it is
Key facts
- Built 1928
- Listed 22 days
Property features AI
Finance
- Other: Fee simple ownership
- HOA & community: Other fees frequency: Unknown
Exterior
- Parking: Off-street parking
- Utilities: Public water; Public sewer; Natural gas hot water
- Home design: Interior townhouse / rowhouse; Above-grade finished area (per assessor): 1,100 sq. ft.; Below-grade total area (per assessor): 616
- Construction: Brick construction; Block foundation; Built-up roof
- Exterior features: Corner lot; Other exterior features
Interior
- Kitchen: Gas oven/range
- Bedrooms: Two bedrooms on the first upper level; Master bedroom
- Flooring: Wood floors
- Bathrooms: One full bathroom
- Heating & cooling: Radiator heating (natural gas); Window air conditioning units (electric)
- Interior features: Dining area; Window treatments; Wood floors; Double-pane windows
- Laundry & utility: Laundry room; Utility room; Basement (other type)
Neighborhood map
What this means for you Summary
Snapshot
- This is a 2-bed/1.0-bath townhouse listed at $115k.
Deal economics
- At list price, monthly cash flow is $460 ($6k/yr) — positive.
- The deal already cash-flows at list — no discount required.
- Meets the 1% rule at list price ($2k rent vs $115k).
- Recommended offer: $113k (1.5% below list) — sets the bar for market timing.
- Cap rate 11.7% vs local median 6.0% in Baltimore — top-decile yield for the area; either an underpriced asset or a hidden risk that comps aren't pricing in. Stress-test before assuming the spread holds.
Location & tenants
- Location reads 76/100 on livability (#90 in MD, #3,396 nationally) — a middle-class / working-renter tenant base. Strengths: amenities A+, commute A+, housing A+; Watch: schools D, crime F.
- Baltimore City Public Schools (urban): math 7% / reading 16% proficiency, ranked #24 of 24 in MD (top 100%) — low school quality limits family demand, transient renter base, plan for 1-2y turnover; 79% free/reduced lunch — lower-income household profile, screen leases tightly.
- Market conditions: Rents rising fast (+5.2%/yr); 319 active listings in the ZIP; 40 comparable units currently listed for rent nearby; rentals at typical pace (median 24d on market — plan ~3-4 weeks tenant-placement turnaround); 1,273 units permitted in Baltimore city in 2024 (1,104 in 5+ unit buildings).
- This rent runs 39% of the median local income ($51k/yr) — at the standard rent-burdened threshold; future hikes will face affordability resistance.
Forward outlook
- In year one you build about $141 of equity ($794 loan paydown + $-653 appreciation (-0.6% local appreciation)).
- Baltimore County population projected to shrink 4% by 2050 — rents likely to lag national; underwrite the cash flow, not the appreciation.
- At projected returns (-0.6% appreciation + 5.2% rent growth), your $32k cash investment doubles in ~5 years — after that, you're playing with house money.
Negotiation context
- It's been on market 22 days — a 2% lower offer ($113k) is reasonable based on typical stale-listing flexibility.
- 3 sale attempts since 30y ago with the ask held roughly flat each time — persistent listings suggest the price (not the market) is what's stuck; bring a comps-based counter.
- Current owner paid $50k; list at $115k implies a 130% gain — meaningful room to come down on a strong offer.
Risks & watch-outs
- Watch-outs: flood insurance adds $56/mo; built in 1928 — expect roof / HVAC / electrical / plumbing capex.
- Climate carrying-cost: severe flood risk; major wind risk, 27% chance of damaging wind over 30y; extreme-heat days projected 7→15/yr by 2055 (HVAC capex compounding) — expect insurance premiums to compound above CPI over the hold.
Questions for the listing agent
- Built in 1928 — when were the roof, HVAC, electrical panel, plumbing, and water heater last replaced?
- What's the actual annual flood-insurance premium (NFIP or private), and is the property in a SFHA with mandatory coverage?
- Is there a deadline driving the sale (1031 exchange, divorce, estate, relocation)? That informs how much negotiation room exists.
- Schools are D-rated, which usually means shorter tenancies and higher turnover. Who's the typical renter profile here, and what's been the actual vacancy rate?
- Crime grade is F in this area — have there been break-ins, vandalism, or insurance claims at this property in the last 3 years? What carrier currently insures it and at what premium?
- What's the average days-on-market for RENTAL listings here right now (not sales)? A rising rental-DOM trend means longer vacancies and softer asking-rent achievability than the comps imply.
- What's the recent tenant-quality profile in this submarket — average credit score on applications, eviction rate, late-payment / NSF rate, and stable-employment percentage? A property-management company in the area should have these aggregated.
- How much new for-sale + rental construction is in the pipeline within 1–3 miles? Heavy new supply typically softens prices + rents 12–24 months out; constrained supply supports both.
Investment metrics
- 1% rule
- 1.46% ✓
- Cap rate
- 11.68%
- Cash-on-cash
- 19.23%
- DSCR
- 1.86
- GRM
- 5.7
CMA / ARV
- ARV (median comp)
- $136,265
- List price
- $114,900
- Delta
- -15.68%
- Verdict
- UNDERPRICED
- Comps
- 20 within 1.0 mi
Show comp detail 12 sales within ~0.75 mi
| Address | Dist | Beds/Ba | Sqft | Sold | Price | $/sf | Match |
|---|---|---|---|---|---|---|---|
| 3131 Chesterfield Ave | 0.06mi | 2/1.0 | 1,068 (-3%) | 1mo | $75,000 | $70 | 92 |
| 3802 Lyndale Ave | 0.40mi | 2/1.5 | 1,050 (-4%) | 1mo | $160,000 | $152 | 71 |
| 3805 Elmora Ave | 0.48mi | 3/2.0 (+1) | 1,096 (-0%) | 1mo | $11,700 | $11 | 67 |
| 4000 Balfern Ave | 0.55mi | 3/1.5 (+1) | 1,120 (+2%) | 1mo | $157,000 | $140 | 63 |
| 3532 Cliftmont Ave | 0.25mi | 3/2.0 (+1) | 1,200 (+9%) | 2mo | $168,000 | $140 | 63 |
| 3838 Lyndale Ave | 0.41mi | 2/2.0 | 1,190 (+8%) | 2mo | $113,500 | $95 | 62 |
| 4102 Dudley Ave | 0.61mi | 3/1.5 (+1) | 1,120 (+2%) | 2mo | $165,000 | $147 | 60 |
| 4603 Chatford Ave | 0.50mi | 3/1.5 (+1) | 1,170 (+6%) | 1mo | $205,000 | $175 | 58 |
| 3236 Lyndale Ave | 0.71mi | 3/1.0 (+1) | 1,080 (-2%) | 2mo | $161,855 | $150 | 58 |
| 4117 Eastmont Ave | 0.62mi | 3/2.0 (+1) | 1,176 (+7%) | 1mo | $224,900 | $191 | 50 |
| 2821 Erdman Ave | 0.50mi | 2/2.0 | 1,260 (+14%) | 0mo | $75,000 | $60 | 48 |
| 4128 Balfern Ave | 0.65mi | 3/1.5 (+1) | 1,008 (-8%) | 2mo | $177,000 | $176 | 47 |
Match score weights: distance 35% · size 25% · config 20% · recency 20%. Top-matched comps best support the ARV.
Projected returns pro-forma
-0.57% appreciation · 5.25% rent growth · sell at horizon
- IRR
- 17.5%
- Equity multiple
- 1.83×
- Total profit
- $26,856
- Equity at exit
- $30,137
- IRR
- 24.2%
- Equity multiple
- 3.79×
- Total profit
- $89,788
- Equity at exit
- $33,742
Cash invested: $32,172 (down + closing). Projections, not guarantees.
Landlord ↔ Tenant lean methodology
- Overall (CITY)
- 12 Strongly Tenant-Friendly
- State Maryland
- 27 Tenant-Leaning · D+14
- County
- — inherits STATE
- City Baltimore
- 12 Strongly Tenant-Friendly · D+58
ZIP-level market 21213
- Home prices YoY
- -0.1%
- Rents YoY
- 5.2%
- Active inventory
- 319
- Price-to-rent
- 5.7×
Monthly cashflow live
- Estimated rent
- $1,675 high interval (Pro) →
- Mortgage (P&I)
- −$603
- Tax from tax record
- −$157 /mo · $1,884/yr
- Insurance
- −$48
- Flood insurance flood zone
- −$56 /mo · $666/yr
- HOA
- −$0
- Vacancy / Maint / Mgmt
- −$352
- Net cashflow
- $460
Break-even live
UW: 25.0% down · 7.5% · 30yr · 1.5% tax · 5.0% vac · 8.0% maint · 8.0% mgmt
Financing live
Cash to close
- Down payment
- $28,725
- Closing costs
- $3,447
- Reserves months
- —
- Total cash needed
- —
Loan-product check · same deal, 3 products live
Conventional
25% down · 7.5% · 30yr
- Down + closing
- —
- Monthly P&I
- —
- Monthly cashflow
- —
- DSCR
- —
- Eligible?
- —
Personal DTI + credit; lowest rate.
DSCR
20% down · 8.5% · 30yr
- Down + closing
- —
- Monthly P&I
- —
- Monthly cashflow
- —
- DSCR
- —
- Eligible?
- —
No personal income docs; deal must DSCR.
Hard money
10% down · 12.0% · 12mo
- Down + closing
- —
- Monthly P&I
- —
- Monthly cashflow
- —
- DSCR
- —
- Eligible?
- —
Short-term bridge; refi at stabilization.
Rent comps 40 comps
| Address | Beds | Baths | Sqft | Rent | $/sqft | DOM | Units | Dist |
|---|---|---|---|---|---|---|---|---|
| 3305 Dudley Ave Baltimore, MD | 3.0 | 2.0 | 1413 | $1,950 | $1.38 | 43d | 1 | 0.10mi |
| 3028 Kenyon Ave Baltimore, MD | 2.0 | 2.0 | 1075 | $1,395 | $1.30 | 43d | 1 | 0.12mi |
| 2848 Pelham Ave Baltimore, MD | 3.0 | 2.0 | 1164 | $1,700 | $1.46 | 43d | 1 | 0.26mi |
| 3544 Chesterfield Ave Baltimore, MD | 3.0 | 1.5 | 1200 | $1,635 | $1.36 | 43d | 1 | 0.28mi |
| 3410 Belair Rd Unit 2/B Baltimore, MD | 1.0 | 1.0 | 742 | $1,225 | $1.65 | 4d | 1 | 0.28mi |
| 2817 Pelham Ave Baltimore, MD | 3.0 | 2.0 | 1464 | $1,950 | $1.33 | 24d | 1 | 0.31mi |
| 3551 Shannon Dr Baltimore, MD | 3.0 | 2.0 | 1485 | $2,358 | $1.59 | 24d | 1 | 0.33mi |
| 3566 Dudley Ave Baltimore, MD | 2.0 | 1.0 | 896 | $1,800 | $2.01 | 24d | 1 | 0.33mi |
| 2828 Lake Ave Baltimore, MD | 3.0 | 2.0 | 1164 | $1,850 | $1.59 | 4d | 1 | 0.34mi |
| 4320 Sheldon Ave Baltimore, MD | 3.0 | 1.5 | 1280 | $1,800 | $1.41 | 24d | 1 | 0.38mi |
| 3436 Cardenas Ave Baltimore, MD | 2.0 | 1.0 | 1146 | $1,395 | $1.22 | 43d | 1 | 0.39mi |
| 3610 Elmley Ave Baltimore, MD | 2.0 | 1.5 | 1200 | $1,550 | $1.29 | 20d | 1 | 0.40mi |
| 3515 Parklawn Ave Baltimore, MD | 3.0 | 2.0 | 1240 | $1,700 | $1.37 | 2d | 1 | 0.41mi |
| 3646 Lyndale Ave Baltimore, MD | 2.0 | 1.5 | 840 | $1,475 | $1.76 | 43d | 1 | 0.42mi |
| 4400 Asbury Ave Baltimore, MD | 3.0 | 2.0 | 1270 | $1,995 | $1.57 | 4d | 1 | 0.46mi |
| 4024 Eierman Ave Baltimore, MD | 3.0 | 2.0 | 1136 | $1,825 | $1.61 | 43d | 1 | 0.50mi |
| 3512 Elmora Ave Baltimore, MD | 3.0 | 1.5 | 1472 | $1,900 | $1.29 | 20d | 1 | 0.55mi |
| 3902 Erdman Ave Unit 1 Baltimore, MD | 2.0 | 1.0 | 1000 | $1,275 | $1.27 | 24d | 1 | 0.56mi |
| 3902 Erdman Ave Unit 2 Baltimore, MD | 1.0 | 1.0 | 700 | $1,175 | $1.68 | 15d | 1 | 0.56mi |
| 3914 Erdman Ave #1 Baltimore, MD | 3.0 | 1.0 | 1200 | $1,319 | $1.10 | 18d | 1 | 0.58mi |
| 4409 Moravia Rd Baltimore, MD | 2.0 | 1.0 | 861 | $1,385 | $1.61 | 43d | 3 | 0.61mi |
| 4022 Ardley Ave Baltimore, MD | 2.0 | 1.0 | 896 | $1,750 | $1.95 | 43d | 1 | 0.63mi |
| 4116 Raymonn Ave Baltimore, MD | 3.0 | 1.5 | 1244 | $1,950 | $1.57 | 43d | 1 | 0.66mi |
| 3335 Lyndale Ave Baltimore, MD | 2.0 | 2.0 | 1344 | $1,600 | $1.19 | 24d | 1 | 0.67mi |
| 3317 Lyndale Ave Baltimore, MD | 3.0 | 1.0 | 900 | $1,300 | $1.44 | 43d | 1 | 0.69mi |
| 3315 Lyndale Ave Baltimore, MD | 2.0 | 1.5 | 896 | $1,650 | $1.84 | 18d | 1 | 0.69mi |
| 3339 Elmora Ave Baltimore, MD | 3.0 | 2.0 | 896 | $1,600 | $1.79 | 43d | 1 | 0.69mi |
| 3326 Elmora Ave Baltimore, MD | 3.0 | 1.0 | 1200 | $1,450 | $1.21 | 24d | 1 | 0.69mi |
| 3343 Ravenwood Ave Unit 3343 Baltimore, MD | 2.0 | 2.0 | 948 | $1,855 | $1.96 | 18d | 1 | 0.72mi |
| 3222 Lyndale Ave Unit 1 Baltimore, MD | 3.0 | 1.5 | 1500 | $2,200 | $1.47 | 12d | 1 | 0.72mi |
| 3322 Ravenwood Ave Baltimore, MD | 3.0 | 2.0 | 932 | $1,800 | $1.93 | 24d | 1 | 0.73mi |
| 3213 Elmley Ave Baltimore, MD | 2.0 | 1.0 | 1188 | $1,395 | $1.17 | 43d | 1 | 0.73mi |
| 3218 Lyndale Ave Baltimore, MD | 3.0 | 1.5 | 1020 | $1,500 | $1.47 | 24d | 1 | 0.73mi |
| 3221 Lyndale Ave Baltimore, MD | 2.0 | 2.0 | 1020 | $1,700 | $1.67 | 24d | 1 | 0.74mi |
| 2113 Belair Rd Baltimore, MD | 3.0 | 1.0 | 1344 | $1,795 | $1.34 | 43d | 1 | 0.82mi |
| 4300 Orchard Ridge Blvd Baltimore, MD | 1.0–3.0 | 1.0–2.0 | 1021 | $1,420 | $1.39 | 43d | 1 | 0.82mi |
| 4901 Gunther Ave Baltimore, MD | 1.0–3.0 | 1.0–2.0 | 742 | $1,120 | $1.51 | 2d | 1 | 0.91mi |
| 4517 Woodlea Ave Baltimore, MD | 2.0 | 2.0 | 1326 | $1,900 | $1.43 | 2d | 1 | 0.92mi |
| 5305 Moravia Rd Baltimore, MD | 3.0 | 1.0 | 679 | $1,565 | $2.30 | 2d | 1 | 0.96mi |
| 5731 Denwood Ave Baltimore, MD | 3.0 | 1.5 | 1152 | $1,700 | $1.48 | 22d | 1 | 1.08mi |
Listing history 13 events
-
2026-06-18days on market $114,900 Active 22 DOM
-
2026-06-17days on market $114,900 Active 21 DOM
-
2026-06-16statusdays on market $114,900 Active 20 DOM
-
2026-06-02status $114,900 Pending 19 DOM
-
2026-06-01days on market $114,900 Active 19 DOM
-
2026-05-31days on market $114,900 Active 18 DOM
-
2026-05-14$114,900 Active 706-char remark
-
2026-05-09historical $114,900 706-char remark
-
1996-06-21soldstatus $49,900
-
1996-06-21soldstatus $49,900
-
1996-05-29soldstatus $49,900
-
1996-04-02historical
-
1996-03-24$49,900
ⓘ Source: listings_history table (triggers on properties + properties_extension) + one-shot
backfill from property_details.listing_events for pre-trigger history.
Tax reassessment forecast MD · Partial reset (capped growth)
- Current annual tax
- $1,884 · $157/mo
- Projected year-2 tax
- $1,884 · $157/mo
- Expected delta
- $0/yr ($0/mo · -0.0%)
ⓘ Screening estimate from a state-policy table — verify with the county assessor before closing.
Climate risk First Street
- Flood 8/10 Severe FEMA zone X (unshaded) · 99% chance over 30 yrs
- Wildfire 1/10 Low
- Heat 8/10 Severe 7 d/yr ≥103°F today · 15 d/yr by 30 yrs out
- Wind 6/10 Major 27% chance of damaging wind over 30 yrs
- Air quality 4/10 Moderate 6 unhealthy d/yr today · 7 by 30 yrs out
Nearby sold comps map
Loading sold comps map…
Walkable amenities ~0.75 mi
Loading nearby amenities…
Taxation est. · year 1
- Rental income
- $20,098
- − Mortgage interest
- −$6,436
- − Property taxes
- −$1,884
- − Insurance
- −$1,241
- − Repairs & maintenance
- −$1,608
- − Management
- −$1,608
- − Depreciation
- −$3,343
- Taxable income
- $3,978
- Est. tax owed @ 24.0%
- −$955
- After-tax cash flow
- $4,567/yr
For passive investors: Depreciation is non-cash, so a rental often shows a tax loss while cash-flowing — sheltering income. Rental losses are passive: they offset passive income freely, and up to $25,000/yr can offset ordinary (W-2) income if you actively participate and your MAGI is under $100k (phasing out to $0 by $150k); unused losses carry forward. On sale, claimed depreciation is recaptured at up to 25%, and gains may owe capital-gains tax (a 1031 exchange can defer both). Figures are a year-1 estimate at your 24.0% rate — not tax advice; consult a CPA.
Schools (NCES district)
- District
- Baltimore City Public Schools
- NCES district ID
- 2400090
- Math proficiency
- 7% ▼ -9.00%
- Reading proficiency
- 16% ▼ -5.00%
- Median HH income
- $42,108
- Composite
- 10.08/100
- National rank
- #9805
- State rank
- #24 of 24 in MD
Livability — Baltimore
- Score
- 76/100
- State rank
- #90
- US rank
- #3396
Category grades
Schools grade is shown separately in the Schools card above.
Census & demographics
- Census place
- Baltimore, MD
- County
- Baltimore City · 558,601 people
- City population
- 588,727
- Metro
- Baltimore-Columbia-Towson, MD
- Population (ZIP)
- 28,058
- Household income
- $51,344
- Rent vs Own
- Severe rent burden
- 1868.0
Population outlook (Baltimore County) Hauer SSP2
- Today (2025)
- 624,249 people
- By 2030
- 621,541 · -0.4%
- By 2040
- 609,756 · -2.3%
- By 2050
- 597,249 · -4.3%
- By 2075
- 552,236 · -11.5%
- By 2100
- 513,934 · -17.7%
Race, ethnicity, and origin ACS 2023
- Neighborhood character
- Predominantly Black (86%)
- Race & ethnicity
- Black 86% White 6% Hispanic / Latino 4% Two or more races 3%
- Foreign-born
- 3% · Canada
- Languages at home
- 96% English-only · Spanish 3%
Political lean MEDSL · Baltimore
- 2024 margin
- Solid D (+73.0) · D 85.2% · R 12.2% · Other 2.6%
- 2008→2024 swing
- -2.5pp toward R · 2008: 75.5pp · 2024: 73.0pp
- All cycles
- 2024: D+73.0 2020: D+76.6 2016: D+74.6 2012: D+76.4 2008: D+75.5
Not yet ingested
- Civics
- —
Market trends
- HPI YoY
- ▼ -0.57%
- Current HPI
- 427.4453
- Rent YoY
- ▲ 5.25%
- Metro
- Baltimore-Columbia-Towson, MD
- State GDP YoY
- ▲ 2.97%
- F500 in state
- 12
Industry mix (Fortune 500 HQ in MD)
| Industry | F500 HQs | Revenue |
|---|---|---|
| Aerospace / Defense | 1 | $71B |
|
||
| Utilities | 1 | $25B |
|
||
| Hotels | 1 | $24B |
|
||
| Consumer Goods | 1 | $7B |
|
||
| Real Estate | 1 | $6B |
|
||
| Chemicals | 1 | $2B |
|
||
Price history
+130.3% since first listed9 events — show timeline
- 2026-06-15 Relisted — BRIGHT MLS
- 2026-06-01 Pending — BRIGHT MLS
- 2026-05-14 Listed $114,900 BRIGHT MLS
- 2026-05-09 Coming Soon $114,900 BRIGHT MLS
- 1996-06-21 Sold (Public Records) $49,900 Public Records
- 1996-06-21 Sold (Public Records) $49,900 Public Records
- 1996-05-29 Sold (MLS) $49,900 MRIS
- 1996-04-02 Delisted — MRIS
- 1996-03-24 Listed $49,900 MRIS
Property tax history
-1.6%/yrLatest (2025): $1,884 · +3.1% YoY. Source: county tax records.
Cash-flow waterfall
monthlySold comps — $/sqft
last 12 mo · ≤1 miLoading sold comps…