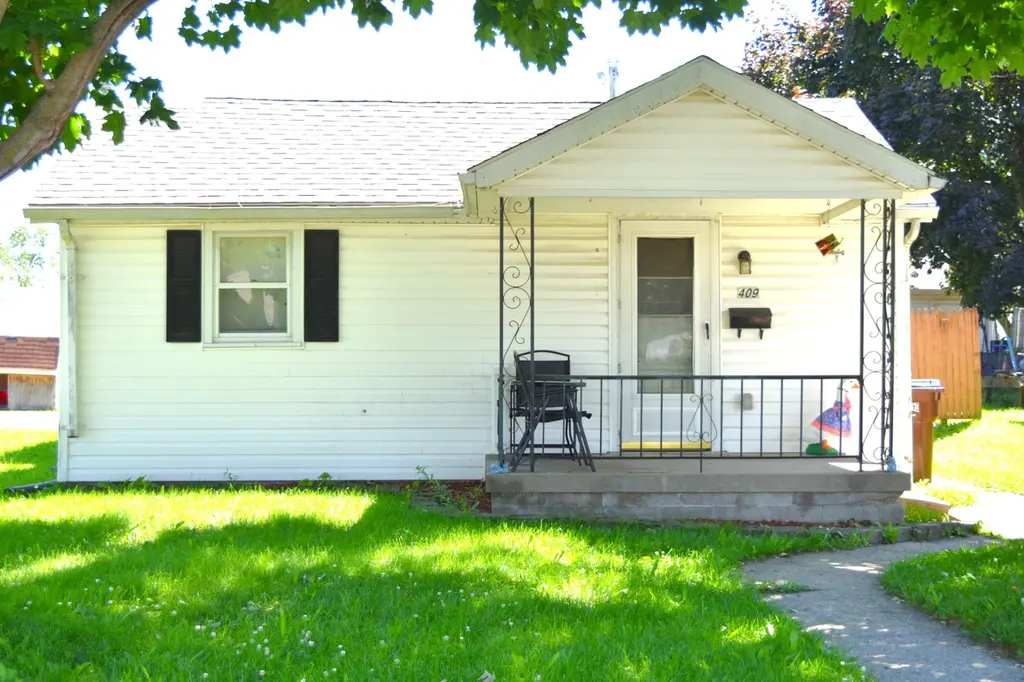
409 Wilson · Piqua, OH
Flood risk 1/10 · Minimal
- FEMA flood zone
- X (unshaded)
- Chance of flooding over 30 yrs
- 0.0%
- Est. flood insurance / yr
- $507 – $1,088
Fire risk 1/10 · Minimal
- Est. fire insurance / yr
- $713 – $1,323
Heat risk 3/10 · Minor
- Hot days now (above 100°F)
- 7 days/yr
- Hot days in 30 yrs
- 18 days/yr
Wind risk 2/10 · Minimal
- Chance of severe wind over 30 yrs
- —
Air-quality risk 2/10 · Minimal
- Unhealthy air days now
- 1 days/yr
- Unhealthy air days in 30 yrs
- 2 days/yr
Risk factors via First Street. Map © Google.
Why this score? — see what drove the C grade
The composite is a weighted blend of 9 inputs, each scored 0–100. Each bar is that input's sub-score; the figure is the points it added to the 100-point composite (weight × sub-score).
- Cash flow +18.1/30.0
- ARV discount +15.0/15.0
- DSCR +5.7/10.0
- 1% rule +4.6/10.0
- Schools +4.0/10.0
- Livability +3.1/5.0
- Rent growth +2.5/5.0
- Condition / age +2.5/5.0
- Appreciation +0.0/10.0
$104,900
🖨 Deal sheet (PDF) 📄 Offer letter ✓ Due diligence
Listing remarks MLS
Why rent? Affordable low maintenance home offers great opportunity to own less than rent or for the investment-minded. Welcoming covered front porch opens to large living room, eat-in kitchen and 2 beds accessible to full bath. Extra storage provided in the utility/mudroom with walk-out to rear yard, 1-car detached garage with alley access & additional off-street parking.
Key facts
- Covered front porch
- Utility mudroom
- Rear yard
Tags
Property features AI
Finance
- Financial info: Offered for sale
Exterior
- Parking: Detached one-car garage
- Utilities: Natural gas available; Sewer available; Storm sewer
- Home design: One-story home; Vinyl siding; Residential zoning; Lot approximately +/-50 x 127
- Construction: Vinyl siding construction
- Exterior features: Front porch
Interior
- Kitchen: Range; Refrigerator
- Bedrooms: Two main-level bedrooms (10 x 9; 11 x 10)
- Bathrooms: One full bathroom on the main level
- Heating & cooling: Forced air heating; Natural gas heating
- Interior features: Crawl space basement; Eat-in kitchen
- Laundry & utility: Main-level utility room (11 x 5)
Neighborhood map
What this means for you Summary
Snapshot
- This is a 2-bed/1.0-bath single-family listed at $105k.
Deal economics
- At list price, monthly cash flow is $93 ($1k/yr) — positive.
- The deal already cash-flows at list — no discount required.
- To meet the 1% rule (rent ≥ 1% of price), the offer needs to be $100k (4.5% below list).
- Recommended offer: $100k (4.5% below list) — sets the bar for 1% rule.
- Cap rate 7.4% vs local median 4.7% in Piqua — top-decile yield for the area; either an underpriced asset or a hidden risk that comps aren't pricing in. Stress-test before assuming the spread holds.
Location & tenants
- Location reads 62/100 on livability (#887 in OH) — a middle-class / working-renter tenant base. Strengths: cost of living A+, housing A+; Watch: employment D+, crime F, amenities F.
- Piqua City (rural): math 45% / reading 50% proficiency, ranked #482 of 656 in OH (top 74%) — families likely to look elsewhere, expect single-tenant / working-renter base with shorter leases.
- Market conditions: 139 active listings in the ZIP; 7 comparable units currently listed for rent nearby; rentals leasing fast (median 3d on market — plan ~1-2 weeks tenant-placement turnaround); 326 units permitted in Miami County in 2024 (0 in 5+ unit buildings).
- This rent is only 17% of the median local income ($69k/yr) — well below the 30% rent-burden line; pricing power to push rent on renewal without tenant pushback.
Forward outlook
- Local home prices are declining (-3.0%/yr); year-one equity from $725 of loan paydown is wiped out by about $3k of value loss. Plan a longer hold.
Negotiation context
- Only 7 days on market — expect competitive offers; lowballing is unlikely to land.
- 4 sale attempts since 10y ago with the ask held roughly flat each time — persistent listings suggest the price (not the market) is what's stuck; bring a comps-based counter.
- Current owner paid $46k; list at $105k implies a 126% gain — meaningful room to come down on a strong offer.
Risks & watch-outs
- Watch-outs: built in 1920 — expect roof / HVAC / electrical / plumbing capex.
Questions for the listing agent
- Built in 1920 — when were the roof, HVAC, electrical panel, plumbing, and water heater last replaced?
- Is there a deadline driving the sale (1031 exchange, divorce, estate, relocation)? That informs how much negotiation room exists.
- Crime grade is F in this area — have there been break-ins, vandalism, or insurance claims at this property in the last 3 years? What carrier currently insures it and at what premium?
- What's the average days-on-market for RENTAL listings here right now (not sales)? A rising rental-DOM trend means longer vacancies and softer asking-rent achievability than the comps imply.
- What's the recent tenant-quality profile in this submarket — average credit score on applications, eviction rate, late-payment / NSF rate, and stable-employment percentage? A property-management company in the area should have these aggregated.
- How much new for-sale + rental construction is in the pipeline within 1–3 miles? Heavy new supply typically softens prices + rents 12–24 months out; constrained supply supports both.
Investment metrics
- 1% rule
- 0.96% ✗
- Cap rate
- 7.35%
- Cash-on-cash
- 3.78%
- DSCR
- 1.17
- GRM
- 8.7
CMA / ARV
- ARV (on-the-fly)
- $137,085
- Comps found
- 12
Show comp detail 12 sales within ~0.75 mi
| Address | Dist | Beds/Ba | Sqft | Sold | Price | $/sf | Match |
|---|---|---|---|---|---|---|---|
| 279 Linden Ave | 0.20mi | 2/1.0 | 750 (+1%) | 6mo | $120,000 | $160 | 84 |
| 1407 Garfield St | 0.15mi | 2/1.0 | 729 (-2%) | 9mo | $153,000 | $210 | 83 |
| 719 South St | 0.40mi | 2/1.0 | 768 (+4%) | 0mo | $142,000 | $185 | 75 |
| 1420 Plum St | 0.20mi | 2/1.0 | 783 (+6%) | 12mo | $164,900 | $211 | 71 |
| 825 Clark Ave | 0.58mi | 2/1.0 | 725 (-2%) | 6mo | $159,000 | $219 | 64 |
| 716 Brook St | 0.68mi | 2/1.0 | 720 (-3%) | 2mo | $95,000 | $132 | 61 |
| 904 W High St | 0.69mi | 2/1.0 | 739 (-0%) | 11mo | $114,900 | $155 | 58 |
| 801 Manier Ave | 0.70mi | 3/1.0 (+1) | 725 (-2%) | 8mo | $170,000 | $234 | 53 |
| 910 Brice Ave | 0.43mi | 2/1.0 | 672 (-9%) | 16mo | $147,500 | $219 | 51 |
| 932 Brook St | 0.56mi | 2/1.0 | 838 (+13%) | 1mo | $140,000 | $167 | 51 |
| 518 Garnsey St | 0.62mi | 3/1.0 (+1) | 800 (+8%) | 8mo | $56,000 | $70 | 46 |
| 817 W Water St | 0.63mi | 3/1.0 (+1) | 830 (+12%) | 14mo | $99,500 | $120 | 34 |
Match score weights: distance 35% · size 25% · config 20% · recency 20%. Top-matched comps best support the ARV.
Projected returns pro-forma
-3.0% appreciation · 3.0% rent growth · sell at horizon
- IRR
- -10.4%
- Equity multiple
- 0.62×
- Total profit
- $-11,106
- Equity at exit
- $15,641
- IRR
- -1.0%
- Equity multiple
- 0.93×
- Total profit
- $-2,085
- Equity at exit
- $9,070
Cash invested: $29,372 (down + closing). Projections, not guarantees.
Landlord ↔ Tenant lean methodology
- Overall (STATE)
- 73 Landlord-Friendly
- State Ohio
- 73 Landlord-Friendly · R+6
- County
- — inherits STATE
- City
- — inherits STATE
ZIP-level market 45356
- Active inventory
- 139
- Price-to-rent
- 8.7×
Monthly cashflow live
- Estimated rent
- $1,002 high interval (Pro) →
- Mortgage (P&I)
- −$550
- Tax from tax record
- −$105 /mo · $1,263/yr
- Insurance
- −$44
- HOA
- −$0
- Vacancy / Maint / Mgmt
- −$210
- Net cashflow
- $93
Break-even live
Sensitivity live
| Price | -10% $152 | -5% $122 | +0% $93 | +5% $63 | +10% $33 |
|---|---|---|---|---|---|
| Rent | -10% $13 | -5% $53 | +0% $93 | +5% $132 | +10% $172 |
| Rate | -1.0pp $145 | -0.5pp $119 | base $93 | +0.5pp $65 | +1.0pp $38 |
UW: 25.0% down · 7.5% · 30yr · 1.5% tax · 5.0% vac · 8.0% maint · 8.0% mgmt
Financing live
Cash to close
- Down payment
- $26,225
- Closing costs
- $3,147
- Reserves months
- —
- Total cash needed
- —
Loan-product check · same deal, 3 products live
Conventional
25% down · 7.5% · 30yr
- Down + closing
- —
- Monthly P&I
- —
- Monthly cashflow
- —
- DSCR
- —
- Eligible?
- —
Personal DTI + credit; lowest rate.
DSCR
20% down · 8.5% · 30yr
- Down + closing
- —
- Monthly P&I
- —
- Monthly cashflow
- —
- DSCR
- —
- Eligible?
- —
No personal income docs; deal must DSCR.
Hard money
10% down · 12.0% · 12mo
- Down + closing
- —
- Monthly P&I
- —
- Monthly cashflow
- —
- DSCR
- —
- Eligible?
- —
Short-term bridge; refi at stabilization.
Rent comps 7 comps
| Address | Beds | Baths | Sqft | Rent | $/sqft | DOM | Units | Dist |
|---|---|---|---|---|---|---|---|---|
| 436 Wood St Unit 3 Piqua, OH | 2.0 | 1.0 | 720 | $1,050 | $1.46 | 44d | 1 | 0.73mi |
| 316 N College St Piqua, OH | 2.0 | 1.0 | 782 | $1,075 | $1.37 | 3d | 3 | 0.75mi |
| 619 S Wayne St Piqua, OH | 2.0 | 1.0 | 750 | $1,050 | $1.40 | 3d | 1 | 0.93mi |
| 519 1/2 Ann St Piqua, OH | 1.0 | 1.0 | 555 | $825 | $1.49 | 3d | 1 | 1.21mi |
| 1103 Nicklin Ave Piqua, OH | 1.0 | 1.0 | 504 | $650 | $1.29 | 3d | 1 | 1.25mi |
| 701 N Wayne St Piqua, OH | 1.0 | 1.0 | 600 | $695 | $1.16 | 3d | 1 | 1.27mi |
| 638 N Main St Piqua, OH | 1.0 | 1.0 | 600 | $850 | $1.42 | 12d | 1 | 1.30mi |
Listing history 6 events
-
2026-06-13statusdays on market $104,900 Pending 7 DOM
-
2026-06-10days on market $104,900 Active 5 DOM
-
2026-06-09days on market $104,900 Active 4 DOM
-
2026-06-08days on market $104,900 Active 3 DOM
-
2026-06-07remarks 376-char remark
-
2026-06-07$104,900 Active 2 DOM
ⓘ Source: listings_history table (triggers on properties + properties_extension) + one-shot
backfill from property_details.listing_events for pre-trigger history.
Tax reassessment forecast OH · Partial reset (capped growth)
- Current annual tax
- $1,263 · $105/mo
- Projected year-2 tax
- $1,450 · $121/mo
- Expected delta
- +$187/yr (+$16/mo · 14.8%)
ⓘ Screening estimate from a state-policy table — verify with the county assessor before closing.
Climate risk First Street
- Flood 1/10 Low FEMA zone X (unshaded) · 0% chance over 30 yrs
- Wildfire 1/10 Low
- Heat 3/10 Moderate 7 d/yr ≥100°F today · 18 d/yr by 30 yrs out
- Wind 2/10 Low
- Air quality 2/10 Low 1 unhealthy d/yr today · 2 by 30 yrs out
Nearby sold comps map
Loading sold comps map…
Walkable amenities ~0.75 mi
Loading nearby amenities…
Taxation est. · year 1
- Rental income
- $12,024
- − Mortgage interest
- −$5,876
- − Property taxes
- −$1,263
- − Insurance
- −$524
- − Repairs & maintenance
- −$962
- − Management
- −$962
- − Depreciation
- −$3,052
- Taxable loss
- −$615
- Est. tax savings @ 24.0%
- +$148
- After-tax cash flow
- $1,258/yr
For passive investors: Depreciation is non-cash, so a rental often shows a tax loss while cash-flowing — sheltering income. Rental losses are passive: they offset passive income freely, and up to $25,000/yr can offset ordinary (W-2) income if you actively participate and your MAGI is under $100k (phasing out to $0 by $150k); unused losses carry forward. On sale, claimed depreciation is recaptured at up to 25%, and gains may owe capital-gains tax (a 1031 exchange can defer both). Figures are a year-1 estimate at your 24.0% rate — not tax advice; consult a CPA.
Schools (NCES district)
- District
- Piqua City
- NCES district ID
- 3904464
- Math proficiency
- 45% ▼ -11.00%
- Reading proficiency
- 50% ▼ -7.00%
- Median HH income
- $41,751
- Composite
- 39.91/100
- National rank
- #3855
- State rank
- #482 of 656 in OH
Livability — Piqua
- Score
- 62/100
- State rank
- #887
- US rank
- #16830
Category grades
Schools grade is shown separately in the Schools card above.
Census & demographics
- Census place
- Piqua, OH
- County
- Miami County · 85,667 people
- City population
- 25,237
- Metro
- Dayton-Kettering, OH
- Population (ZIP)
- 25,237
- Household income
- $69,188
- Rent vs Own
- Severe rent burden
- 748.0
Population outlook (Miami County) Hauer SSP2
- Today (2025)
- 107,816 people
- By 2030
- 108,896 · +1.0%
- By 2040
- 109,581 · +1.6%
- By 2050
- 108,110 · +0.3%
- By 2075
- 101,523 · -5.8%
- By 2100
- 85,787 · -20.4%
Race, ethnicity, and origin ACS 2023
- Neighborhood character
- Predominantly White (92%)
- Race & ethnicity
- White 92% Two or more races 3% Black 2% Hispanic / Latino 1%
- Common ancestry
- Iranian 2% Italian 2% Lithuanian 2%
- Foreign-born
- 1%
- Languages at home
- 99% English-only · Spanish 1% Vietnamese 0%
Political lean MEDSL · Miami
- 2024 margin
- Solid R (+45.1) · D 27.0% · R 72.1%
- 2008→2024 swing
- -16.6pp toward R · 2008: -28.5pp · 2024: -45.1pp
- All cycles
- 2024: R+45.1 2020: R+44.3 2016: R+45.6 2012: R+35.6 2008: R+28.5
Not yet ingested
- Civics
- —
Market trends
- HPI YoY
- ▼ -137.96%
- Current HPI
- 251.435
- Rent YoY
- —
- Metro
- Dayton-Kettering, OH
- State GDP YoY
- ▲ 1.98%
- F500 in state
- 48
Industry mix (Fortune 500 HQ in OH)
| Industry | F500 HQs | Revenue |
|---|---|---|
| Insurance | 3 | $145B |
|
||
| Industrial Machinery | 3 | $49B |
|
||
| Financial Services | 3 | $24B |
|
||
| Consumer Goods | 2 | $93B |
|
||
| Aerospace / Defense | 2 | $47B |
|
||
| Utilities | 2 | $33B |
|
||
Price history
+1134.1% since first listed10 events — show timeline
- 2026-06-05 Listed $104,900 Dayton MLS
- 2026-06-05 Listed $104,900 WRIST
- 2016-08-04 Sold (Public Records) $46,500 Public Records
- 2016-07-29 Sold (MLS) $46,500 Dayton MLS
- 2016-07-29 Sold (MLS) $46,500 WRIST
- 2016-07-29 Sold (MLS) $46,500 Dayton MLS
- 2016-07-18 Contingent — Dayton MLS
- 2016-07-06 Listed $52,900 Dayton MLS
- 2016-07-01 Listed $52,900 WRIST
- 1986-07-24 Sold (Public Records) $8,500 Public Records
Property tax history
+3.7%/yrLatest (2025): $1,263 · +19.3% YoY. Source: county tax records.
Cash-flow waterfall
monthlySold comps — $/sqft
last 12 mo · ≤1 miLoading sold comps…