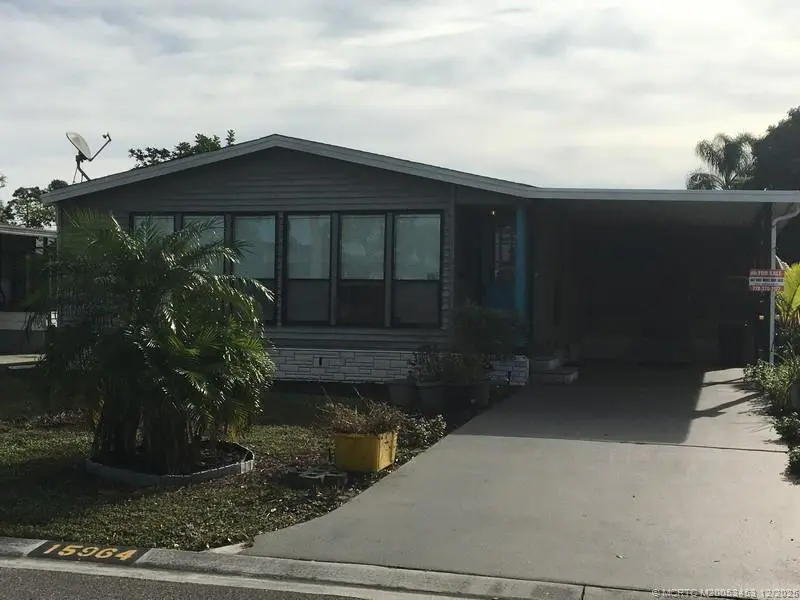
15964 SW Indianwood Cir · Indiantown, FL
Flood risk 1/10 · Minimal
- FEMA flood zone
- X (unshaded)
- Chance of flooding over 30 yrs
- 0.0%
- Est. flood insurance / yr
- $507 – $1,088
Fire risk 5/10 · Moderate
- Est. fire insurance / yr
- $947 – $1,759
Heat risk 9/10 · Severe
- Hot days now (above 108°F)
- 7 days/yr
- Hot days in 30 yrs
- 24 days/yr
Wind risk 10/10 · Severe
- Chance of severe wind over 30 yrs
- 99.0%
Air-quality risk 2/10 · Minimal
- Unhealthy air days now
- 0 days/yr
- Unhealthy air days in 30 yrs
- 1 days/yr
Risk factors via First Street. Map © Google.
Why this score? — see what drove the D+ grade
The composite is a weighted blend of 9 inputs, each scored 0–100. Each bar is that input's sub-score; the figure is the points it added to the 100-point composite (weight × sub-score).
- Cash flow +15.0/30.0
- Appreciation +8.3/10.0
- 1% rule +5.0/10.0
- DSCR +5.0/10.0
- Schools +4.5/10.0
- Livability +3.0/5.0
- Rent growth +2.5/5.0
- Condition / age +2.5/5.0
- ARV discount +0.0/15.0
$32,500
🖨 Deal sheet 📄 Offer letter ✓ Due diligence
Listing remarks MLS
Lovely two bed room two bath Fleet Wood home features pleasant open floor plan. Enter home thru front foyer. Home comes furnished as seen. Enjoy bright living area & dinning room. Spacious bed rooms & Baths. Side screen room to enjoy the open feeling of Florida living. You will love all the activities and amenities for your enjoyment in this lovely community.
Key facts
- Open floor plan
- Bright living area
- Dining room
Tags
Neighborhood map
What this means for you Summary
Snapshot
- This is a 2-bed/2.0-bath condo listed at $32k.
Deal economics
- At list price, monthly cash flow is $429 ($5k/yr) — positive.
- The deal already cash-flows at list — no discount required.
- Meets the 1% rule at list price ($2k rent vs $32k).
- Recommended offer: $29k (12.0% below list) — sets the bar for market timing.
- Cap rate 22.1% vs local median 10.9% in Indiantown — top-decile yield for the area; either an underpriced asset or a hidden risk that comps aren't pricing in. Stress-test before assuming the spread holds.
Location & tenants
- Location reads 59/100 on livability (#829 in FL) — a working-class tenant base; expect higher turnover. Strengths: cost of living A+, housing A+; Watch: schools F, amenities F, commute F.
- Martin (suburban): math 52% / reading 53% proficiency, ranked #24 of 73 in FL (top 33%) — acceptable for families but not a draw, mixed tenant base, ~2y average lease.
- Market conditions: 135 active listings in the ZIP; 2 comparable units currently listed for rent nearby; 737 units permitted in Martin County in 2024 (167 in 5+ unit buildings).
Forward outlook
- In year one you build about $2k of equity ($225 loan paydown + $2k appreciation (6.7% local appreciation)).
- Martin County population projected at +19% by 2050 — long-run rental-demand tailwind backs the buy-and-hold thesis.
- At projected returns (6.7% appreciation + 3.0% rent growth), your $9k cash investment doubles in ~2 years — after that, you're playing with house money.
Negotiation context
- It's been on market 189 days — a 12% lower offer ($29k) is reasonable based on typical stale-listing flexibility.
Risks & watch-outs
- Watch-outs: property tax is 2.7% of price; HOA is 49% of rent.
- Climate carrying-cost: severe wind risk, 99% chance of damaging wind over 30y; moderate wildfire risk; extreme-heat days projected 7→24/yr by 2055 (HVAC capex compounding) — expect insurance premiums to compound above CPI over the hold.
Questions for the listing agent
- It's been on market 189 days. Have you received any prior offers? Is the seller open to a 12% concession, seller financing, or rate buy-down credit?
- Property tax is high relative to price — has the assessment been appealed recently, and will the sale trigger a re-assessment?
- What does the HOA fee cover, when was the last increase, and are there any pending special assessments or reserve-fund shortfalls?
- Any open or pending special assessments — roof, HVAC, plumbing, elevator, façade? What's the per-unit balance and payoff schedule, and is the seller paying it off at close or rolling it to the buyer?
- Why hasn't it sold? Are there any deal-killer items the seller is aware of (foundation, flood, title, zoning, code violations)?
- Is there a deadline driving the sale (1031 exchange, divorce, estate, relocation)? That informs how much negotiation room exists.
- Schools are F-rated, which usually means shorter tenancies and higher turnover. Who's the typical renter profile here, and what's been the actual vacancy rate?
- The area grade is low — what's the realistic commute time and amenity access for the typical tenant pool here? Any planned neighborhood developments (good or bad) we should know about?
- What's the average days-on-market for RENTAL listings here right now (not sales)? A rising rental-DOM trend means longer vacancies and softer asking-rent achievability than the comps imply.
- What's the recent tenant-quality profile in this submarket — average credit score on applications, eviction rate, late-payment / NSF rate, and stable-employment percentage? A property-management company in the area should have these aggregated.
- How much new apartment / multifamily construction is in the pipeline within 1–3 miles? Heavy new supply (>2% of stock underway) typically softens rents 12–24 months out; light construction supports rent growth.
Investment metrics
- 1% rule
- 7.15% ✓
- Cap rate
- 22.13%
- Cash-on-cash
- 56.54%
- DSCR
- 3.52
- GRM
- 1.2
CMA / ARV
- ARV (median comp)
- $23,450
- List price
- $32,500
- Delta
- 38.59%
- Verdict
- OVERPRICED
- Comps
- 20 within 1.0 mi
Projected returns pro-forma
6.65% appreciation · 3.0% rent growth · sell at horizon
- IRR
- 66.3%
- Equity multiple
- 5.26×
- Total profit
- $38,727
- Equity at exit
- $21,783
- IRR
- 63.1%
- Equity multiple
- 11.30×
- Total profit
- $93,763
- Equity at exit
- $40,726
Cash invested: $9,100 (down + closing). Projections, not guarantees.
Landlord ↔ Tenant lean methodology
- Overall (STATE)
- 87 Strongly Landlord-Friendly
- State Florida
- 87 Strongly Landlord-Friendly · R+3
- County
- — inherits STATE
- City
- — inherits STATE
ZIP-level market 34956
- Home prices YoY
- 1.2%
- Active inventory
- 135
- Price-to-rent
- 1.2×
Monthly cashflow live
- Estimated rent
- $2,325 medium interval (Pro) →
- Mortgage (P&I)
- −$170
- Tax from tax record
- −$74 /mo · $884/yr
- Insurance
- −$14
- HOA
- −$1,150
- Vacancy / Maint / Mgmt
- −$488
- Net cashflow
- $429
Break-even live
UW: 25.0% down · 7.5% · 30yr · 1.5% tax · 5.0% vac · 8.0% maint · 8.0% mgmt
Financing live
Cash to close
- Down payment
- $8,125
- Closing costs
- $975
- Reserves months
- —
- Total cash needed
- —
Loan-product check · same deal, 3 products live
Conventional
25% down · 7.5% · 30yr
- Down + closing
- —
- Monthly P&I
- —
- Monthly cashflow
- —
- DSCR
- —
- Eligible?
- —
Personal DTI + credit; lowest rate.
DSCR
20% down · 8.5% · 30yr
- Down + closing
- —
- Monthly P&I
- —
- Monthly cashflow
- —
- DSCR
- —
- Eligible?
- —
No personal income docs; deal must DSCR.
Hard money
10% down · 12.0% · 12mo
- Down + closing
- —
- Monthly P&I
- —
- Monthly cashflow
- —
- DSCR
- —
- Eligible?
- —
Short-term bridge; refi at stabilization.
Rent comps 2 comps
| Address | Beds | Baths | Sqft | Rent | $/sqft | DOM | Units | Dist |
|---|---|---|---|---|---|---|---|---|
| 15817 SW Winter Rd Indiantown, FL | 3.0 | 2.5 | 1428 | $2,300 | $1.61 | 13d | 1 | 0.35mi |
| 15760 SW Hammock Way Indiantown, FL | 3.0–4.0 | 2.0–3.5 | 1918 | $2,420 | $1.26 | 1d | 41 | 1.04mi |
HOA detail condo
- Monthly dues
- $1,150 · $13,800/yr
- Assessments
- None detected in remarks — confirm with the listing agent.
Listing history 16 events
-
2026-06-18days on market $32,500 Active 189 DOM
-
2026-06-17days on market $32,500 Active 188 DOM
-
2026-06-16days on market $32,500 Active 187 DOM
-
2026-06-15days on market $32,500 Active 186 DOM
-
2026-06-14days on market $32,500 Active 184 DOM
-
2026-06-13days on market $32,500 Active 183 DOM
-
2026-06-10days on market $32,500 Active 181 DOM
-
2026-06-09days on market $32,500 Active 180 DOM
-
2026-06-08days on market $32,500 Active 179 DOM
-
2026-06-07days on market $32,500 Active 178 DOM
-
2026-06-03days on market $32,500 Active 174 DOM
-
2026-06-02days on market $32,500 Active 173 DOM
-
2026-06-01days on market $32,500 Active 172 DOM
-
2026-05-31days on market $32,500 Active 171 DOM
-
2026-05-31days on market $32,500 Active 170 DOM
-
2025-12-11$32,500 Active 375-char remark
Show marketing remark (375 chars)
Lovely two bed room two bath Fleet Wood home features pleasant open floor plan. Enter home thru front foyer. Home comes furnished as seen. Enjoy bright living area & dinning room. Spacious bed rooms & Baths. Side screen room to enjoy the open feeling of Florida living. You will love all the activities and amenities for your enjoyment in this lovely community.
ⓘ Source: listings_history table (triggers on properties + properties_extension) + one-shot
backfill from property_details.listing_events for pre-trigger history.
Tax reassessment forecast FL · Resets to sale price
- Current annual tax
- $884 · $74/mo
- Projected year-2 tax
- $884 · $74/mo
- Expected delta
- $0/yr ($0/mo · 0.0%)
ⓘ Screening estimate from a state-policy table — verify with the county assessor before closing.
Climate risk First Street
- Flood 1/10 Low FEMA zone X (unshaded) · 0% chance over 30 yrs
- Wildfire 5/10 Major
- Heat 9/10 Extreme 7 d/yr ≥108°F today · 24 d/yr by 30 yrs out
- Wind 10/10 Extreme 99% chance of damaging wind over 30 yrs
- Air quality 2/10 Low 0 unhealthy d/yr today · 1 by 30 yrs out
Nearby sold comps map
Loading sold comps map…
Walkable amenities ~0.75 mi
Loading nearby amenities…
Taxation est. · year 1
- Rental income
- $27,896
- − Mortgage interest
- −$1,821
- − Property taxes
- −$884
- − Insurance
- −$162
- − Repairs & maintenance
- −$2,232
- − Management
- −$2,232
- − HOA
- −$13,800
- − Depreciation
- −$945
- Taxable income
- $5,820
- Est. tax owed @ 24.0%
- −$1,397
- After-tax cash flow
- $3,749/yr
For passive investors: Depreciation is non-cash, so a rental often shows a tax loss while cash-flowing — sheltering income. Rental losses are passive: they offset passive income freely, and up to $25,000/yr can offset ordinary (W-2) income if you actively participate and your MAGI is under $100k (phasing out to $0 by $150k); unused losses carry forward. On sale, claimed depreciation is recaptured at up to 25%, and gains may owe capital-gains tax (a 1031 exchange can defer both). Figures are a year-1 estimate at your 24.0% rate — not tax advice; consult a CPA.
Schools (NCES district)
- District
- Martin
- NCES district ID
- 1201290
- Math proficiency
- 52% ▼ -14.00%
- Reading proficiency
- 53% ▼ -4.00%
- Median HH income
- $52,482
- Composite
- 45.1/100
- National rank
- #2690
- State rank
- #24 of 73 in FL
Livability — Indiantown
- Score
- 59/100
- State rank
- #829
- US rank
- #20298
Category grades
Schools grade is shown separately in the Schools card above.
Census & demographics
- Census place
- Indiantown, FL
- Population (ZIP)
- 9,639
Population outlook (Martin County) Hauer SSP2
- Today (2025)
- 172,383 people
- By 2030
- 180,192 · +4.5%
- By 2040
- 194,114 · +12.6%
- By 2050
- 204,992 · +18.9%
- By 2075
- 229,641 · +33.2%
- By 2100
- 232,146 · +34.7%
Race, ethnicity, and origin ACS 2023
- Neighborhood character
- Diverse neighborhood (Simpson 0.64)
- Race & ethnicity
- Hispanic / Latino 49% Black 24% White 24% Two or more races 16% Native American 5% Asian 1%
- Hispanic origin (detail)
- Mexican 21% Puerto Rican 4% Cuban 1%
- Common ancestry
- Lithuanian 1% Italian 1% Slovak 1%
- Foreign-born
- 22% · Canada
- Languages at home
- 55% English-only · Spanish 42%
Political lean MEDSL · Martin
- 2024 margin
- Solid R (+31.1) · D 34.1% · R 65.2%
- 2008→2024 swing
- -17.5pp toward R · 2008: -13.6pp · 2024: -31.1pp
- All cycles
- 2024: R+31.1 2020: R+24.6 2016: R+26.9 2012: R+22.9 2008: R+13.6
Not yet ingested
- Civics
- —
Market trends
- HPI YoY
- ▲ 6.65%
- Current HPI
- 561.896
- Rent YoY
- —
- Metro
- —
- State GDP YoY
- ▲ 3.28%
- F500 in state
- 36
Industry mix (Fortune 500 HQ in FL)
| Industry | F500 HQs | Revenue |
|---|---|---|
| Industrial Technology | 2 | $29B |
|
||
| Insurance | 2 | $17B |
|
||
| Retail | 1 | $60B |
|
||
| Technology Distribution | 1 | $58B |
|
||
| Homebuilding | 1 | $35B |
|
||
| Technology Manufacturing | 1 | $35B |
|
||
Price history
1 event — show timeline
- 2025-12-11 Listed $32,500 MCRTC
Property tax history
+4.1%/yrLatest (2024): $884 · -1.9% YoY. Source: county tax records.
Cash-flow waterfall
monthlySold comps — $/sqft
last 12 mo · ≤1 miLoading sold comps…