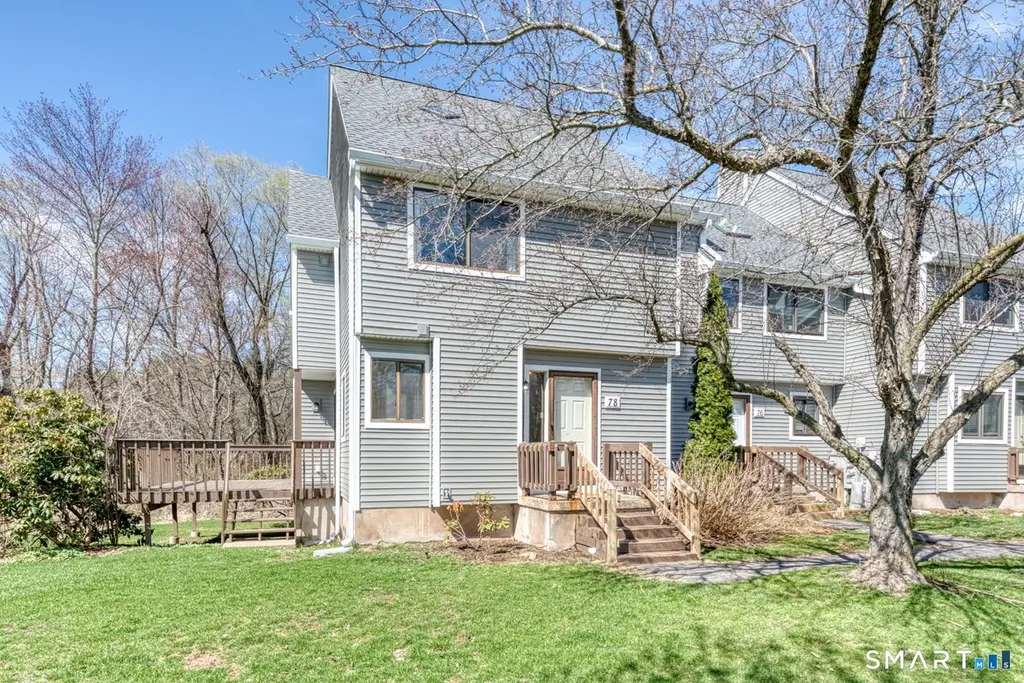
78 Silo Way #78 · West Hartford, CT
Flood risk No data
- FEMA flood zone
- —
- Chance of flooding over 30 yrs
- —
- Est. flood insurance / yr
- —
Fire risk No data
- Est. fire insurance / yr
- —
Heat risk No data
- Hot days now (above threshold)
- —
- Hot days in 30 yrs
- —
Wind risk No data
- Chance of severe wind over 30 yrs
- —
Air-quality risk No data
- Unhealthy air days now
- —
- Unhealthy air days in 30 yrs
- —
Risk factors via First Street. Map © Google.
Why this score? — see what drove the D grade
The composite is a weighted blend of 9 inputs, each scored 0–100. Each bar is that input's sub-score; the figure is the points it added to the 100-point composite (weight × sub-score).
- Cash flow +15.1/30.0
- 1% rule +7.3/10.0
- DSCR +4.6/10.0
- ARV discount +4.5/15.0
- Livability +4.0/5.0
- Rent growth +3.3/5.0
- Schools +2.2/10.0
- Condition / age +2.2/5.0
- Appreciation +0.0/10.0
$289,900
🖨 Deal sheet (PDF) 📄 Offer letter ✓ Due diligence
Listing remarks MLS
Don't miss your chance to make this wonderful home yours! This inviting end unit offers comfort, generous space, and low maintenance living in a peaceful community setting. The main level features an open dining and family room is perfect for gatherings along with a convenient half bath and coat closet for everyday functionality. Upstairs, the second floor includes two bedrooms or one bedroom plus an office/study, paired with a nearby full bath featuring a double vanity. The third floor bedroom is impressively spacious and includes its own full bathroom, creating a private suite ideal for guests or a primary retreat. Outdoor living is a highlight, with a private deck and patio overlooking the back of the property, an ideal spot to relax or enjoy your morning coffee. Additional features include a full unfinished basement offering excellent storage, one car detached garage and ample additional parking. This home blends practicality with comfort, offering the space you need and the lifestyle you want.
Key facts
- Private deck
- Half bath
- Third floor bedroom
Tags
Neighborhood map
What this means for you Summary
Snapshot
- This is a 3-bed/2.5-bath condo listed at $290k. Condition is rated fair.
Deal economics
- At list price, monthly cash flow is $95 ($1k/yr) — positive.
- The deal already cash-flows at list — no discount required.
- Meets the 1% rule at list price ($4k rent vs $290k).
- Recommended offer: $273k (6.0% below list) — sets the bar for market timing.
- Cap rate 6.7% vs local median 3.3% in West Hartford — top-decile yield for the area; either an underpriced asset or a hidden risk that comps aren't pricing in. Stress-test before assuming the spread holds.
Location & tenants
- Location reads 79/100 on livability (#27 in CT, #1,989 nationally) — a middle-class / working-renter tenant base. Strengths: employment A+, housing A+, crime B+; Watch: amenities F, cost of living F.
- Bloomfield School District (suburban): math 16% / reading 30% proficiency, ranked #137 of 153 in CT (top 90%) — low school quality limits family demand, transient renter base, plan for 1-2y turnover.
- Zoned schools: Laurel School (307 students, 67% FRL); Carmen Arace Middle School (math 19% / reading 30%, grade F, #153 of 175 statewide, top 88%, 246 students, 61% FRL); Bloomfield High School (math 17% / reading 47%, grade F, #129 of 194 statewide, top 69%, 525 students, 58% FRL) — zoned schools average 62% FRL vs 44% district-wide (17 pts higher); higher-poverty schools than district average — tighter screening recommended.
- Market conditions: Rents rising (+3.1%/yr); 67 active listings in the ZIP; 3 comparable units currently listed for rent nearby; rentals lingering (median 46d on market — plan ~5-8 weeks vacancy on turnover, expect pricing pressure); 67% of comp listings sitting > 30 days — soft ceiling on asking rent; solid renter incomes; 1,867 units permitted in Capitol Planning Region in 2024 (1,399 in 5+ unit buildings).
- This rent runs 44% of the median local income ($98k/yr) — at the standard rent-burdened threshold; future hikes will face affordability resistance.
Forward outlook
- Local home prices are declining (-3.0%/yr); year-one equity from $2k of loan paydown is wiped out by about $9k of value loss. Plan a longer hold.
Negotiation context
- It's been on market 74 days — a 6% lower offer ($273k) is reasonable based on typical stale-listing flexibility.
- 2 sale attempts since 12y ago with the ask held roughly flat each time — persistent listings suggest the price (not the market) is what's stuck; bring a comps-based counter.
- Current owner paid $170k; list at $290k implies a 71% gain — meaningful room to come down on a strong offer.
Risks & watch-outs
- Watch-outs: HOA is 20% of rent.
Questions for the listing agent
- It's been on market 74 days. Have you received any prior offers? Is the seller open to a 6% concession, seller financing, or rate buy-down credit?
- Have any recent inspections been done? Can we get a copy of the seller's disclosures and any deferred-maintenance estimates?
- What does the HOA fee cover, when was the last increase, and are there any pending special assessments or reserve-fund shortfalls?
- Any open or pending special assessments — roof, HVAC, plumbing, elevator, façade? What's the per-unit balance and payoff schedule, and is the seller paying it off at close or rolling it to the buyer?
- Why hasn't it sold? Are there any deal-killer items the seller is aware of (foundation, flood, title, zoning, code violations)?
- Is there a deadline driving the sale (1031 exchange, divorce, estate, relocation)? That informs how much negotiation room exists.
- Schools are A-rated — typically a magnet for longer-tenancy family renters. What's the average tenant stay here, and is there a school-zone premium baked into asking?
- The area grade is low — what's the realistic commute time and amenity access for the typical tenant pool here? Any planned neighborhood developments (good or bad) we should know about?
- What's the average days-on-market for RENTAL listings here right now (not sales)? A rising rental-DOM trend means longer vacancies and softer asking-rent achievability than the comps imply.
- What's the recent tenant-quality profile in this submarket — average credit score on applications, eviction rate, late-payment / NSF rate, and stable-employment percentage? A property-management company in the area should have these aggregated.
- How much new apartment / multifamily construction is in the pipeline within 1–3 miles? Heavy new supply (>2% of stock underway) typically softens rents 12–24 months out; light construction supports rent growth.
Investment metrics
- 1% rule
- 1.23% ✓
- Cap rate
- 6.69%
- Cash-on-cash
- 1.41%
- DSCR
- 1.06
- GRM
- 6.8
CMA / ARV
- ARV (median comp)
- $271,555
- List price
- $289,900
- Delta
- 6.76%
- Verdict
- FAIR
- Comps
- 20 within 1.0 mi
Projected returns pro-forma
-3.0% appreciation · 3.11% rent growth · sell at horizon
- IRR
- -13.7%
- Equity multiple
- 0.51×
- Total profit
- $-40,019
- Equity at exit
- $43,225
- IRR
- -4.3%
- Equity multiple
- 0.71×
- Total profit
- $-23,399
- Equity at exit
- $25,065
Cash invested: $81,172 (down + closing). Projections, not guarantees.
Landlord ↔ Tenant lean methodology
- Overall (STATE)
- 27 Tenant-Leaning
- State Connecticut
- 27 Tenant-Leaning · D+7
- County
- — inherits STATE
- City
- — inherits STATE
ZIP-level market 06002
- Rents YoY
- 3.1%
- Active inventory
- 67
- Price-to-rent
- 6.8×
Monthly cashflow live
- Estimated rent
- $3,565 medium interval (Pro) →
- Mortgage (P&I)
- −$1,520
- Tax est. 1.5%
- −$362 /mo · $4,348/yr
- Insurance
- −$121
- HOA
- −$718
- Vacancy / Maint / Mgmt
- −$749
- Net cashflow
- $95
Break-even live
Sensitivity live
| Price | -10% $296 | -5% $195 | +0% $95 | +5% $-5 | +10% $-105 |
|---|---|---|---|---|---|
| Rent | -10% $-186 | -5% $-46 | +0% $95 | +5% $236 | +10% $377 |
| Rate | -1.0pp $241 | -0.5pp $169 | base $95 | +0.5pp $20 | +1.0pp $-56 |
UW: 25.0% down · 7.5% · 30yr · 1.5% tax · 5.0% vac · 8.0% maint · 8.0% mgmt
Financing live
Cash to close
- Down payment
- $72,475
- Closing costs
- $8,697
- Reserves months
- —
- Total cash needed
- —
Loan-product check · same deal, 3 products live
Conventional
25% down · 7.5% · 30yr
- Down + closing
- —
- Monthly P&I
- —
- Monthly cashflow
- —
- DSCR
- —
- Eligible?
- —
Personal DTI + credit; lowest rate.
DSCR
20% down · 8.5% · 30yr
- Down + closing
- —
- Monthly P&I
- —
- Monthly cashflow
- —
- DSCR
- —
- Eligible?
- —
No personal income docs; deal must DSCR.
Hard money
10% down · 12.0% · 12mo
- Down + closing
- —
- Monthly P&I
- —
- Monthly cashflow
- —
- DSCR
- —
- Eligible?
- —
Short-term bridge; refi at stabilization.
Rent comps 3 comps
| Address | Beds | Baths | Sqft | Rent | $/sqft | DOM | Units | Dist |
|---|---|---|---|---|---|---|---|---|
| 100 Ryefield Village Dr Bloomfield, CT | 2.0–4.0 | 2.5 | 1692 | $4,046 | $2.39 | 3d | 9 | 0.45mi |
| 55 Tunxis Ave Bloomfield, CT | 1.0–3.0 | 1.0–2.0 | 1003 | $2,850 | $2.84 | 45d | 1 | 0.58mi |
| 65 Jolley Dr Bloomfield, CT | 1.0–3.0 | 1.0–2.0 | 1054 | $4,500 | $4.27 | 45d | 16 | 1.47mi |
HOA detail condo
- Monthly dues
- $718 · $8,616/yr
- Assessments
- None detected in remarks — confirm with the listing agent.
Listing history 18 events
-
2026-06-21days on market $289,900 Active 74 DOM
-
2026-06-18days on market $289,900 Active 71 DOM
-
2026-06-17days on market $289,900 Active 70 DOM
-
2026-06-16days on market $289,900 Active 69 DOM
-
2026-06-15days on market $289,900 Active 68 DOM
-
2026-06-13days on market $289,900 Active 66 DOM
-
2026-06-10days on market $289,900 Active 63 DOM
-
2026-06-09days on market $289,900 Active 62 DOM
-
2026-06-08days on market $289,900 Active 61 DOM
-
2026-06-07days on market $289,900 Active 60 DOM
-
2026-06-05days on market $289,900 Active 57 DOM
-
2026-06-03days on market $289,900 Active 56 DOM
-
2026-06-02days on market $289,900 Active 55 DOM
-
2026-06-01days on market $289,900 Active 54 DOM
-
2026-05-31days on market $289,900 Active 53 DOM
-
2026-04-08$289,900 Active 1013-char remark
Show marketing remark (1013 chars)
Don't miss your chance to make this wonderful home yours! This inviting end unit offers comfort, generous space, and low maintenance living in a peaceful community setting. The main level features an open dining and family room is perfect for gatherings along with a convenient half bath and coat closet for everyday functionality. Upstairs, the second floor includes two bedrooms or one bedroom plus an office/study, paired with a nearby full bath featuring a double vanity. The third floor bedroom is impressively spacious and includes its own full bathroom, creating a private suite ideal for guests or a primary retreat. Outdoor living is a highlight, with a private deck and patio overlooking the back of the property, an ideal spot to relax or enjoy your morning coffee. Additional features include a full unfinished basement offering excellent storage, one car detached garage and ample additional parking. This home blends practicality with comfort, offering the space you need and the lifestyle you want.
-
2014-06-13soldstatus $170,000 244-char remark
Show marketing remark (244 chars)
Bright and sunny! Rarely available -3bdrm end unit backing to woods! Large deck off the dining room! 3Rd floor- bedroom and full bath! 2Nd flr - 2bedrms and a bath. Int recently painted! Newer carpets and flooring! Move in cond- fuly appliance!
-
2014-04-25$170,000 244-char remark
Show marketing remark (244 chars)
Bright and sunny! Rarely available -3bdrm end unit backing to woods! Large deck off the dining room! 3Rd floor- bedroom and full bath! 2Nd flr - 2bedrms and a bath. Int recently painted! Newer carpets and flooring! Move in cond- fuly appliance!
ⓘ Source: listings_history table (triggers on properties + properties_extension) + one-shot
backfill from property_details.listing_events for pre-trigger history.
Nearby sold comps map
Loading sold comps map…
Walkable amenities ~0.75 mi
Loading nearby amenities…
Taxation est. · year 1
- Rental income
- $42,785
- − Mortgage interest
- −$16,239
- − Property taxes
- −$4,348
- − Insurance
- −$1,450
- − Repairs & maintenance
- −$3,423
- − Management
- −$3,423
- − HOA
- −$8,616
- − Depreciation
- −$8,433
- Taxable loss
- −$3,147
- Est. tax savings @ 24.0%
- +$755
- After-tax cash flow
- $1,898/yr
For passive investors: Depreciation is non-cash, so a rental often shows a tax loss while cash-flowing — sheltering income. Rental losses are passive: they offset passive income freely, and up to $25,000/yr can offset ordinary (W-2) income if you actively participate and your MAGI is under $100k (phasing out to $0 by $150k); unused losses carry forward. On sale, claimed depreciation is recaptured at up to 25%, and gains may owe capital-gains tax (a 1031 exchange can defer both). Figures are a year-1 estimate at your 24.0% rate — not tax advice; consult a CPA.
Condition & rehab AI · 12 photos
This end-unit condo requires moderate repairs and updates to improve its condition and value. Key areas for investment include painting, replacing worn cabinets and appliances, and updating windows.
Repairs flagged
- Moderate Kitchen cabinets — Worn condition
- Moderate Bathroom fixtures — Worn condition
- Moderate Exterior siding — Weathered appearance
- Minor Interior paint — Faded in some areas
Value-add opportunities
- Both Painting interior walls — Fresh paint enhances curb appeal and interior aesthetics
- Both Replacing kitchen cabinets — Modern cabinets improve functionality and aesthetics
- Both Refrigerator and microwave replacement — Upgraded appliances increase functionality and appeal
- Both Window replacement — New windows improve energy efficiency and curb appeal
Renovation cost estimate screening
| Repair item | Severity | Est. cost |
|---|---|---|
| Kitchen cabinets · Worn condition | Moderate | $3,000–15,000 |
| Bathroom fixtures · Worn condition | Moderate | $3,000–15,000 |
| Exterior siding · Weathered appearance | Moderate | $3,000–15,000 |
| Interior paint · Faded in some areas | Minor | $500–3,000 |
| Total estimated repair cost · 4 items | $9,500–48,000 |
Value-add ROI direction
- Both Painting interior walls — Fresh paint enhances curb appeal and interior aesthetics ↑
- Both Replacing kitchen cabinets — Modern cabinets improve functionality and aesthetics ↑
- Both Refrigerator and microwave replacement — Upgraded appliances increase functionality and appeal ↑
- Both Window replacement — New windows improve energy efficiency and curb appeal ↑
ⓘ Cost ranges are severity-bucket heuristics (US national rule-of-thumb). Get contractor quotes + a written scope before underwriting a rehab budget.
Schools (NCES district)
- District
- Bloomfield School District
- NCES district ID
- 0900330
- Math proficiency
- 16% ▼ -13.00%
- Reading proficiency
- 30% ▼ -12.00%
- Median HH income
- $71,180
- Composite
- 22.37/100
- National rank
- #8120
- State rank
- #137 of 153 in CT
Livability — West Hartford
- Score
- 79/100
- State rank
- #27
- US rank
- #1989
Category grades
Schools grade is shown separately in the Schools card above.
Census & demographics
- County
- Hartford County · 754,208 people
- City population
- 63,441
- Metro
- Hartford-East Hartford-Middletown, CT
- Population (ZIP)
- 21,865
- Household income
- $98,162
- Rent vs Own
- Severe rent burden
- 692.0
Population outlook (Capitol County) Hauer SSP2
- By 2040
- 1,063,519
Race, ethnicity, and origin ACS 2023
- Neighborhood character
- Diverse neighborhood (Simpson 0.61)
- Race & ethnicity
- Black 54% White 30% Hispanic / Latino 8% Two or more races 6% Asian 4%
- Hispanic origin (detail)
- Puerto Rican 4%
- Common ancestry
- Romanian 2% Lithuanian 2% Scotch-Irish 2%
- Foreign-born
- 25% · Canada, Vietnam, China
- Languages at home
- 82% English-only · Spanish 6% Other Indo-European 2% French/Haitian/Cajun 2%
Political lean MEDSL · Capitol
- 2024 margin
- Strong D (+21.9) · D 60.1% · R 38.2% · Other 1.7%
- All cycles
- 2024: D+21.9
Not yet ingested
- Civics
- —
Market trends
- HPI YoY
- ▼ -175.76%
- Current HPI
- 198.4604
- Rent YoY
- ▲ 3.11%
- Metro
- Hartford-East Hartford-Middletown, CT
- State GDP YoY
- ▲ 1.06%
- F500 in state
- 38
Industry mix (Fortune 500 HQ in CT)
| Industry | F500 HQs | Revenue |
|---|---|---|
| Industrial Machinery | 4 | $38B |
|
||
| Insurance | 3 | $71B |
|
||
| Financial Services | 2 | $25B |
|
||
| Transportation / Logistics | 2 | $18B |
|
||
| Healthcare | 1 | $247B |
|
||
| Telecommunications | 1 | $55B |
|
||
Price history
+70.5% since first listed3 events — show timeline
- 2026-04-08 Listed $289,900 Smart MLS
- 2014-06-13 Sold (MLS) $170,000 Smart MLS
- 2014-04-25 Listed $170,000 Smart MLS
Cash-flow waterfall
monthlySold comps — $/sqft
last 12 mo · ≤1 miLoading sold comps…