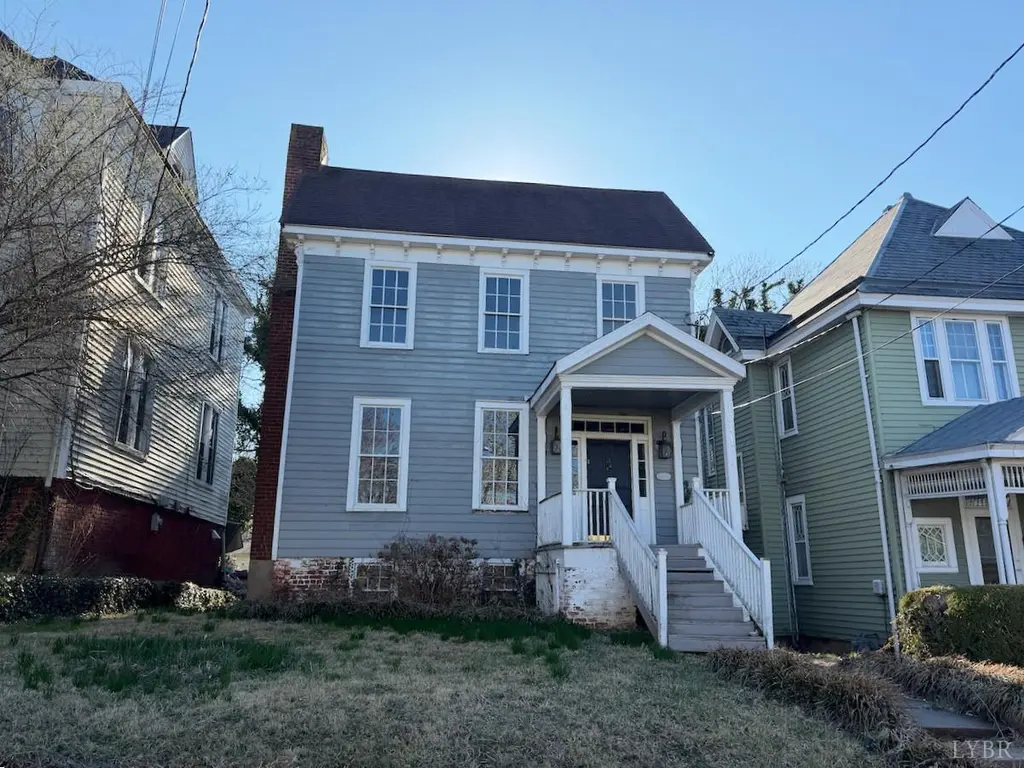
1011 Jackson St · Lynchburg, VA
Flood risk 1/10 · Minimal
- FEMA flood zone
- X (unshaded)
- Chance of flooding over 30 yrs
- 0.0%
- Est. flood insurance / yr
- $473 – $860
Fire risk 3/10 · Minor
- Est. fire insurance / yr
- $666 – $1,236
Heat risk 6/10 · Moderate
- Hot days now (above 102°F)
- 7 days/yr
- Hot days in 30 yrs
- 18 days/yr
Wind risk 2/10 · Minimal
- Chance of severe wind over 30 yrs
- 2.0%
Air-quality risk 2/10 · Minimal
- Unhealthy air days now
- 0 days/yr
- Unhealthy air days in 30 yrs
- 1 days/yr
Risk factors via First Street. Map © Google.
Why this score? — see what drove the C grade
The composite is a weighted blend of 9 inputs, each scored 0–100. Each bar is that input's sub-score; the figure is the points it added to the 100-point composite (weight × sub-score).
- Cash flow +19.3/30.0
- ARV discount +15.0/15.0
- DSCR +6.1/10.0
- Livability +4.5/5.0
- 1% rule +4.1/10.0
- Schools +4.0/10.0
- Rent growth +3.6/5.0
- Condition / age +2.5/5.0
- Appreciation +0.0/10.0
$165,000
🖨 Deal sheet 📄 Offer letter ✓ Due diligence
Listing remarks
This home offers solid potential with 3 level living, spacious rooms, and an unfinished basement. Located within a Historic District, this property offers significant renovation potential and investment opportunity. The three-bedroom, two-and-a-half-bathroom configuration provides a solid foundation for transformation. The historic designation adds lasting value and charm while offering unique possibilities for restoration. This represents an exceptional chance to create something special in a coveted location. Contact us today to arrange a viewing and discover this property's possibilities for yourself. This is a Fannie Mae HomePath property. First Time Buyers, complete the HomePath Ready
Key facts
- Historic designation
- Coveted location
- Renovation potential
Tags
Property features AI
Exterior
- Utilities: Public water; Public sewer
- Home design: Single family residence; Three stories
- Construction: Wood siding; Shingle roof; Basement present
- Exterior features: Garden; Patio; Porch; Has view
Interior
- Kitchen: Dishwasher; Electric range; Refrigerator
- Flooring: Ceramic tile; Wood
- Bathrooms: Two full bathrooms; One half bathroom
- Heating & cooling: Heat pump; Zoned heating; Zoned cooling; Has heating and cooling
- Interior features: Fireplace in the living room; Walk-out basement
- Laundry & utility: Laundry closet on the upper level; Electric water heater
Neighborhood map
What this means for you Summary
Snapshot
- This is a 2-bed/2.5-bath single-family listed at $165k.
Deal economics
- At list price, monthly cash flow is $182 ($2k/yr) — positive.
- The deal already cash-flows at list — no discount required.
- To meet the 1% rule (rent ≥ 1% of price), the offer needs to be $151k (8.7% below list).
- Recommended offer: $151k (8.7% below list) — sets the bar for 1% rule.
- Cap rate 7.6% vs local median 4.0% in Lynchburg — top-decile yield for the area; either an underpriced asset or a hidden risk that comps aren't pricing in. Stress-test before assuming the spread holds.
Location & tenants
- Location reads 91/100 on livability (#1 in VA, #58 nationally) — a professional / high-income tenant draw. Strengths: amenities A+, commute A+, cost of living A+; Watch: crime C-, employment D+.
- Lynchburg City Public School District (urban): math 36% / reading 61% proficiency, ranked #104 of 131 in VA (top 79%) — families likely to look elsewhere, expect single-tenant / working-renter base with shorter leases; 61% free/reduced lunch — lower-income household profile, screen leases tightly.
- Zoned schools: Perrymont Elementary (math 27% / reading 42%, grade F, #966 of 1,108 statewide, top 89%, 337 students, 95% FRL); Heritage High (math 32% / reading 77%, grade C-, #281 of 319 statewide, top 90%, 1,073 students, 94% FRL) — zoned schools average 94% FRL vs 61% district-wide (34 pts higher); higher-poverty schools than district average — tighter screening recommended.
- Market conditions: Rents rising fast (+4.6%/yr); 105 active listings in the ZIP; 11 comparable units currently listed for rent nearby; rentals leasing fast (median 14d on market — plan ~1-2 weeks tenant-placement turnaround); 45% of comp listings sitting > 30 days — soft ceiling on asking rent; 472 units permitted in Lynchburg city in 2024 (240 in 5+ unit buildings).
- This rent runs 34% of the median local income ($53k/yr) — at the standard rent-burdened threshold; future hikes will face affordability resistance.
Forward outlook
- Local home prices are declining (-3.0%/yr); year-one equity from $1k of loan paydown is wiped out by about $5k of value loss. Plan a longer hold.
- Lynchburg County population projected at +37% by 2050 — long-run rental-demand tailwind backs the buy-and-hold thesis.
Negotiation context
- It's been on market 28 days — a 2% lower offer ($163k) is reasonable based on typical stale-listing flexibility.
- 4 sale attempts since 12y ago with the ask held roughly flat each time — persistent listings suggest the price (not the market) is what's stuck; bring a comps-based counter.
- Current owner paid $34k; list at $165k implies a 378% gain — meaningful room to come down on a strong offer.
Risks & watch-outs
- Watch-outs: built in 1816 — expect roof / HVAC / electrical / plumbing capex.
- Climate carrying-cost: extreme-heat days projected 7→18/yr by 2055 (HVAC capex compounding) — expect insurance premiums to compound above CPI over the hold.
Questions for the listing agent
- Built in 1816 — when were the roof, HVAC, electrical panel, plumbing, and water heater last replaced?
- Is there a deadline driving the sale (1031 exchange, divorce, estate, relocation)? That informs how much negotiation room exists.
- Schools are A-rated — typically a magnet for longer-tenancy family renters. What's the average tenant stay here, and is there a school-zone premium baked into asking?
- What's the average days-on-market for RENTAL listings here right now (not sales)? A rising rental-DOM trend means longer vacancies and softer asking-rent achievability than the comps imply.
- What's the recent tenant-quality profile in this submarket — average credit score on applications, eviction rate, late-payment / NSF rate, and stable-employment percentage? A property-management company in the area should have these aggregated.
- How much new for-sale + rental construction is in the pipeline within 1–3 miles? Heavy new supply typically softens prices + rents 12–24 months out; constrained supply supports both.
Investment metrics
- 1% rule
- 0.91% ✗
- Cap rate
- 7.62%
- Cash-on-cash
- 4.72%
- DSCR
- 1.21
- GRM
- 9.1
CMA / ARV
- ARV (median comp)
- $220,926
- List price
- $165,000
- Delta
- -25.31%
- Verdict
- UNDERPRICED
- Comps
- 20 within 1.0 mi
Show comp detail 12 sales within ~0.75 mi
| Address | Dist | Beds/Ba | Sqft | Sold | Price | $/sf | Match |
|---|---|---|---|---|---|---|---|
| 915 11th St | 0.03mi | 3/2.5 (+1) | 2,207 (+5%) | 7mo | $220,000 | $100 | 78 |
| 1021 Harrison St | 0.12mi | 3/2.0 (+1) | 1,942 (-7%) | 2mo | $250,000 | $129 | 74 |
| 614 7th St | 0.28mi | 3/3.0 (+1) | 2,125 (+2%) | 10mo | $297,000 | $140 | 70 |
| 1413 Monroe St St | 0.30mi | 3/2.5 (+1) | 2,040 (-2%) | 13mo | $260,000 | $127 | 66 |
| 904 Wise St | 0.23mi | 3/2.5 (+1) | 2,022 (-3%) | 14mo | $174,900 | $86 | 66 |
| 1301 Clay St | 0.31mi | 3/3.5 (+1) | 2,038 (-3%) | 11mo | $334,000 | $164 | 63 |
| 612 Harrison St | 0.30mi | 3/3.5 (+1) | 2,258 (+8%) | 4mo | $195,000 | $86 | 61 |
| 713 Polk St | 0.22mi | 3/2.0 (+1) | 1,838 (-12%) | 3mo | $105,000 | $57 | 60 |
| 1603 Taylor St | 0.44mi | 3/1.5 (+1) | 1,948 (-7%) | 6mo | $90,500 | $46 | 54 |
| 722 Polk St | 0.19mi | 3/2.5 (+1) | 1,803 (-14%) | 12mo | $259,000 | $144 | 54 |
| 1204 Floyd St. St | 0.31mi | 3/2.0 (+1) | 1,846 (-12%) | 15mo | $229,900 | $125 | 47 |
| 509 Franklin St St | 0.58mi | 3/2.0 (+1) | 1,860 (-11%) | 2mo | $180,000 | $97 | 46 |
Match score weights: distance 35% · size 25% · config 20% · recency 20%. Top-matched comps best support the ARV.
Projected returns pro-forma
-3.0% appreciation · 4.56% rent growth · sell at horizon
- IRR
- -7.4%
- Equity multiple
- 0.72×
- Total profit
- $-12,816
- Equity at exit
- $24,602
- IRR
- 3.8%
- Equity multiple
- 1.30×
- Total profit
- $13,686
- Equity at exit
- $14,266
Cash invested: $46,200 (down + closing). Projections, not guarantees.
Landlord ↔ Tenant lean methodology
- Overall (STATE)
- 55 Moderately Landlord-Leaning
- State Virginia
- 55 Moderately Landlord-Leaning · D+2
- County
- — inherits STATE
- City
- — inherits STATE
ZIP-level market 24504
- Home prices YoY
- -12.7%
- Rents YoY
- 4.6%
- Active inventory
- 105
- Price-to-rent
- 9.1×
Monthly cashflow live
- Estimated rent
- $1,507 high interval (Pro) →
- Mortgage (P&I)
- −$865
- Tax from tax record
- −$74 /mo · $894/yr
- Insurance
- −$69
- HOA
- −$0
- Vacancy / Maint / Mgmt
- −$316
- Net cashflow
- $182
Break-even live
UW: 25.0% down · 7.5% · 30yr · 1.5% tax · 5.0% vac · 8.0% maint · 8.0% mgmt
Financing live
Cash to close
- Down payment
- $41,250
- Closing costs
- $4,950
- Reserves months
- —
- Total cash needed
- —
Loan-product check · same deal, 3 products live
Conventional
25% down · 7.5% · 30yr
- Down + closing
- —
- Monthly P&I
- —
- Monthly cashflow
- —
- DSCR
- —
- Eligible?
- —
Personal DTI + credit; lowest rate.
DSCR
20% down · 8.5% · 30yr
- Down + closing
- —
- Monthly P&I
- —
- Monthly cashflow
- —
- DSCR
- —
- Eligible?
- —
No personal income docs; deal must DSCR.
Hard money
10% down · 12.0% · 12mo
- Down + closing
- —
- Monthly P&I
- —
- Monthly cashflow
- —
- DSCR
- —
- Eligible?
- —
Short-term bridge; refi at stabilization.
Rent comps 11 comps
| Address | Beds | Baths | Sqft | Rent | $/sqft | DOM | Units | Dist |
|---|---|---|---|---|---|---|---|---|
| 1110 11th St Lynchburg, VA | 3.0 | 1.5 | 2000 | $1,450 | $0.72 | 13d | 1 | 0.15mi |
| 812 Taylor St Lynchburg, VA | 3.0 | 2.0 | 1872 | $1,950 | $1.04 | 13d | 1 | 0.20mi |
| 1316 Harrison St Lynchburg, VA | 3.0 | 1.5 | 1535 | $1,500 | $0.98 | 44d | 1 | 0.27mi |
| 1009 4th St Apt 1 Lynchburg, VA | 2.0 | 1.0 | 2607 | $795 | $0.30 | 44d | 1 | 0.46mi |
| 1514 Fillmore St Lynchburg, VA | 3.0 | 2.5 | 1560 | $1,800 | $1.15 | 13d | 1 | 0.49mi |
| 1518 Fillmore St Lynchburg, VA | 3.0 | 2.5 | 1560 | $1,800 | $1.15 | 13d | 1 | 0.50mi |
| 1500 Main St Lynchburg, VA | 1.0–2.0 | 1.0 | 1182 | $1,600 | $1.35 | 13d | 6 | 0.60mi |
| 209 Munford St Lynchburg, VA | 3.0 | 2.5 | 1420 | $1,497 | $1.05 | 44d | 1 | 0.87mi |
| 403 Grove St Lynchburg, VA | 3.0 | 2.0 | 1400 | $1,600 | $1.14 | 44d | 1 | 0.99mi |
| 710 Grady St Unit B Lynchburg, VA | 2.0 | 1.0 | 1872 | $795 | $0.42 | 13d | 1 | 1.02mi |
| 320 Kenyon St Lynchburg, VA | 3.0 | 2.0 | 1736 | $1,595 | $0.92 | 44d | 1 | 1.22mi |
Listing history 19 events
-
2026-06-09status $165,000 Pending 28 DOM
-
2026-06-08days on market $165,000 Active 28 DOM
-
2026-06-07days on market $165,000 Active 27 DOM
-
2026-06-03days on market $165,000 Active 23 DOM
-
2026-06-02days on market $165,000 Active 22 DOM
-
2026-06-01days on market $165,000 Active 21 DOM
-
2026-05-31days on market $165,000 Active 20 DOM
-
2026-05-30days on market $165,000 Active 19 DOM
-
2026-05-10$165,000 Active 861-char remark
-
2025-06-01status Pending
-
2025-05-20price $165,000
-
2025-04-30price $170,000
-
2025-04-14price $180,000
-
2025-03-23price $185,000
-
2025-02-13status Active
-
2025-01-17$195,000 Active
-
2014-08-06$289,500
-
2000-03-09soldstatus $34,500
-
2000-02-09soldstatus $25,000
ⓘ Source: listings_history table (triggers on properties + properties_extension) + one-shot
backfill from property_details.listing_events for pre-trigger history.
Tax reassessment forecast VA · Resets to sale price
- Current annual tax
- $894 · $74/mo
- Projected year-2 tax
- $1,353 · $113/mo
- Expected delta
- +$459/yr (+$38/mo · 51.4%)
ⓘ Screening estimate from a state-policy table — verify with the county assessor before closing.
Climate risk First Street
- Flood 1/10 Low FEMA zone X (unshaded) · 0% chance over 30 yrs
- Wildfire 3/10 Moderate
- Heat 6/10 Major 7 d/yr ≥102°F today · 18 d/yr by 30 yrs out
- Wind 2/10 Low 2% chance of damaging wind over 30 yrs
- Air quality 2/10 Low 0 unhealthy d/yr today · 1 by 30 yrs out
Nearby sold comps map
Loading sold comps map…
Walkable amenities ~0.75 mi
Loading nearby amenities…
Taxation est. · year 1
- Rental income
- $18,080
- − Mortgage interest
- −$9,243
- − Property taxes
- −$894
- − Insurance
- −$825
- − Repairs & maintenance
- −$1,446
- − Management
- −$1,446
- − Depreciation
- −$4,800
- Taxable loss
- −$574
- Est. tax savings @ 24.0%
- +$138
- After-tax cash flow
- $2,319/yr
For passive investors: Depreciation is non-cash, so a rental often shows a tax loss while cash-flowing — sheltering income. Rental losses are passive: they offset passive income freely, and up to $25,000/yr can offset ordinary (W-2) income if you actively participate and your MAGI is under $100k (phasing out to $0 by $150k); unused losses carry forward. On sale, claimed depreciation is recaptured at up to 25%, and gains may owe capital-gains tax (a 1031 exchange can defer both). Figures are a year-1 estimate at your 24.0% rate — not tax advice; consult a CPA.
Schools (NCES district)
- District
- Lynchburg City Public School District
- NCES district ID
- 5102340
- Math proficiency
- 36% ▼ -38.00%
- Reading proficiency
- 61% ▼ -8.00%
- Median HH income
- $39,097
- Composite
- 40.4/100
- National rank
- #3730
- State rank
- #104 of 131 in VA
Livability — Lynchburg
- Score
- 91/100
- State rank
- #1
- US rank
- #58
Category grades
Schools grade is shown separately in the Schools card above.
Census & demographics
- Census place
- Lynchburg, VA
- County
- Lynchburg City · 97,036 people
- City population
- 97,036
- Metro
- Lynchburg, VA
- Population (ZIP)
- 9,632
- Household income
- $52,571
- Rent vs Own
- Severe rent burden
- 552.0
Population outlook (Lynchburg County) Hauer SSP2
- Today (2025)
- 87,977 people
- By 2030
- 93,626 · +6.4%
- By 2040
- 106,145 · +20.7%
- By 2050
- 120,783 · +37.3%
- By 2075
- 162,249 · +84.4%
- By 2100
- 191,358 · +117.5%
Race, ethnicity, and origin ACS 2023
- Neighborhood character
- Diverse neighborhood (Simpson 0.57)
- Race & ethnicity
- White 51% Black 40% Two or more races 6% Hispanic / Latino 4%
- Common ancestry
- Italian 3% Lithuanian 1% Serbian 1%
- Foreign-born
- 4% · Canada, China
- Languages at home
- 95% English-only · Spanish 3% Chinese 1%
Political lean MEDSL · Lynchburg
- 2024 margin
- Lean R (+7.9) · D 45.4% · R 53.3% · Other 1.3%
- 2008→2024 swing
- -3.9pp toward R · 2008: -4.0pp · 2024: -7.9pp
- All cycles
- 2024: R+7.9 2020: D+2.6 2016: R+9.0 2012: R+10.6 2008: R+4.0
Not yet ingested
- Civics
- —
Market trends
- HPI YoY
- ▼ -33.39%
- Current HPI
- 229.4423
- Rent YoY
- ▲ 4.56%
- Metro
- Lynchburg, VA
- State GDP YoY
- ▲ 2.40%
- F500 in state
- 50
Industry mix (Fortune 500 HQ in VA)
| Industry | F500 HQs | Revenue |
|---|---|---|
| Aerospace / Defense | 4 | $236B |
|
||
| Technology / Defense | 3 | $32B |
|
||
| Financial Services | 2 | $176B |
|
||
| Utilities | 2 | $27B |
|
||
| Insurance | 2 | $25B |
|
||
| Technology | 2 | $15B |
|
||
Price history
+560.0% since first listed12 events — show timeline
- 2026-06-08 Pending — LMLS
- 2026-05-10 Listed $165,000 LMLS
- 2025-06-01 Pending — LMLS
- 2025-05-20 Price Changed $165,000 LMLS
- 2025-04-30 Price Changed $170,000 LMLS
- 2025-04-14 Price Changed $180,000 LMLS
- 2025-03-23 Price Changed $185,000 LMLS
- 2025-02-13 Relisted — LMLS
- 2025-01-17 Listed $195,000 LMLS
- 2014-08-06 Listed $289,500 LMLS
- 2000-03-09 Sold (Public Records) $34,500 Public Records
- 2000-02-09 Sold (Public Records) $25,000 Public Records
Property tax history
+3.1%/yrLatest (2025): $894 · +41.0% YoY. Source: county tax records.
Cash-flow waterfall
monthlySold comps — $/sqft
last 12 mo · ≤1 miLoading sold comps…