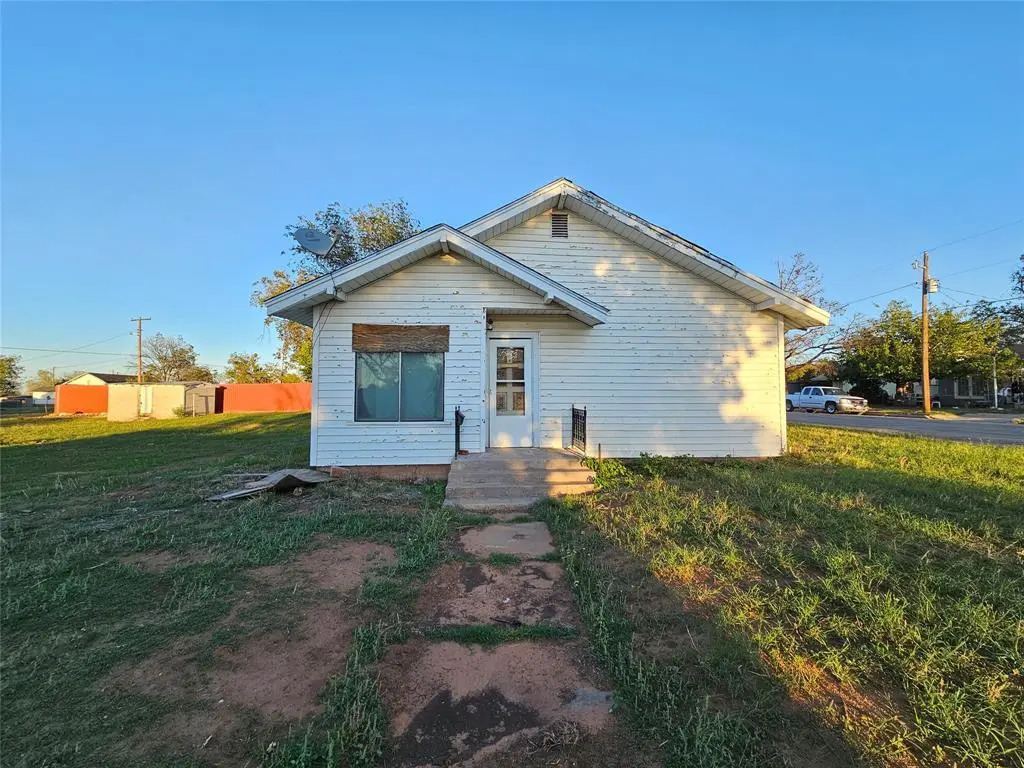
1211 Campbell St · Sweetwater, TX
Flood risk 1/10 · Minimal
- FEMA flood zone
- X
- Chance of flooding over 30 yrs
- 0.0%
- Est. flood insurance / yr
- $507 – $1,088
Fire risk 9/10 · Severe
- Est. fire insurance / yr
- $1,222 – $2,270
Heat risk 6/10 · Moderate
- Hot days now (above 103°F)
- 7 days/yr
- Hot days in 30 yrs
- 22 days/yr
Wind risk 4/10 · Minor
- Chance of severe wind over 30 yrs
- 8.0%
Air-quality risk 1/10 · Minimal
- Unhealthy air days now
- 0 days/yr
- Unhealthy air days in 30 yrs
- 0 days/yr
Risk factors via First Street. Map © Google.
Why this score? — see what drove the D grade
The composite is a weighted blend of 9 inputs, each scored 0–100. Each bar is that input's sub-score; the figure is the points it added to the 100-point composite (weight × sub-score).
- Cash flow +15.0/30.0
- ARV discount +7.5/15.0
- 1% rule +5.0/10.0
- DSCR +5.0/10.0
- Livability +3.3/5.0
- Rent growth +2.5/5.0
- Condition / age +2.5/5.0
- Schools +2.3/10.0
- Appreciation +0.0/10.0
$26,000
🖨 Deal sheet 📄 Offer letter ✓ Due diligence
Listing remarks
Great investment property with lots of potential to capitalize on including an additional lot to build or move a manufactured home on to. The house is a solid shell to work from with room to make a 3rd bedroom. Newer central heat and air interior unit and a great template just waiting to become a place to call home.
Key facts
- 0.32 acre lot
- Parking
- Built 1930
Property features AI
Finance
- Other: Property located in Bradford subdivision; Directions: From I-20 & SW Georgia, go north on Lamar, right on E New Mexico; home is on the left; County: Nolan; Country: United States
- Financial info: Listed for cash; Treat as clear loan type; No second mortgage indicated
- HOA & community: No association
Exterior
- Parking: Attached carport; 1 covered parking space; 1 carport space
- Utilities: City water; City sewer; Electricity connected; Overhead utilities; Asphalt streets; Curbs
- Home design: Single-family residence; One story; Residential property
- Construction: Built in 1930; Vinyl siding and wood construction; Composition roof; Pillar/post/pier foundation
- Exterior features: Corner lot; Easements for utilities
Interior
- Kitchen: No built-in appliances listed
- Bedrooms: 2 bedrooms (primary bedroom on level 1)
- Bathrooms: 2 full bathrooms
- Heating & cooling: Central heating (natural gas); Central air conditioning (electric)
- Interior features: High-speed internet available; One living area; One dining area; Total of 2 rooms
- Laundry & utility: No laundry appliances listed
Neighborhood map
What this means for you Summary
Snapshot
- This is a 2-bed/1.0-bath single-family listed at $26k.
Deal economics
- At list price, monthly cash flow is $1k ($12k/yr) — positive.
- The deal already cash-flows at list — no discount required.
- Meets the 1% rule at list price ($2k rent vs $26k).
- Recommended offer: $25k (3.0% below list) — sets the bar for market timing.
- Cap rate 54.1% vs local median 6.1% in Sweetwater — top-decile yield for the area; either an underpriced asset or a hidden risk that comps aren't pricing in. Stress-test before assuming the spread holds.
Location & tenants
- Location reads 66/100 on livability (#640 in TX) — a middle-class / working-renter tenant base. Strengths: cost of living A+, housing A+, health & safety A+; Watch: crime D+, amenities F, commute F.
- Sweetwater ISD (town): math 27% / reading 29% proficiency, ranked #681 of 826 in TX (top 82%) — low school quality limits family demand, transient renter base, plan for 1-2y turnover.
- Zoned schools: Southeast El (265 students, 87% FRL) — zoned schools average 87% FRL vs 55% district-wide (31 pts higher); higher-poverty schools than district average — tighter screening recommended.
- Market conditions: 108 active listings in the ZIP; 1 comparable units currently listed for rent nearby; 15 units permitted in Nolan County in 2024 (0 in 5+ unit buildings).
Forward outlook
- Local home prices are declining (-3.0%/yr); year-one equity from $180 of loan paydown is wiped out by about $780 of value loss. Plan a longer hold.
- Nolan County population projected at +4% by 2050 — modest demand growth; plan on rents tracking national, not racing it.
- At projected returns (-3.0% appreciation + 3.0% rent growth), your $7k cash investment doubles in ~1 year — after that, you're playing with house money.
Negotiation context
- It's been on market 44 days — a 3% lower offer ($25k) is reasonable based on typical stale-listing flexibility.
Risks & watch-outs
- Watch-outs: property tax is 3.5% of price; built in 1930 — expect roof / HVAC / electrical / plumbing capex.
- Climate carrying-cost: severe wildfire risk; extreme-heat days projected 7→22/yr by 2055 (HVAC capex compounding) — expect insurance premiums to compound above CPI over the hold.
Questions for the listing agent
- It's been on market 44 days. Have you received any prior offers? Is the seller open to a 3% concession, seller financing, or rate buy-down credit?
- Built in 1930 — when were the roof, HVAC, electrical panel, plumbing, and water heater last replaced?
- Property tax is high relative to price — has the assessment been appealed recently, and will the sale trigger a re-assessment?
- Is there a deadline driving the sale (1031 exchange, divorce, estate, relocation)? That informs how much negotiation room exists.
- Schools are F-rated, which usually means shorter tenancies and higher turnover. Who's the typical renter profile here, and what's been the actual vacancy rate?
- Crime grade is D in this area — have there been break-ins, vandalism, or insurance claims at this property in the last 3 years? What carrier currently insures it and at what premium?
- The area grade is low — what's the realistic commute time and amenity access for the typical tenant pool here? Any planned neighborhood developments (good or bad) we should know about?
- What's the average days-on-market for RENTAL listings here right now (not sales)? A rising rental-DOM trend means longer vacancies and softer asking-rent achievability than the comps imply.
- What's the recent tenant-quality profile in this submarket — average credit score on applications, eviction rate, late-payment / NSF rate, and stable-employment percentage? A property-management company in the area should have these aggregated.
- How much new for-sale + rental construction is in the pipeline within 1–3 miles? Heavy new supply typically softens prices + rents 12–24 months out; constrained supply supports both.
Investment metrics
- 1% rule
- 6.13% ✓
- Cap rate
- 54.11%
- Cash-on-cash
- 170.78%
- DSCR
- 8.60
- GRM
- 1.4
CMA / ARV
- ARV (median comp)
- $110,941
- List price
- $26,000
- Delta
- -76.56%
- Verdict
- UNDERPRICED
- Comps
- 18 within 1.0 mi
Show comp detail 4 sales within ~0.75 mi
| Address | Dist | Beds/Ba | Sqft | Sold | Price | $/sf | Match |
|---|---|---|---|---|---|---|---|
| 411 W New Mexico Ave | 0.48mi | 3/2.5 (+1) | 1,445 (+10%) | 1mo | $199,000 | $138 | 48 |
| 714 Sam Houston St | 0.66mi | 3/2.0 (+1) | 1,220 (-7%) | 12mo | $155,000 | $127 | 39 |
| 600 Lamar | 0.59mi | 3/2.0 (+1) | 1,400 (+7%) | 22mo | $169,000 | $121 | 34 |
| 911 Brookside St | 0.59mi | 3/2.0 (+1) | 1,508 (+15%) | 22mo | $139,999 | $93 | 20 |
Match score weights: distance 35% · size 25% · config 20% · recency 20%. Top-matched comps best support the ARV.
Projected returns pro-forma
-3.0% appreciation · 3.0% rent growth · sell at horizon
- IRR
- —
- Equity multiple
- 9.49×
- Total profit
- $61,825
- Equity at exit
- $3,877
- IRR
- —
- Equity multiple
- 20.10×
- Total profit
- $139,012
- Equity at exit
- $2,248
Cash invested: $7,280 (down + closing). Projections, not guarantees.
Landlord ↔ Tenant lean methodology
- Overall (STATE)
- 87 Strongly Landlord-Friendly
- State Texas
- 87 Strongly Landlord-Friendly · R+5
- County
- — inherits STATE
- City
- — inherits STATE
ZIP-level market 79556
- Active inventory
- 108
- Price-to-rent
- 1.4×
Monthly cashflow live
- Estimated rent
- $1,595 medium interval (Pro) →
- Mortgage (P&I)
- −$136
- Tax from tax record
- −$77 /mo · $922/yr
- Insurance
- −$11
- HOA
- −$0
- Vacancy / Maint / Mgmt
- −$335
- Net cashflow
- $1,036
Break-even live
UW: 25.0% down · 7.5% · 30yr · 1.5% tax · 5.0% vac · 8.0% maint · 8.0% mgmt
Financing live
Cash to close
- Down payment
- $6,500
- Closing costs
- $780
- Reserves months
- —
- Total cash needed
- —
Loan-product check · same deal, 3 products live
Conventional
25% down · 7.5% · 30yr
- Down + closing
- —
- Monthly P&I
- —
- Monthly cashflow
- —
- DSCR
- —
- Eligible?
- —
Personal DTI + credit; lowest rate.
DSCR
20% down · 8.5% · 30yr
- Down + closing
- —
- Monthly P&I
- —
- Monthly cashflow
- —
- DSCR
- —
- Eligible?
- —
No personal income docs; deal must DSCR.
Hard money
10% down · 12.0% · 12mo
- Down + closing
- —
- Monthly P&I
- —
- Monthly cashflow
- —
- DSCR
- —
- Eligible?
- —
Short-term bridge; refi at stabilization.
Rent comps 1 comps
| Address | Beds | Baths | Sqft | Rent | $/sqft | DOM | Units | Dist |
|---|---|---|---|---|---|---|---|---|
| 1310 Bell St Sweetwater, TX | 3.0 | 2.0 | 1305 | $1,595 | $1.22 | 43d | 1 | 0.44mi |
Listing history 19 events
-
2026-06-18days on market $26,000 Active 44 DOM
-
2026-06-17days on market $26,000 Active 43 DOM
-
2026-06-17price $26,000 Active 42 DOM
-
2026-06-16days on market $27,000 Active 42 DOM
-
2026-06-15days on market $27,000 Active 41 DOM
-
2026-06-15days on market $27,000 Active 40 DOM
-
2026-06-13days on market $27,000 Active 39 DOM
-
2026-06-12days on market $27,000 Active 38 DOM
-
2026-06-09days on market $27,000 Active 35 DOM
-
2026-06-08days on market $27,000 Active 34 DOM
-
2026-06-08days on market $27,000 Active 33 DOM
-
2026-06-07days on market $27,000 Active 32 DOM
-
2026-06-03days on market $27,000 Active 29 DOM
-
2026-06-02days on market $27,000 Active 28 DOM
-
2026-06-01days on market $27,000 Active 27 DOM
-
2026-05-31days on market $27,000 Active 26 DOM
-
2026-05-11price $27,000 317-char remark
-
2026-05-05$33,000 Active 317-char remark
-
2003-11-26soldstatus
ⓘ Source: listings_history table (triggers on properties + properties_extension) + one-shot
backfill from property_details.listing_events for pre-trigger history.
Tax reassessment forecast TX · Resets to sale price
- Current annual tax
- $922 · $77/mo
- Projected year-2 tax
- $922 · $77/mo
- Expected delta
- $0/yr ($0/mo · 0.0%)
ⓘ Screening estimate from a state-policy table — verify with the county assessor before closing.
Climate risk First Street
- Flood 1/10 Low FEMA zone X · 0% chance over 30 yrs
- Wildfire 9/10 Extreme
- Heat 6/10 Major 7 d/yr ≥103°F today · 22 d/yr by 30 yrs out
- Wind 4/10 Moderate 8% chance of damaging wind over 30 yrs
- Air quality 1/10 Low 0 unhealthy d/yr today · 0 by 30 yrs out
Nearby sold comps map
Loading sold comps map…
Walkable amenities ~0.75 mi
Loading nearby amenities…
Taxation est. · year 1
- Rental income
- $19,140
- − Mortgage interest
- −$1,456
- − Property taxes
- −$922
- − Insurance
- −$130
- − Repairs & maintenance
- −$1,531
- − Management
- −$1,531
- − Depreciation
- −$756
- Taxable income
- $12,813
- Est. tax owed @ 24.0%
- −$3,075
- After-tax cash flow
- $9,357/yr
For passive investors: Depreciation is non-cash, so a rental often shows a tax loss while cash-flowing — sheltering income. Rental losses are passive: they offset passive income freely, and up to $25,000/yr can offset ordinary (W-2) income if you actively participate and your MAGI is under $100k (phasing out to $0 by $150k); unused losses carry forward. On sale, claimed depreciation is recaptured at up to 25%, and gains may owe capital-gains tax (a 1031 exchange can defer both). Figures are a year-1 estimate at your 24.0% rate — not tax advice; consult a CPA.
Schools (NCES district)
- District
- Sweetwater ISD
- NCES district ID
- 4842030
- Math proficiency
- 27% ▼ -11.00%
- Reading proficiency
- 29% ▼ -4.00%
- Median HH income
- $37,599
- Composite
- 23.36/100
- National rank
- #7912
- State rank
- #681 of 826 in TX
Livability — Sweetwater
- Score
- 66/100
- State rank
- #640
- US rank
- #12189
Category grades
Schools grade is shown separately in the Schools card above.
Census & demographics
- Census place
- Sweetwater, TX
- City population
- 12,593
- Population (ZIP)
- 12,593
Population outlook (Nolan County) Hauer SSP2
- Today (2025)
- 15,048 people
- By 2030
- 15,043 · +-0.0%
- By 2040
- 15,235 · +1.2%
- By 2050
- 15,603 · +3.7%
- By 2075
- 16,528 · +9.8%
- By 2100
- 16,427 · +9.2%
Race, ethnicity, and origin ACS 2023
- Neighborhood character
- Diverse neighborhood (Simpson 0.58)
- Race & ethnicity
- White 53% Hispanic / Latino 38% Two or more races 19% Black 4%
- Hispanic origin (detail)
- Mexican 35%
- Common ancestry
- Slovak 1% Italian 1% Lithuanian 1%
- Foreign-born
- 4% · Canada, Dominican Republic
- Languages at home
- 77% English-only · Spanish 22%
Political lean MEDSL · Nolan
- 2024 margin
- Solid R (+59.2) · D 19.9% · R 79.2%
- 2008→2024 swing
- -20.4pp toward R · 2008: -38.8pp · 2024: -59.2pp
- All cycles
- 2024: R+59.2 2020: R+55.4 2016: R+53.2 2012: R+45.1 2008: R+38.8
Not yet ingested
- Civics
- —
Market trends
- HPI YoY
- ▼ -129.76%
- Current HPI
- 123.8718
- Rent YoY
- —
- Metro
- —
- State GDP YoY
- ▲ 3.95%
- F500 in state
- 110
Industry mix (Fortune 500 HQ in TX)
| Industry | F500 HQs | Revenue |
|---|---|---|
| Energy | 16 | $1,198B |
|
||
| Technology | 5 | $198B |
|
||
| Engineering / Construction | 4 | $72B |
|
||
| Energy Services | 3 | $60B |
|
||
| Utilities | 3 | $41B |
|
||
| Healthcare | 2 | $330B |
|
||
Price history
-21.2% since first listed4 events — show timeline
- 2026-06-16 Price Changed $26,000 NTREIS
- 2026-05-11 Price Changed $27,000 NTREIS
- 2026-05-05 Listed $33,000 NTREIS
- 2003-11-26 Sold (Public Records) — Public Records
Property tax history
+2.0%/yrLatest (2025): $922 · -15.1% YoY. Source: county tax records.
Cash-flow waterfall
monthlySold comps — $/sqft
last 12 mo · ≤1 miLoading sold comps…