 🏷️ Likely Rental
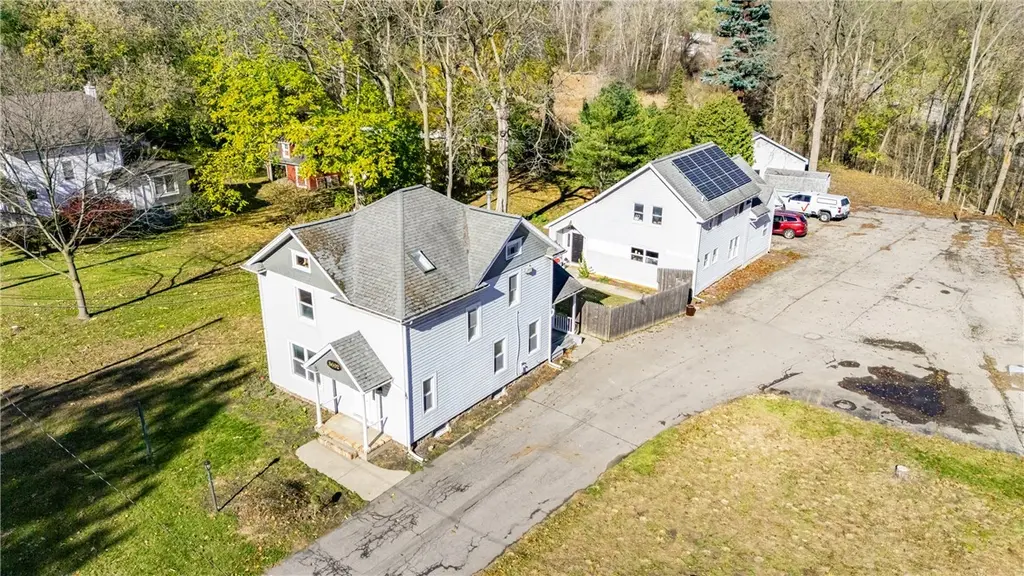
5692 Pittsford Palmyra Rd · East Rochester, NY
Flood risk No data
- FEMA flood zone
- —
- Chance of flooding over 30 yrs
- —
- Est. flood insurance / yr
- —
Fire risk No data
- Est. fire insurance / yr
- —
Heat risk No data
- Hot days now (above threshold)
- —
- Hot days in 30 yrs
- —
Wind risk No data
- Chance of severe wind over 30 yrs
- —
Air-quality risk No data
- Unhealthy air days now
- —
- Unhealthy air days in 30 yrs
- —
Risk factors via First Street. Map © Google.
Why this score? — see what drove the F grade
The composite is a weighted blend of 9 inputs, each scored 0–100. Each bar is that input's sub-score; the figure is the points it added to the 100-point composite (weight × sub-score).
- ARV discount +7.5/15.0
- Schools +7.5/10.0
- Cash flow +7.4/30.0
- Livability +3.9/5.0
- Rent growth +2.5/5.0
- Condition / age +2.5/5.0
- 1% rule +2.1/10.0
- DSCR +1.5/10.0
- Appreciation +0.0/10.0
$439,900
🖨 Deal sheet 📄 Offer letter ✓ Due diligence
Listing remarks
GREAT OPPORTUNITY TO MAKE THIS YOUR OWN * OWNER HAS INVESTED CLOSE TO $100K IN COMPLETELY GUTTED INTERIOR, TREE REMOVAL, SEPTIC, ARCHITECTURAL PLANS * IDEAL PITTSFORD LOCATION + PITTSFORD SCHOOLS * * CREATE YOUR OWN HOME OR IN-HOME BUSINESS + APARTMENT ON 2ND FLOOR * POSSIBLE SINGLE FAMILY HOME WITH 3 BEDROOMS UPSTAIRS + LOFT AREA IN ONE OF THE BEDROOMS * CLEAN, DRY BASEMENT * BRAND NEW SEPTIC SYSTEM * * MULTI-USE PROPERTY * * 2ND HOME HAS CURRENT MONTH TO MONTH TENANTS * * * 2.2 ACRES * * SHED * PARKING FOR 21 CARS * * CELL TOWER HAS 20" WIDE EASEMENT-SELLER HAS NO OWNERSHIP TO CELL TOWER *
Key facts
- Architectural plans
- 2.2 acres
- Multi-use property
Tags
Neighborhood map
What this means for you Summary
Snapshot
- This is a 3-bed/2.0-bath single-family listed at $440k.
Deal economics
- At list price, monthly cash flow is $-573 ($-7k/yr) — negative.
- To cash-flow at today's rent, offer at most $357k (18.9% below list).
- To meet the 1% rule (rent ≥ 1% of price), the offer needs to be $312k (29.0% below list).
- Recommended offer: $312k (29.0% below list) — sets the bar for 1% rule.
Location & tenants
- Location reads 78/100 on livability (#155 in NY, #2,400 nationally) — a middle-class / working-renter tenant base. Strengths: amenities A+, cost of living A+, housing A+; Watch: employment D+, crime D.
- Pittsford Central School District (suburban): math 80% / reading 84% proficiency, ranked #34 of 590 in NY (top 6%) — strong family-tenant draw, lease renewals of 3-5y typical; only 2% free/reduced lunch — higher-income household profile.
- Market conditions: 186 active listings in the ZIP; high-income renter base; 1,169 units permitted in Monroe County in 2024 (591 in 5+ unit buildings).
Forward outlook
- Local home prices are declining (-3.0%/yr); year-one equity from $3k of loan paydown is wiped out by about $13k of value loss. Plan a longer hold.
- Monroe County population projected to shrink 6% by 2050 — rents likely to lag national; underwrite the cash flow, not the appreciation.
Negotiation context
- It's been on market 108 days — a 9% lower offer ($400k) is reasonable based on typical stale-listing flexibility.
- 4 sale attempts with the ask held roughly flat each time — persistent listings suggest the price (not the market) is what's stuck; bring a comps-based counter.
Risks & watch-outs
- Watch-outs: built in 1870 — expect roof / HVAC / electrical / plumbing capex.
Questions for the listing agent
- What do current leases actually rent for vs. the listed asking? Can we see a recent rent roll and the last 12 months of T-12 income?
- It's been on market 108 days. Have you received any prior offers? Is the seller open to a 29% concession, seller financing, or rate buy-down credit?
- Built in 1870 — when were the roof, HVAC, electrical panel, plumbing, and water heater last replaced?
- Why hasn't it sold? Are there any deal-killer items the seller is aware of (foundation, flood, title, zoning, code violations)?
- Is there a deadline driving the sale (1031 exchange, divorce, estate, relocation)? That informs how much negotiation room exists.
- Schools are A-rated — typically a magnet for longer-tenancy family renters. What's the average tenant stay here, and is there a school-zone premium baked into asking?
- Crime grade is D in this area — have there been break-ins, vandalism, or insurance claims at this property in the last 3 years? What carrier currently insures it and at what premium?
- The area grade is low — what's the realistic commute time and amenity access for the typical tenant pool here? Any planned neighborhood developments (good or bad) we should know about?
- What's the average days-on-market for RENTAL listings here right now (not sales)? A rising rental-DOM trend means longer vacancies and softer asking-rent achievability than the comps imply.
- What's the recent tenant-quality profile in this submarket — average credit score on applications, eviction rate, late-payment / NSF rate, and stable-employment percentage? A property-management company in the area should have these aggregated.
- How much new for-sale + rental construction is in the pipeline within 1–3 miles? Heavy new supply typically softens prices + rents 12–24 months out; constrained supply supports both.
Investment metrics
- 1% rule
- 0.71% ✗
- Cap rate
- 4.73%
- Cash-on-cash
- -5.59%
- DSCR
- 0.75
- GRM
- 11.7
CMA / ARV
- ARV (median comp)
- $1,106,938
- List price
- $439,900
- Delta
- -60.26%
- Verdict
- UNDERPRICED
- Comps
- 2 within 1.0 mi
Projected returns pro-forma
-3.0% appreciation · 3.0% rent growth · sell at horizon
- IRR
- -25.8%
- Equity multiple
- 0.13×
- Total profit
- $-107,748
- Equity at exit
- $65,591
- IRR
- -22.4%
- Equity multiple
- -0.14×
- Total profit
- $-140,650
- Equity at exit
- $38,035
Cash invested: $123,172 (down + closing). Projections, not guarantees.
Landlord ↔ Tenant lean methodology
- Overall (STATE)
- 15 Strongly Tenant-Friendly
- State New York
- 15 Strongly Tenant-Friendly · D+10
- County
- — inherits STATE
- City
- — inherits STATE
ZIP-level market 14534
- Active inventory
- 186
- Price-to-rent
- 11.7×
Monthly cashflow live
- Estimated rent
- $3,122 medium interval (Pro) →
- Mortgage (P&I)
- −$2,307
- Tax est. 1.5%
- −$550 /mo · $6,598/yr
- Insurance
- −$183
- HOA
- −$0
- Vacancy / Maint / Mgmt
- −$656
- Net cashflow
- $-573
Break-even live
UW: 25.0% down · 7.5% · 30yr · 1.5% tax · 5.0% vac · 8.0% maint · 8.0% mgmt
Financing live
Cash to close
- Down payment
- $109,975
- Closing costs
- $13,197
- Reserves months
- —
- Total cash needed
- —
Loan-product check · same deal, 3 products live
Conventional
25% down · 7.5% · 30yr
- Down + closing
- —
- Monthly P&I
- —
- Monthly cashflow
- —
- DSCR
- —
- Eligible?
- —
Personal DTI + credit; lowest rate.
DSCR
20% down · 8.5% · 30yr
- Down + closing
- —
- Monthly P&I
- —
- Monthly cashflow
- —
- DSCR
- —
- Eligible?
- —
No personal income docs; deal must DSCR.
Hard money
10% down · 12.0% · 12mo
- Down + closing
- —
- Monthly P&I
- —
- Monthly cashflow
- —
- DSCR
- —
- Eligible?
- —
Short-term bridge; refi at stabilization.
Listing history 20 events
-
2026-06-18days on market $439,900 Active 108 DOM
-
2026-06-17days on market $439,900 Active 107 DOM
-
2026-06-16days on market $439,900 Active 106 DOM
-
2026-06-15days on market $439,900 Active 105 DOM
-
2026-06-13days on market $439,900 Active 103 DOM
-
2026-06-13days on market $439,900 Active 102 DOM
-
2026-06-10days on market $439,900 Active 100 DOM
-
2026-06-09days on market $439,900 Active 99 DOM
-
2026-06-09days on market $439,900 Active 98 DOM
-
2026-06-07days on market $439,900 Active 97 DOM
-
2026-06-03days on market $439,900 Active 93 DOM
-
2026-06-03days on market $439,900 Active 92 DOM
-
2026-06-01days on market $439,900 Active 91 DOM
-
2026-05-31days on market $439,900 Active 90 DOM
-
2026-03-02historical
-
2026-03-02historical
-
2026-03-02$439,900 Active
-
2026-03-02$439,900 Active
-
2025-11-05$449,900 Active
-
2025-11-05$449,900 Active
ⓘ Source: listings_history table (triggers on properties + properties_extension) + one-shot
backfill from property_details.listing_events for pre-trigger history.
Nearby sold comps map
Loading sold comps map…
Walkable amenities ~0.75 mi
Loading nearby amenities…
Taxation est. · year 1
- Rental income
- $37,470
- − Mortgage interest
- −$24,641
- − Property taxes
- −$6,598
- − Insurance
- −$2,200
- − Repairs & maintenance
- −$2,998
- − Management
- −$2,998
- − Depreciation
- −$12,797
- Taxable loss
- −$14,762
- Est. tax savings @ 24.0%
- +$3,543
- After-tax cash flow
- $-3,337/yr
For passive investors: Depreciation is non-cash, so a rental often shows a tax loss while cash-flowing — sheltering income. Rental losses are passive: they offset passive income freely, and up to $25,000/yr can offset ordinary (W-2) income if you actively participate and your MAGI is under $100k (phasing out to $0 by $150k); unused losses carry forward. On sale, claimed depreciation is recaptured at up to 25%, and gains may owe capital-gains tax (a 1031 exchange can defer both). Figures are a year-1 estimate at your 24.0% rate — not tax advice; consult a CPA.
Schools (NCES district)
- District
- Pittsford Central School District
- NCES district ID
- 3623160
- Math proficiency
- 80% ▼ -4.00%
- Reading proficiency
- 84% ▲ 7.00%
- Median HH income
- $106,940
- Composite
- 74.75/100
- National rank
- #151
- State rank
- #34 of 590 in NY
Livability — East Rochester
- Score
- 78/100
- State rank
- #155
- US rank
- #2400
Category grades
Schools grade is shown separately in the Schools card above.
Census & demographics
- County
- Monroe County · 674,131 people
- City population
- 7,529
- Metro
- Rochester, NY
- Population (ZIP)
- 33,230
- Household income
- $143,694
- Rent vs Own
- Severe rent burden
- 398.0
Population outlook (Monroe County) Hauer SSP2
- Today (2025)
- 759,460 people
- By 2030
- 757,154 · -0.3%
- By 2040
- 740,644 · -2.5%
- By 2050
- 714,443 · -5.9%
- By 2075
- 645,883 · -15.0%
- By 2100
- 547,084 · -28.0%
Race, ethnicity, and origin ACS 2023
- Neighborhood character
- Predominantly White (81%)
- Race & ethnicity
- White 81% Asian 8% Two or more races 6% Hispanic / Latino 4% Black 2%
- Common ancestry
- Romanian 5% Italian 4% Lithuanian 3%
- Foreign-born
- 12% · Canada, China, South Korea
- Languages at home
- 87% English-only · Other Indo-European 3% Chinese 2% Spanish 2%
Political lean MEDSL · Monroe
- 2024 margin
- D (+19.1) · D 59.5% · R 40.5%
- 2008→2024 swing
- +1.4pp toward D · 2008: 17.7pp · 2024: 19.1pp
- All cycles
- 2024: D+19.1 2020: D+21.0 2016: D+14.1 2012: D+17.4 2008: D+17.7
Not yet ingested
- Civics
- —
Market trends
- HPI YoY
- ▼ -232.40%
- Current HPI
- 258.0726
- Rent YoY
- —
- Metro
- Rochester, NY
- State GDP YoY
- ▲ 2.60%
- F500 in state
- 92
Industry mix (Fortune 500 HQ in NY)
| Industry | F500 HQs | Revenue |
|---|---|---|
| Financial Services | 10 | $950B |
|
||
| Consumer Goods | 9 | $162B |
|
||
| Insurance | 4 | $225B |
|
||
| Telecommunications | 2 | $144B |
|
||
| Pharmaceuticals | 2 | $112B |
|
||
| Media / Entertainment | 2 | $69B |
|
||
Price history
-2.2% since first listed6 events — show timeline
- 2026-03-02 Listed $439,900 UNYREIS
- 2026-03-02 Listed $439,900 UNYREIS
- 2026-03-02 Listing Removed — UNYREIS
- 2026-03-02 Listing Removed — UNYREIS
- 2025-11-05 Listed $449,900 UNYREIS
- 2025-11-05 Listed $449,900 UNYREIS
Cash-flow waterfall
monthlySold comps — $/sqft
last 12 mo · ≤1 miLoading sold comps…