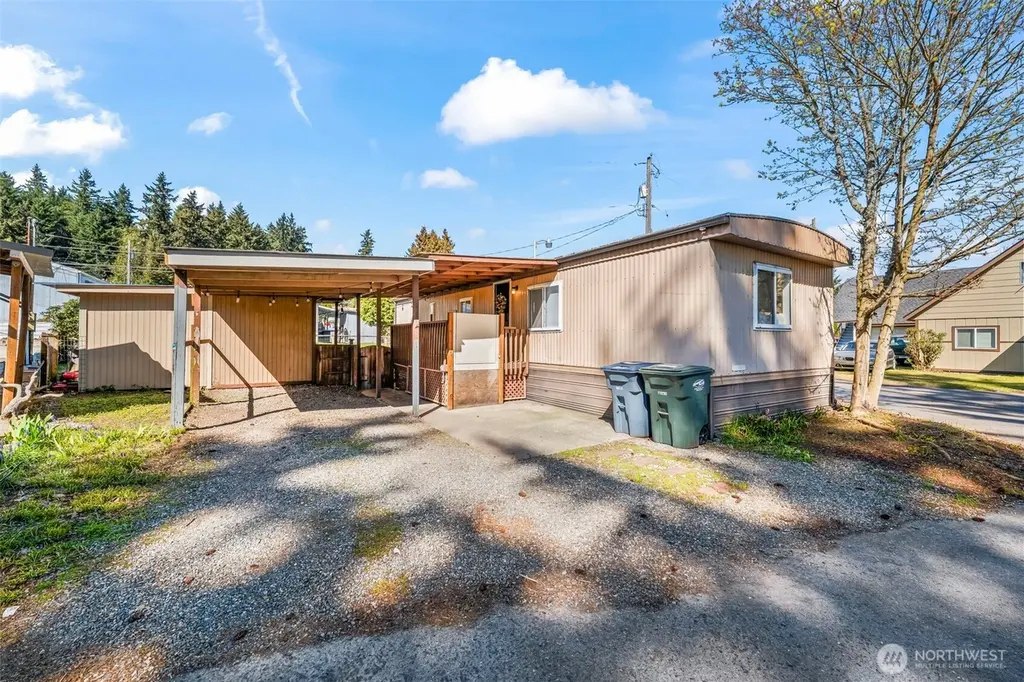
7311 Chambers Creek Rd W #9 · University Place, WA
Flood risk 1/10 · Minimal
- FEMA flood zone
- X (unshaded)
- Chance of flooding over 30 yrs
- 0.0%
- Est. flood insurance / yr
- $507 – $1,088
Fire risk 1/10 · Minimal
- Est. fire insurance / yr
- $604 – $1,122
Heat risk 3/10 · Minor
- Hot days now (above 86°F)
- 7 days/yr
- Hot days in 30 yrs
- 14 days/yr
Wind risk 1/10 · Minimal
- Chance of severe wind over 30 yrs
- —
Air-quality risk 7/10 · Major
- Unhealthy air days now
- 11 days/yr
- Unhealthy air days in 30 yrs
- 12 days/yr
Risk factors via First Street. Map © Google.
Why this score? — see what drove the B grade
The composite is a weighted blend of 9 inputs, each scored 0–100. Each bar is that input's sub-score; the figure is the points it added to the 100-point composite (weight × sub-score).
- Cash flow +30.0/30.0
- 1% rule +10.0/10.0
- DSCR +10.0/10.0
- ARV discount +7.5/15.0
- Schools +6.4/10.0
- Livability +4.4/5.0
- Rent growth +2.5/5.0
- Condition / age +2.5/5.0
- Appreciation +0.0/10.0
$68,000
🖨 Deal sheet 📄 Offer letter ✓ Due diligence
Listing remarks
Welcome to this 2 bedroom, 1 bath manufactured home in Sunrise Terrace. Located on the end/corner, this unit provides one of only two homes in the community with a fully fenced yard—ideal for relaxing, gardening, or pets. Updated and well maintained, it offers a comfortable, move-in ready feel throughout. The kitchen features stainless steel appliances-refrigerator and washer/dryer are included. The open kitchen concept flows seamlessly to the living room. Plenty of parking with 2 designated parking spots, ample guest parking is located right across the unit. A huge bonus-an oversized shed with lots of shelving on-site, great for storage use, tools or projects! Located in desirable Un
Key facts
- Oversized shed
- Open kitchen concept
- Fully fenced yard
Tags
Neighborhood map
What this means for you Summary
Snapshot
- This is a 2-bed/1.0-bath manufactured listed at $68k.
Deal economics
- At list price, monthly cash flow is $787 ($9k/yr) — positive.
- The deal already cash-flows at list — no discount required.
- Meets the 1% rule at list price ($2k rent vs $68k).
- Recommended offer: $66k (3.0% below list) — sets the bar for market timing.
- Cap rate 20.2% vs local median 2.2% in University Place — top-decile yield for the area; either an underpriced asset or a hidden risk that comps aren't pricing in. Stress-test before assuming the spread holds.
Location & tenants
- Location reads 87/100 on livability (#17 in WA, #320 nationally) — a professional / high-income tenant draw. Strengths: schools A+, commute A+, employment A+; Watch: cost of living F.
- University Place School District (suburban): math 70% / reading 77% proficiency, ranked #14 of 291 in WA (top 5%) — strong family-tenant draw, lease renewals of 3-5y typical.
- Market conditions: 69 active listings in the ZIP; 32 comparable units currently listed for rent nearby; rentals leasing fast (median 8d on market — plan ~1-2 weeks tenant-placement turnaround); 3,209 units permitted in Pierce County in 2024 (1,269 in 5+ unit buildings).
Forward outlook
- Local home prices are declining (-3.0%/yr); year-one equity from $470 of loan paydown is wiped out by about $2k of value loss. Plan a longer hold.
- Pierce County population projected at +26% by 2050 — long-run rental-demand tailwind backs the buy-and-hold thesis.
- At projected returns (-3.0% appreciation + 3.0% rent growth), your $19k cash investment doubles in ~3 years — after that, you're playing with house money.
Negotiation context
- It's been on market 38 days — a 3% lower offer ($66k) is reasonable based on typical stale-listing flexibility.
- 4 sale attempts since 26y ago with the ask held roughly flat each time — persistent listings suggest the price (not the market) is what's stuck; bring a comps-based counter.
- Current owner paid $50k; 36% above their basis — modest negotiation headroom, anchor on the comps not their cost.
Questions for the listing agent
- It's been on market 38 days. Have you received any prior offers? Is the seller open to a 3% concession, seller financing, or rate buy-down credit?
- Is there a deadline driving the sale (1031 exchange, divorce, estate, relocation)? That informs how much negotiation room exists.
- Schools are A-rated — typically a magnet for longer-tenancy family renters. What's the average tenant stay here, and is there a school-zone premium baked into asking?
- What's the average days-on-market for RENTAL listings here right now (not sales)? A rising rental-DOM trend means longer vacancies and softer asking-rent achievability than the comps imply.
- What's the recent tenant-quality profile in this submarket — average credit score on applications, eviction rate, late-payment / NSF rate, and stable-employment percentage? A property-management company in the area should have these aggregated.
- How much new for-sale + rental construction is in the pipeline within 1–3 miles? Heavy new supply typically softens prices + rents 12–24 months out; constrained supply supports both.
Investment metrics
- 1% rule
- 2.26% ✓
- Cap rate
- 20.18%
- Cash-on-cash
- 49.59%
- DSCR
- 3.21
- GRM
- 3.7
CMA / ARV
- ARV (median comp)
- $68,000
- List price
- $68,000
- Delta
- —
- Verdict
- FAIR
- Comps
- 3 within 1.0 mi
Show comp detail 2 sales within ~0.75 mi
| Address | Dist | Beds/Ba | Sqft | Sold | Price | $/sf | Match |
|---|---|---|---|---|---|---|---|
| 7311 Chambers Creek Rd W #9 | 0.00mi | 2/1.0 | 672 (0%) | 0mo | $68,000 | $101 | 100 |
| 7311 Chambers Creek Rd W #28 | 0.00mi | 2/1.0 | 764 (+14%) | 9mo | $80,000 | $105 | 70 |
Match score weights: distance 35% · size 25% · config 20% · recency 20%. Top-matched comps best support the ARV.
Projected returns pro-forma
-3.0% appreciation · 3.0% rent growth · sell at horizon
- IRR
- 47.2%
- Equity multiple
- 3.05×
- Total profit
- $39,094
- Equity at exit
- $10,139
- IRR
- 52.9%
- Equity multiple
- 6.18×
- Total profit
- $98,564
- Equity at exit
- $5,879
Cash invested: $19,040 (down + closing). Projections, not guarantees.
Landlord ↔ Tenant lean methodology
- Overall (STATE)
- 28 Tenant-Leaning
- State Washington
- 28 Tenant-Leaning · D+8
- County
- — inherits STATE
- City
- — inherits STATE
ZIP-level market 98467
- Active inventory
- 69
- Price-to-rent
- 3.7×
Monthly cashflow live
- Estimated rent
- $1,538 high interval (Pro) →
- Mortgage (P&I)
- −$357
- Tax from tax record
- −$43 /mo · $521/yr
- Insurance
- −$28
- HOA
- −$0
- Vacancy / Maint / Mgmt
- −$323
- Net cashflow
- $787
Break-even live
UW: 25.0% down · 7.5% · 30yr · 1.5% tax · 5.0% vac · 8.0% maint · 8.0% mgmt
Financing live
Cash to close
- Down payment
- $17,000
- Closing costs
- $2,040
- Reserves months
- —
- Total cash needed
- —
Loan-product check · same deal, 3 products live
Conventional
25% down · 7.5% · 30yr
- Down + closing
- —
- Monthly P&I
- —
- Monthly cashflow
- —
- DSCR
- —
- Eligible?
- —
Personal DTI + credit; lowest rate.
DSCR
20% down · 8.5% · 30yr
- Down + closing
- —
- Monthly P&I
- —
- Monthly cashflow
- —
- DSCR
- —
- Eligible?
- —
No personal income docs; deal must DSCR.
Hard money
10% down · 12.0% · 12mo
- Down + closing
- —
- Monthly P&I
- —
- Monthly cashflow
- —
- DSCR
- —
- Eligible?
- —
Short-term bridge; refi at stabilization.
Rent comps 32 comps
| Address | Beds | Baths | Sqft | Rent | $/sqft | DOM | Units | Dist |
|---|---|---|---|---|---|---|---|---|
| 7704 Cirque Dr W University Place, WA | 1.0 | 1.0 | 600 | $1,595 | $2.66 | 4d | 3 | 0.88mi |
| 7602 46th St W University Place, WA | 1.0–2.0 | 1.0 | 820 | $1,825 | $2.23 | 1d | 1 | 0.98mi |
| 4510 76th Ave W University Place, WA | 1.0–2.0 | 1.0 | 600 | $1,650 | $2.75 | 3d | 3 | 1.02mi |
| 4401 76th Ave W Unit 08 University Place, WA | 1.0 | 1.0 | 710 | $1,650 | $2.32 | 4d | 1 | 1.12mi |
| 4401 76th Ave W University Place, WA | 1.0–2.0 | 1.0–1.5 | 905 | $1,995 | $2.20 | 16d | 2 | 1.12mi |
| 7607 44th St W University Place, WA | 1.0 | 1.0 | 730 | $1,325 | $1.82 | 24d | 1 | 1.19mi |
| 7523 44th St W Unit 7607-01 University Place, WA | 1.0 | 1.0 | 730 | $1,325 | $1.82 | 24d | 1 | 1.20mi |
| 7523 44th St W Unit 7533-04 University Place, WA | 1.0 | 1.0 | 730 | $1,325 | $1.82 | 20d | 1 | 1.20mi |
| 7523 44th St W University Place, WA | 1.0 | 1.0 | 730 | $1,325 | $1.82 | 4d | 1 | 1.21mi |
| 6100 Lakewood Dr W University Place, WA | 1.0–2.0 | 1.0 | 770 | $1,815 | $2.36 | 3d | 4 | 1.21mi |
| 7513 Grange St W Lakewood, WA | 1.0 | 1.0 | 442 | $1,635 | $3.70 | 24d | 1 | 1.22mi |
| 7519 Grange St W Lakewood, WA | 1.0 | 1.0 | 429 | $1,635 | $3.81 | 43d | 1 | 1.23mi |
| 7537 Grange St W Unit 7537 Lakewood, WA | 1.0 | 1.0 | 467 | $1,635 | $3.50 | 24d | 1 | 1.23mi |
| 7533 44th St W University Place, WA | 1.0 | 1.0 | 730 | $1,325 | $1.82 | 24d | 1 | 1.24mi |
| 5808 Hannah Pierce Road W University Place, WA | 1.0 | 1.0 | 663 | $1,650 | $2.49 | 1d | 6 | 1.25mi |
| 5918 Hannah Pierce Rd W University Place, WA | 1.0–2.0 | 1.0 | 711 | $1,485 | $2.09 | 3d | 1 | 1.26mi |
| 6021 S Orchard St Tacoma, WA | 1.0–3.0 | 1.0–2.0 | 999 | $2,743 | $2.74 | 2d | 95 | 1.31mi |
| 6807 Lakewood Dr W Unit 9 University Place, WA | 1.0 | 1.0 | 560 | $1,395 | $2.49 | 24d | 1 | 1.32mi |
| 6413 53rd Ave W University Place, WA | 1.0 | 1.0 | 604 | $1,450 | $2.40 | 23d | 1 | 1.34mi |
| 5801 Orchard St W University Place, WA | 1.0–2.0 | 1.0 | 775 | $1,685 | $2.17 | 1d | 7 | 1.34mi |
| 5205 66th St W Unit 1 University Place, WA | 1.0 | 1.0 | 520 | $1,145 | $2.20 | 14d | 1 | 1.36mi |
| 5205 66th St W Unit 4 University Place, WA | 1.0 | 1.0 | 520 | $1,065 | $2.05 | 1d | 1 | 1.36mi |
| 5910 78th St W Lakewood, WA | 1.0–2.0 | 1.0 | 825 | $1,725 | $2.09 | 43d | 1 | 1.37mi |
| 5207 66th St W Unit 1 University Place, WA | 1.0 | 1.0 | 520 | $1,065 | $2.05 | 1d | 1 | 1.37mi |
| 42 Thunderbird Pkwy SW Lakewood, WA | 1.0 | 1.0 | 680 | $1,695 | $2.49 | 2d | 1 | 1.38mi |
| 25 Thunderbird Pkwy SW Apt 14 Lakewood, WA | 1.0 | 1.0 | 600 | $800 | $1.33 | 5d | 1 | 1.41mi |
| 8101 83rd Ave SW Lakewood, WA | 1.0–2.0 | 1.0 | 632 | $1,785 | $2.82 | 1d | 27 | 1.41mi |
| 7619 Douglas St W #3 Tacoma, WA | 1.0 | 1.0 | 500 | $1,395 | $2.79 | 43d | 1 | 1.42mi |
| 7619 Cody St W Lakewood, WA | 1.0 | 1.0 | 620 | $1,238 | $2.00 | 2d | 3 | 1.45mi |
| 7619 Cody St W Lakewood, WA | 1.0 | 1.0 | 620 | $1,395 | $2.25 | 43d | 1 | 1.45mi |
| 8416 Phillips Rd SW Lakewood, WA | 1.0–2.0 | 1.0–1.5 | 800 | $1,890 | $2.36 | 43d | 1 | 1.46mi |
| 5701 S Orchard St Tacoma, WA | 1.0–3.0 | 1.0–2.0 | 842 | $1,624 | $1.93 | 7d | 10 | 1.46mi |
Listing history 12 events
-
2026-06-02status $68,000 Pending 38 DOM
-
2026-06-01days on market $68,000 Active Under Contract 38 DOM
-
2026-05-31days on market $68,000 Active Under Contract 37 DOM
-
2026-05-07status Active
-
2026-04-27status Pending
-
2026-04-14$68,000 Active
-
2024-07-19soldstatus $50,000 Closed
-
2024-06-30status Pending
-
2024-06-12price $59,990
-
2024-05-30$65,000 Active
-
2000-10-27soldstatus $14,000
-
2000-07-17$14,500
ⓘ Source: listings_history table (triggers on properties + properties_extension) + one-shot
backfill from property_details.listing_events for pre-trigger history.
Tax reassessment forecast WA · Resets to sale price
- Current annual tax
- $521 · $43/mo
- Projected year-2 tax
- $666 · $56/mo
- Expected delta
- +$145/yr (+$12/mo · 27.9%)
ⓘ Screening estimate from a state-policy table — verify with the county assessor before closing.
Climate risk First Street
- Flood 1/10 Low FEMA zone X (unshaded) · 0% chance over 30 yrs
- Wildfire 1/10 Low
- Heat 3/10 Moderate 7 d/yr ≥86°F today · 14 d/yr by 30 yrs out
- Wind 1/10 Low
- Air quality 7/10 Severe 11 unhealthy d/yr today · 12 by 30 yrs out
Nearby sold comps map
Loading sold comps map…
Walkable amenities ~0.75 mi
Loading nearby amenities…
Taxation est. · year 1
- Rental income
- $18,459
- − Mortgage interest
- −$3,809
- − Property taxes
- −$521
- − Insurance
- −$340
- − Repairs & maintenance
- −$1,477
- − Management
- −$1,477
- − Depreciation
- −$1,978
- Taxable income
- $8,857
- Est. tax owed @ 24.0%
- −$2,126
- After-tax cash flow
- $7,317/yr
For passive investors: Depreciation is non-cash, so a rental often shows a tax loss while cash-flowing — sheltering income. Rental losses are passive: they offset passive income freely, and up to $25,000/yr can offset ordinary (W-2) income if you actively participate and your MAGI is under $100k (phasing out to $0 by $150k); unused losses carry forward. On sale, claimed depreciation is recaptured at up to 25%, and gains may owe capital-gains tax (a 1031 exchange can defer both). Figures are a year-1 estimate at your 24.0% rate — not tax advice; consult a CPA.
Schools (NCES district)
- District
- University Place School District
- NCES district ID
- 5309180
- Math proficiency
- 70% ▼ -1.00%
- Reading proficiency
- 77% ▬ 0.00%
- Median HH income
- $58,906
- Composite
- 64.16/100
- National rank
- #1180
- State rank
- #14 of 291 in WA
Livability — University Place
- Score
- 87/100
- State rank
- #17
- US rank
- #320
Category grades
Schools grade is shown separately in the Schools card above.
Census & demographics
- Census place
- University Place, WA
- City population
- 30,327
- Population (ZIP)
- 15,241
Population outlook (Pierce County) Hauer SSP2
- Today (2025)
- 956,648 people
- By 2030
- 1,010,862 · +5.7%
- By 2040
- 1,113,170 · +16.4%
- By 2050
- 1,206,524 · +26.1%
- By 2075
- 1,436,425 · +50.2%
- By 2100
- 1,563,654 · +63.5%
Race, ethnicity, and origin ACS 2023
- Neighborhood character
- Diverse neighborhood (Simpson 0.61)
- Race & ethnicity
- White 59% Asian 15% Two or more races 12% Hispanic / Latino 10% Black 9% Native American 1%
- Hispanic origin (detail)
- Mexican 7%
- Common ancestry
- Portuguese 3% Italian 2% Slovak 2%
- Foreign-born
- 17% · South Korea, Canada, Vietnam
- Languages at home
- 79% English-only · Spanish 5% Korean 5% Vietnamese 2%
Political lean MEDSL · Pierce
- 2024 margin
- D (+10.8) · D 53.9% · R 43.1% · Other 3.0%
- 2008→2024 swing
- -1.4pp toward R · 2008: 12.2pp · 2024: 10.8pp
- All cycles
- 2024: D+10.8 2020: D+11.2 2016: D+7.5 2012: D+11.0 2008: D+12.2
Not yet ingested
- Civics
- —
Market trends
- HPI YoY
- ▼ -358.24%
- Current HPI
- 290.6952
- Rent YoY
- —
- Metro
- —
- State GDP YoY
- ▲ 4.65%
- F500 in state
- 22
Industry mix (Fortune 500 HQ in WA)
| Industry | F500 HQs | Revenue |
|---|---|---|
| Retail | 2 | $269B |
|
||
| Technology / Retail | 1 | $638B |
|
||
| Technology | 1 | $245B |
|
||
| Telecommunications | 1 | $38B |
|
||
| Food / Beverage | 1 | $36B |
|
||
| Automotive / Trucks | 1 | $34B |
|
||
Price history
+369.0% since first listed9 events — show timeline
- 2026-05-07 Relisted — NWMLS as Distributed by MLS Grid
- 2026-04-27 Pending — NWMLS as Distributed by MLS Grid
- 2026-04-14 Listed $68,000 NWMLS as Distributed by MLS Grid
- 2024-07-19 Sold (MLS) $50,000 NWMLS as Distributed by MLS Grid
- 2024-06-30 Pending — NWMLS as Distributed by MLS Grid
- 2024-06-12 Price Changed $59,990 NWMLS as Distributed by MLS Grid
- 2024-05-30 Listed $65,000 NWMLS as Distributed by MLS Grid
- 2000-10-27 Sold (MLS) $14,000 NWMLS as Distributed by MLS Grid
- 2000-07-17 Listed $14,500 NWMLS as Distributed by MLS Grid
Property tax history
+9.5%/yrLatest (2026): $521 · +59.2% YoY. Source: county tax records.
Cash-flow waterfall
monthlySold comps — $/sqft
last 12 mo · ≤1 miLoading sold comps…