1366 Cattleman Acres Dr Unit MT 40 Magnolia BEL · Inman, SC
Flood risk No data
- FEMA flood zone
- —
- Chance of flooding over 30 yrs
- —
- Est. flood insurance / yr
- —
Fire risk No data
- Est. fire insurance / yr
- —
Heat risk No data
- Hot days now (above threshold)
- —
- Hot days in 30 yrs
- —
Wind risk No data
- Chance of severe wind over 30 yrs
- —
Air-quality risk No data
- Unhealthy air days now
- —
- Unhealthy air days in 30 yrs
- —
Risk factors via First Street. Map © Google.
Why this score? — see what drove the D- grade
The composite is a weighted blend of 9 inputs, each scored 0–100. Each bar is that input's sub-score; the figure is the points it added to the 100-point composite (weight × sub-score).
- Cash flow +10.5/30.0
- ARV discount +6.0/15.0
- Schools +4.5/10.0
- 1% rule +3.9/10.0
- Livability +3.7/5.0
- DSCR +3.0/10.0
- Rent growth +2.9/5.0
- Condition / age +2.5/5.0
- Appreciation +0.0/10.0
$195,799
🖨 Deal sheet 📄 Offer letter ✓ Due diligence
Listing remarks
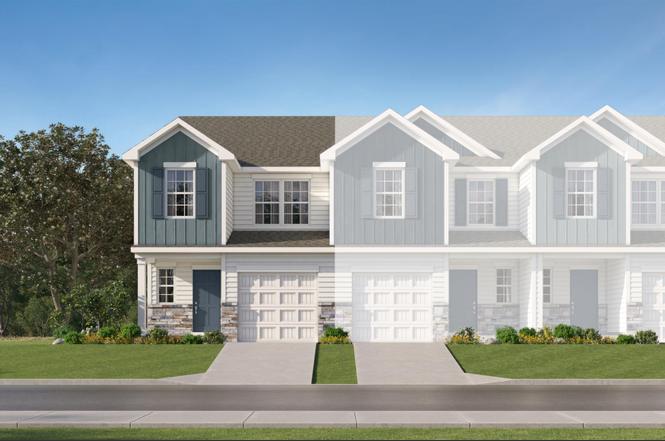
The Magnolia floorplan at The Maple in Inman, SC. We are thrilled to introduce you to the Magnolia floorplan, which boasts a generous 1405 square feet of living space. You will have a 2 car parking pad, and 1 car garage. As you step inside, you'll be greeted by an open-concept first floor featuring a spacious great room with vinyl flooring that seamlessly flows into your main kitchen and breakfast area. The kitchen is a chef's delight, complete with quartz countertops, a stylish tile backsplash, and modern stainless-steel appliances. Imagine spending tranquil afternoons on your back porch, which comes with vinyl privacy fences for that added sense of seclusion and peace. Heading upstairs, y
Key facts
- Quartz countertops
- Vinyl flooring
- Back porch
Tags
Property features AI
Finance
- HOA & community: Homeowners association present; HOA does not include additional services; Community amenities include common areas, lighting, and a pool
Exterior
- Parking: Attached garage with door opener; Garage capacity: 2; Paved driveway
- Utilities: Public water; Public sewer available; Natural gas service; Private garbage pickup
- Home design: Two-story home; Built by Lennar; Estimated completion 2026; Under construction; Slab foundation
- Construction: Approximate year built: 2025; Slab foundation; Vinyl siding; Composition shingle roof
- Exterior features: Tilt-out windows; Vinyl/aluminum trim; Vinyl siding; Composition shingle roof
Interior
- Kitchen: Dishwasher; Garbage disposal; Gas range (stand-alone); Built-in microwave; 10 x 10 kitchen
- Bedrooms: Primary bedroom on 2nd level with double sink, full bath, shower (no tub), and walk-in closet; Bedroom sizes: Primary 14 x 11; Bedroom 2 10 x 10; Bedroom 3 10 x 13; Bedroom 4 11 x 10
- Flooring: Carpet; Laminate flooring
- Bathrooms: Two full bathrooms; One half bathroom
- Heating & cooling: Forced air heating (natural gas); Central forced cooling; Gas water heater
- Interior features: Smooth ceilings; Open floor plan; Smoke detector; Quartz countertops; Other countertop material; Walk-in pantry
- Laundry & utility: Laundry on 2nd floor; Walk-in laundry; Dryer electric hookup
Neighborhood map
What this means for you Summary
Snapshot
- This is a 3-bed/2.5-bath townhouse listed at $196k.
Deal economics
- At list price, monthly cash flow is $-101 ($-1k/yr) — negative.
- To cash-flow at today's rent, offer at most $181k (7.5% below list).
- To meet the 1% rule (rent ≥ 1% of price), the offer needs to be $175k (10.8% below list).
- Recommended offer: $175k (10.8% below list) — sets the bar for 1% rule.
- Cap rate 5.7% vs local median 4.3% in Inman — top-decile yield for the area; either an underpriced asset or a hidden risk that comps aren't pricing in. Stress-test before assuming the spread holds.
Location & tenants
- Location reads 74/100 on livability (#29 in SC, #4,452 nationally) — a middle-class / working-renter tenant base. Strengths: cost of living A+, housing A+, health & safety A+; Watch: amenities D, commute F.
- Spartanburg 02 (suburban): math 49% / reading 56% proficiency, ranked #6 of 80 in SC (top 8%) — acceptable for families but not a draw, mixed tenant base, ~2y average lease.
- Zoned schools: James H. Hendrix Elementary (math 55% / reading 45%, grade D+, #163 of 597 statewide, top 28%, 694 students, 89% FRL) — zoned schools average 89% FRL vs 44% district-wide (44 pts higher); higher-poverty schools than district average — tighter screening recommended.
- Market conditions: Rents rising (+1.8%/yr); 693 active listings in the ZIP; 1 comparable units currently listed for rent nearby; solid renter incomes; 3,129 units permitted in Spartanburg County in 2024 (40 in 5+ unit buildings).
Forward outlook
- Local home prices are declining (-3.0%/yr); year-one equity from $1k of loan paydown is wiped out by about $6k of value loss. Plan a longer hold.
- Spartanburg County population projected at +18% by 2050 — long-run rental-demand tailwind backs the buy-and-hold thesis.
Negotiation context
- It's been on market 96 days — a 9% lower offer ($178k) is reasonable based on typical stale-listing flexibility.
Questions for the listing agent
- What do current leases actually rent for vs. the listed asking? Can we see a recent rent roll and the last 12 months of T-12 income?
- It's been on market 96 days. Have you received any prior offers? Is the seller open to a 11% concession, seller financing, or rate buy-down credit?
- What does the HOA fee cover, when was the last increase, and are there any pending special assessments or reserve-fund shortfalls?
- Why hasn't it sold? Are there any deal-killer items the seller is aware of (foundation, flood, title, zoning, code violations)?
- Is there a deadline driving the sale (1031 exchange, divorce, estate, relocation)? That informs how much negotiation room exists.
- The area grade is low — what's the realistic commute time and amenity access for the typical tenant pool here? Any planned neighborhood developments (good or bad) we should know about?
- What's the average days-on-market for RENTAL listings here right now (not sales)? A rising rental-DOM trend means longer vacancies and softer asking-rent achievability than the comps imply.
- What's the recent tenant-quality profile in this submarket — average credit score on applications, eviction rate, late-payment / NSF rate, and stable-employment percentage? A property-management company in the area should have these aggregated.
- How much new for-sale + rental construction is in the pipeline within 1–3 miles? Heavy new supply typically softens prices + rents 12–24 months out; constrained supply supports both.
Investment metrics
- 1% rule
- 0.89% ✗
- Cap rate
- 5.67%
- Cash-on-cash
- -2.21%
- DSCR
- 0.90
- GRM
- 9.3
CMA / ARV
- ARV (on-the-fly)
- $189,405
- Comps found
- 12
Show comp detail 12 sales within ~0.75 mi
| Address | Dist | Beds/Ba | Sqft | Sold | Price | $/sf | Match |
|---|---|---|---|---|---|---|---|
| 1366 Cattleman Acres Dr Unit MT 40 Magnolia BEL | 0.00mi | 3/2.5 | 1,403 (0%) | 0mo | $190,000 | $135 | 100 |
| 1362 Cattleman Acres Dr Unit MT 39 Magnolia A | 0.00mi | 3/2.5 | 1,403 (0%) | 1mo | $199,999 | $143 | 99 |
| 1370 Cattleman Acres Dr Unit MT 41 Magnolia AER | 0.01mi | 3/2.5 | 1,403 (0%) | 1mo | $186,799 | $133 | 99 |
| 1358 Cattleman Acres Dr Unit MT 38 Chestnut B | 0.01mi | 3/2.5 | 1,423 (+1%) | 1mo | $195,000 | $137 | 96 |
| 1414 Cattleman Acres Dr Unit MT 51 Magnolia A | 0.06mi | 3/2.5 | 1,403 (0%) | 1mo | $177,000 | $126 | 96 |
| 1354 Cattleman Acres Dr Unit MT 37 Chestnut A | 0.01mi | 3/2.5 | 1,423 (+1%) | 1mo | $193,999 | $136 | 96 |
| 1338 Cattleman Acres Dr Unit MT 33 Chestnut AER | 0.03mi | 3/2.5 | 1,423 (+1%) | 1mo | $197,000 | $138 | 96 |
| 1382 Cattleman Acres Dr Unit MT 44 Chestnut BEL | 0.02mi | 3/2.5 | 1,423 (+1%) | 2mo | $190,000 | $134 | 96 |
| 1398 Cattleman Acres Dr Unit MT 47 Magnolia A | 0.04mi | 3/2.5 | 1,403 (0%) | 3mo | $181,099 | $129 | 95 |
| 1366 Whispering Willow Ct Unit MT 40 Magnolia BEL | 0.15mi | 3/2.5 | 1,403 (0%) | 0mo | $190,000 | $135 | 93 |
| 1406 Cattleman Acres Dr Unit MT 49 Chestnut A | 0.04mi | 3/2.5 | 1,423 (+1%) | 4mo | $181,999 | $128 | 92 |
| 3108 Whispering Willow Ct Unit MT 59 Chestnut B | 0.15mi | 3/2.5 | 1,423 (+1%) | 4mo | $179,999 | $126 | 88 |
Match score weights: distance 35% · size 25% · config 20% · recency 20%. Top-matched comps best support the ARV.
Projected returns pro-forma
-3.0% appreciation · 1.79% rent growth · sell at horizon
- IRR
- -21.4%
- Equity multiple
- 0.27×
- Total profit
- $-40,155
- Equity at exit
- $29,194
- IRR
- -18.3%
- Equity multiple
- 0.07×
- Total profit
- $-51,234
- Equity at exit
- $16,929
Cash invested: $54,824 (down + closing). Projections, not guarantees.
Landlord ↔ Tenant lean methodology
- Overall (STATE)
- 90 Strongly Landlord-Friendly
- State South Carolina
- 90 Strongly Landlord-Friendly · R+6
- County
- — inherits STATE
- City
- — inherits STATE
ZIP-level market 29349
- Home prices YoY
- -31.8%
- Rents YoY
- 1.8%
- Active inventory
- 693
- Price-to-rent
- 9.3×
Monthly cashflow live
- Estimated rent
- $1,746 medium interval (Pro) →
- Mortgage (P&I)
- −$1,027
- Tax est. 1.5%
- −$245 /mo · $2,937/yr
- Insurance
- −$82
- HOA
- −$127
- Vacancy / Maint / Mgmt
- −$367
- Net cashflow
- $-101
Break-even live
UW: 25.0% down · 7.5% · 30yr · 1.5% tax · 5.0% vac · 8.0% maint · 8.0% mgmt
Financing live
Cash to close
- Down payment
- $48,950
- Closing costs
- $5,874
- Reserves months
- —
- Total cash needed
- —
Loan-product check · same deal, 3 products live
Conventional
25% down · 7.5% · 30yr
- Down + closing
- —
- Monthly P&I
- —
- Monthly cashflow
- —
- DSCR
- —
- Eligible?
- —
Personal DTI + credit; lowest rate.
DSCR
20% down · 8.5% · 30yr
- Down + closing
- —
- Monthly P&I
- —
- Monthly cashflow
- —
- DSCR
- —
- Eligible?
- —
No personal income docs; deal must DSCR.
Hard money
10% down · 12.0% · 12mo
- Down + closing
- —
- Monthly P&I
- —
- Monthly cashflow
- —
- DSCR
- —
- Eligible?
- —
Short-term bridge; refi at stabilization.
Rent comps 1 comps
| Address | Beds | Baths | Sqft | Rent | $/sqft | DOM | Units | Dist |
|---|---|---|---|---|---|---|---|---|
| 1202 Chelsey Ln Unit 1430 Inman, SC | 3.0 | 2.5 | 1366 | $1,650 | $1.21 | 21d | 1 | 1.09mi |
HOA detail
- Monthly dues
- $127 · $1,524/yr
Listing history 8 events
-
2026-05-18status Pending
-
2026-05-05price $195,799
-
2026-04-21price $207,799
-
2026-03-27price $204,999
-
2026-03-19price $208,999
-
2026-02-19price $209,999
-
2026-02-17price $199,999
-
2026-02-11$216,999 Active
ⓘ Source: listings_history table (triggers on properties + properties_extension) + one-shot
backfill from property_details.listing_events for pre-trigger history.
Nearby sold comps map
Loading sold comps map…
Walkable amenities ~0.75 mi
Loading nearby amenities…
Taxation est. · year 1
- Rental income
- $20,949
- − Mortgage interest
- −$10,968
- − Property taxes
- −$2,937
- − Insurance
- −$979
- − Repairs & maintenance
- −$1,676
- − Management
- −$1,676
- − HOA
- −$1,524
- − Depreciation
- −$5,696
- Taxable loss
- −$4,507
- Est. tax savings @ 24.0%
- +$1,082
- After-tax cash flow
- $-130/yr
For passive investors: Depreciation is non-cash, so a rental often shows a tax loss while cash-flowing — sheltering income. Rental losses are passive: they offset passive income freely, and up to $25,000/yr can offset ordinary (W-2) income if you actively participate and your MAGI is under $100k (phasing out to $0 by $150k); unused losses carry forward. On sale, claimed depreciation is recaptured at up to 25%, and gains may owe capital-gains tax (a 1031 exchange can defer both). Figures are a year-1 estimate at your 24.0% rate — not tax advice; consult a CPA.
Schools (NCES district)
- District
- Spartanburg 02
- NCES district ID
- 4503510
- Math proficiency
- 49% ▼ -7.00%
- Reading proficiency
- 56% ▲ 2.00%
- Median HH income
- $49,591
- Composite
- 44.79/100
- National rank
- #2742
- State rank
- #6 of 80 in SC
Livability — Inman
- Score
- 74/100
- State rank
- #29
- US rank
- #4452
Category grades
Schools grade is shown separately in the Schools card above.
Census & demographics
- County
- Spartanburg County · 258,607 people
- City population
- 39,083
- Metro
- Spartanburg, SC
- Population (ZIP)
- 39,083
- Household income
- $76,168
- Rent vs Own
- Severe rent burden
- 271.0
Population outlook (Spartanburg County) Hauer SSP2
- Today (2025)
- 325,495 people
- By 2030
- 338,800 · +4.1%
- By 2040
- 363,471 · +11.7%
- By 2050
- 384,156 · +18.0%
- By 2075
- 430,137 · +32.1%
- By 2100
- 442,733 · +36.0%
Race, ethnicity, and origin ACS 2023
- Neighborhood character
- Predominantly White (80%)
- Race & ethnicity
- White 80% Black 9% Hispanic / Latino 6% Two or more races 4% Asian 2%
- Hispanic origin (detail)
- Mexican 5%
- Common ancestry
- Subsaharan African 6% Serbian 3% Scotch-Irish 3%
- Foreign-born
- 9% · Canada
- Languages at home
- 86% English-only · Russian/Polish/Slavic 7% Spanish 3% Other Asian/Pacific 2%
Political lean MEDSL · Spartanburg
- 2024 margin
- Solid R (+33.6) · D 32.6% · R 66.2% · Other 1.2%
- 2008→2024 swing
- -12.0pp toward R · 2008: -21.6pp · 2024: -33.6pp
- All cycles
- 2024: R+33.6 2020: R+27.3 2016: R+30.0 2012: R+23.1 2008: R+21.6
Not yet ingested
- Civics
- —
Market trends
- HPI YoY
- ▼ -113.67%
- Current HPI
- 244.0359
- Rent YoY
- ▲ 1.79%
- Metro
- Spartanburg, SC
- State GDP YoY
- ▲ 4.51%
- F500 in state
- 2
Industry mix (Fortune 500 HQ in SC)
| Industry | F500 HQs | Revenue |
|---|---|---|
| Packaging | 1 | $7B |
|
||
Price history
-9.8% since first listed8 events — show timeline
- 2026-05-18 Pending — Greater Greenville MLS
- 2026-05-05 Price Changed $195,799 Greater Greenville MLS
- 2026-04-21 Price Changed $207,799 Greater Greenville MLS
- 2026-03-27 Price Changed $204,999 Greater Greenville MLS
- 2026-03-19 Price Changed $208,999 Greater Greenville MLS
- 2026-02-19 Price Changed $209,999 Greater Greenville MLS
- 2026-02-17 Price Changed $199,999 Greater Greenville MLS
- 2026-02-11 Listed $216,999 Greater Greenville MLS
Cash-flow waterfall
monthlySold comps — $/sqft
last 12 mo · ≤1 miLoading sold comps…