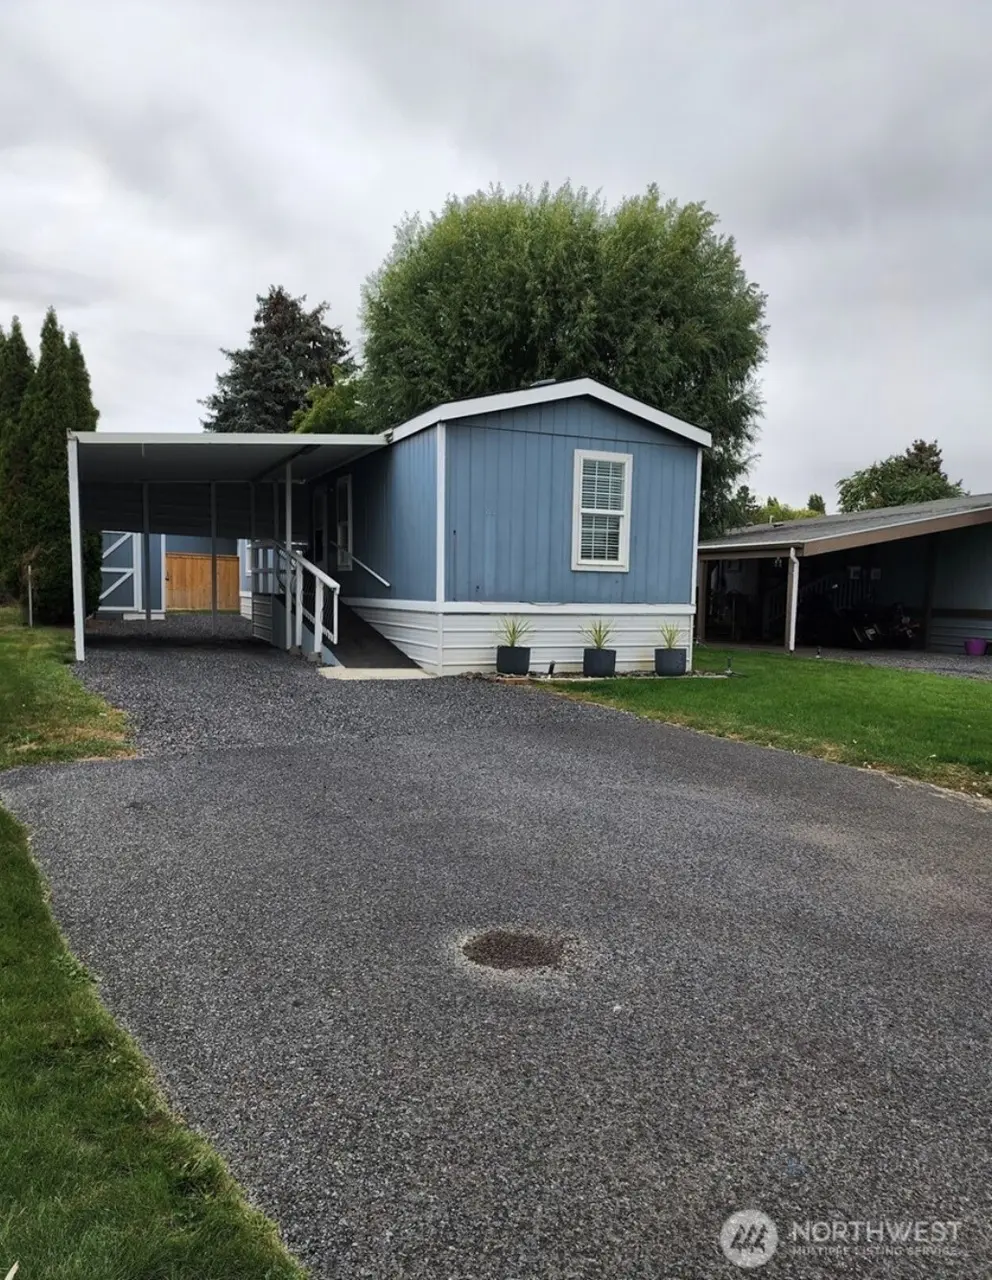
3010 W Peninsula Dr #86 · Moses Lake, WA
Flood risk 1/10 · Minimal
- FEMA flood zone
- X (unshaded)
- Chance of flooding over 30 yrs
- 0.0%
- Est. flood insurance / yr
- $507 – $1,088
Fire risk 1/10 · Minimal
- Est. fire insurance / yr
- $604 – $1,122
Heat risk 4/10 · Minor
- Hot days now (above 96°F)
- 7 days/yr
- Hot days in 30 yrs
- 16 days/yr
Wind risk 1/10 · Minimal
- Chance of severe wind over 30 yrs
- —
Air-quality risk 7/10 · Major
- Unhealthy air days now
- 12 days/yr
- Unhealthy air days in 30 yrs
- 14 days/yr
Risk factors via First Street. Map © Google.
Why this score? — see what drove the B- grade
The composite is a weighted blend of 9 inputs, each scored 0–100. Each bar is that input's sub-score; the figure is the points it added to the 100-point composite (weight × sub-score).
- Cash flow +30.0/30.0
- 1% rule +10.0/10.0
- DSCR +10.0/10.0
- ARV discount +4.8/15.0
- Schools +3.9/10.0
- Livability +3.8/5.0
- Condition / age +2.5/5.0
- Rent growth +2.1/5.0
- Appreciation +0.0/10.0
$58,900
🖨 Deal sheet 📄 Offer letter ✓ Due diligence
Listing remarks
Welcome to this beautifully updated and move in ready home in the desirable Peninsula Estates community. This 2 bedroom, 1 bath gem features a cozy living area that flows into the dining space and a functional kitchen. The home features update flooring, fresh paint, a refreshed bathroom, and a new roof (approximately 3 years old), providing peace of mind for years to come. Outside, two storage sheds provide ample space for tools and enjoy a low maintenance yard with room to personalize. Conveniently located just minutes from Moses Lake's schools, shopping and parks; this home offers easy access to all the essentials. Whether you're a first time homebuyer or looking to downsize, this is the
Key facts
- Functional kitchen
- Refreshed bathroom
- Updated home
Tags
Neighborhood map
What this means for you Summary
Snapshot
- This is a 2-bed/2.0-bath manufactured listed at $59k.
Deal economics
- At list price, monthly cash flow is $751 ($9k/yr) — positive.
- The deal already cash-flows at list — no discount required.
- Meets the 1% rule at list price ($1k rent vs $59k).
- Recommended offer: $55k (6.0% below list) — sets the bar for market timing.
- Cap rate 21.6% vs local median 3.3% in Moses Lake — top-decile yield for the area; either an underpriced asset or a hidden risk that comps aren't pricing in. Stress-test before assuming the spread holds.
Location & tenants
- Location reads 75/100 on livability (#170 in WA, #4,228 nationally) — a middle-class / working-renter tenant base. Strengths: housing A+, health & safety A+, amenities A-; Watch: employment C-, schools D+, crime F.
- Moses Lake School District (town): math 38% / reading 48% proficiency, ranked #198 of 291 in WA (top 68%) — families likely to look elsewhere, expect single-tenant / working-renter base with shorter leases.
- Market conditions: Rents soft (-1.7%/yr); 585 active listings in the ZIP; 7 comparable units currently listed for rent nearby; rentals lingering (median 44d on market — plan ~5-8 weeks vacancy on turnover, expect pricing pressure); 100% of comp listings sitting > 30 days — soft ceiling on asking rent; 559 units permitted in Grant County in 2024 (35 in 5+ unit buildings).
Forward outlook
- Local home prices are declining (-3.0%/yr); year-one equity from $407 of loan paydown is wiped out by about $2k of value loss. Plan a longer hold.
- Grant County population projected at +16% by 2050 — long-run rental-demand tailwind backs the buy-and-hold thesis.
- At projected returns (-3.0% appreciation + 0.0% rent growth), your $16k cash investment doubles in ~3 years — after that, you're playing with house money.
Negotiation context
- It's been on market 71 days — a 6% lower offer ($55k) is reasonable based on typical stale-listing flexibility.
- 5 sale attempts since 17y ago with the ask held roughly flat each time — persistent listings suggest the price (not the market) is what's stuck; bring a comps-based counter.
- Current owner paid $22k; list at $59k implies a 162% gain — meaningful room to come down on a strong offer.
Questions for the listing agent
- It's been on market 71 days. Have you received any prior offers? Is the seller open to a 6% concession, seller financing, or rate buy-down credit?
- Why hasn't it sold? Are there any deal-killer items the seller is aware of (foundation, flood, title, zoning, code violations)?
- Is there a deadline driving the sale (1031 exchange, divorce, estate, relocation)? That informs how much negotiation room exists.
- Schools are D-rated, which usually means shorter tenancies and higher turnover. Who's the typical renter profile here, and what's been the actual vacancy rate?
- Crime grade is F in this area — have there been break-ins, vandalism, or insurance claims at this property in the last 3 years? What carrier currently insures it and at what premium?
- What's the average days-on-market for RENTAL listings here right now (not sales)? A rising rental-DOM trend means longer vacancies and softer asking-rent achievability than the comps imply.
- What's the recent tenant-quality profile in this submarket — average credit score on applications, eviction rate, late-payment / NSF rate, and stable-employment percentage? A property-management company in the area should have these aggregated.
- How much new for-sale + rental construction is in the pipeline within 1–3 miles? Heavy new supply typically softens prices + rents 12–24 months out; constrained supply supports both.
Investment metrics
- 1% rule
- 2.36% ✓
- Cap rate
- 21.60%
- Cash-on-cash
- 54.68%
- DSCR
- 3.43
- GRM
- 3.5
CMA / ARV
- ARV (median comp)
- $55,599
- List price
- $58,900
- Delta
- 5.94%
- Verdict
- FAIR
- Comps
- 11 within 1.0 mi
Projected returns pro-forma
-3.0% appreciation · 0.0% rent growth · sell at horizon
- IRR
- 49.6%
- Equity multiple
- 3.08×
- Total profit
- $34,223
- Equity at exit
- $8,782
- IRR
- 53.9%
- Equity multiple
- 5.58×
- Total profit
- $75,608
- Equity at exit
- $5,093
Cash invested: $16,492 (down + closing). Projections, not guarantees.
Landlord ↔ Tenant lean methodology
- Overall (STATE)
- 28 Tenant-Leaning
- State Washington
- 28 Tenant-Leaning · D+8
- County
- — inherits STATE
- City
- — inherits STATE
ZIP-level market 98837
- Rents YoY
- -1.7%
- Active inventory
- 585
- Price-to-rent
- 3.5×
Monthly cashflow live
- Estimated rent
- $1,391 high interval (Pro) →
- Mortgage (P&I)
- −$309
- Tax from tax record
- −$14 /mo · $169/yr
- Insurance
- −$25
- HOA
- −$0
- Vacancy / Maint / Mgmt
- −$292
- Net cashflow
- $751
Break-even live
UW: 25.0% down · 7.5% · 30yr · 1.5% tax · 5.0% vac · 8.0% maint · 8.0% mgmt
Financing live
Cash to close
- Down payment
- $14,725
- Closing costs
- $1,767
- Reserves months
- —
- Total cash needed
- —
Loan-product check · same deal, 3 products live
Conventional
25% down · 7.5% · 30yr
- Down + closing
- —
- Monthly P&I
- —
- Monthly cashflow
- —
- DSCR
- —
- Eligible?
- —
Personal DTI + credit; lowest rate.
DSCR
20% down · 8.5% · 30yr
- Down + closing
- —
- Monthly P&I
- —
- Monthly cashflow
- —
- DSCR
- —
- Eligible?
- —
No personal income docs; deal must DSCR.
Hard money
10% down · 12.0% · 12mo
- Down + closing
- —
- Monthly P&I
- —
- Monthly cashflow
- —
- DSCR
- —
- Eligible?
- —
Short-term bridge; refi at stabilization.
Rent comps 7 comps
| Address | Beds | Baths | Sqft | Rent | $/sqft | DOM | Units | Dist |
|---|---|---|---|---|---|---|---|---|
| 511 S Interlake Rd Moses Lake, WA | 2.0–4.0 | 2.0 | 1095 | $926 | $0.85 | 44d | 8 | 0.27mi |
| 2722 W Peninsula Dr Moses Lake, WA | 2.0 | 1.0 | 858 | $1,350 | $1.57 | 44d | 1 | 0.29mi |
| 2900 W Marina Dr Moses Lake, WA | 2.0 | 2.0 | 1036 | $1,688 | $1.63 | 44d | 1 | 0.55mi |
| 2812 W Marina Dr Unit D Moses Lake, WA | 2.0 | 2.0 | 1078 | $1,695 | $1.57 | 44d | 1 | 0.56mi |
| 1830 W Crouse St #1 Moses Lake, WA | 2.0 | 1.0 | 946 | $1,295 | $1.37 | 44d | 1 | 1.04mi |
| 1701 W Crouse St Moses Lake, WA | 1.0–3.0 | 1.0–2.0 | 1017 | $1,525 | $1.50 | 44d | 6 | 1.16mi |
| Pheasant St Moses Lake, WA | 2.0 | 1.0 | 850 | $1,450 | $1.71 | 44d | 1 | 1.23mi |
Listing history 32 events
-
2026-06-19days on market $58,900 Active 71 DOM
-
2026-06-18days on market $58,900 Active 70 DOM
-
2026-06-17days on market $58,900 Active 69 DOM
-
2026-06-16days on market $58,900 Active 68 DOM
-
2026-06-15days on market $58,900 Active 67 DOM
-
2026-06-14days on market $58,900 Active 65 DOM
-
2026-06-13days on market $58,900 Active 64 DOM
-
2026-06-10days on market $58,900 Active 62 DOM
-
2026-06-09days on market $58,900 Active 61 DOM
-
2026-06-08days on market $58,900 Active 60 DOM
-
2026-06-07days on market $58,900 Active 59 DOM
-
2026-06-05days on market $58,900 Active 56 DOM
-
2026-06-03days on market $58,900 Active 55 DOM
-
2026-06-02days on market $58,900 Active 54 DOM
-
2026-06-01days on market $58,900 Active 53 DOM
-
2026-05-31days on market $58,900 Active 52 DOM
-
2026-05-30days on market $58,900 Active 51 DOM
-
2026-04-09$58,900 Active
-
2011-06-16historical
-
2011-06-15soldstatus $22,500 Sold
-
2011-06-02status Pending
-
2011-05-05price $23,000
-
2011-05-04status Active
-
2011-05-01historical Expired
-
2011-01-28price $25,000
-
2010-12-28status Active
-
2010-12-25historical Expired
-
2010-09-14$28,000 Active
-
2010-03-01soldstatus $23,000 Sold
-
2010-02-02status Pending Inspection
-
2009-10-20$27,950 Active
-
2001-05-17soldstatus $24,900
ⓘ Source: listings_history table (triggers on properties + properties_extension) + one-shot
backfill from property_details.listing_events for pre-trigger history.
Tax reassessment forecast WA · Resets to sale price
- Current annual tax
- $169 · $14/mo
- Projected year-2 tax
- $577 · $48/mo
- Expected delta
- +$408/yr (+$34/mo · 240.6%)
ⓘ Screening estimate from a state-policy table — verify with the county assessor before closing.
Climate risk First Street
- Flood 1/10 Low FEMA zone X (unshaded) · 0% chance over 30 yrs
- Wildfire 1/10 Low
- Heat 4/10 Moderate 7 d/yr ≥96°F today · 16 d/yr by 30 yrs out
- Wind 1/10 Low
- Air quality 7/10 Severe 12 unhealthy d/yr today · 14 by 30 yrs out
Nearby sold comps map
Loading sold comps map…
Walkable amenities ~0.75 mi
Loading nearby amenities…
Taxation est. · year 1
- Rental income
- $16,693
- − Mortgage interest
- −$3,299
- − Property taxes
- −$169
- − Insurance
- −$294
- − Repairs & maintenance
- −$1,335
- − Management
- −$1,335
- − Depreciation
- −$1,713
- Taxable income
- $8,546
- Est. tax owed @ 24.0%
- −$2,051
- After-tax cash flow
- $6,966/yr
For passive investors: Depreciation is non-cash, so a rental often shows a tax loss while cash-flowing — sheltering income. Rental losses are passive: they offset passive income freely, and up to $25,000/yr can offset ordinary (W-2) income if you actively participate and your MAGI is under $100k (phasing out to $0 by $150k); unused losses carry forward. On sale, claimed depreciation is recaptured at up to 25%, and gains may owe capital-gains tax (a 1031 exchange can defer both). Figures are a year-1 estimate at your 24.0% rate — not tax advice; consult a CPA.
Schools (NCES district)
- District
- Moses Lake School District
- NCES district ID
- 5305220
- Math proficiency
- 38% ▬ 0.00%
- Reading proficiency
- 48% ▼ -1.00%
- Median HH income
- $49,033
- Composite
- 39.17/100
- National rank
- #8232
- State rank
- #198 of 291 in WA
Livability — Moses Lake
- Score
- 75/100
- State rank
- #170
- US rank
- #4228
Category grades
Schools grade is shown separately in the Schools card above.
Census & demographics
- Census place
- Moses Lake, WA
- County
- Grant County · 61,643 people
- City population
- 49,455
- Metro
- Moses Lake, WA
- Population (ZIP)
- 49,455
- Household income
- $74,586
- Rent vs Own
- Severe rent burden
- 1064.0
Population outlook (Grant County) Hauer SSP2
- Today (2025)
- 99,356 people
- By 2030
- 102,107 · +2.8%
- By 2040
- 108,318 · +9.0%
- By 2050
- 114,712 · +15.5%
- By 2075
- 131,376 · +32.2%
- By 2100
- 146,163 · +47.1%
Race, ethnicity, and origin ACS 2023
- Neighborhood character
- Diverse neighborhood (Simpson 0.55)
- Race & ethnicity
- White 58% Hispanic / Latino 33% Two or more races 15% Black 2% Asian 1%
- Hispanic origin (detail)
- Mexican 30%
- Common ancestry
- Portuguese 3% Subsaharan African 2% Lithuanian 2%
- Foreign-born
- 10% · Canada
- Languages at home
- 76% English-only · Spanish 21% Russian/Polish/Slavic 2%
Political lean MEDSL · Grant
- 2024 margin
- Solid R (+37.5) · D 30.0% · R 67.4% · Other 2.6%
- 2008→2024 swing
- -9.9pp toward R · 2008: -27.5pp · 2024: -37.5pp
- All cycles
- 2024: R+37.5 2020: R+34.4 2016: R+37.9 2012: R+32.6 2008: R+27.5
Not yet ingested
- Civics
- —
Market trends
- HPI YoY
- ▼ -384.29%
- Current HPI
- 208.4574
- Rent YoY
- ▼ -1.72%
- Metro
- Moses Lake, WA
- State GDP YoY
- ▲ 4.65%
- F500 in state
- 22
Industry mix (Fortune 500 HQ in WA)
| Industry | F500 HQs | Revenue |
|---|---|---|
| Retail | 2 | $269B |
|
||
| Technology / Retail | 1 | $638B |
|
||
| Technology | 1 | $245B |
|
||
| Telecommunications | 1 | $38B |
|
||
| Food / Beverage | 1 | $36B |
|
||
| Automotive / Trucks | 1 | $34B |
|
||
Price history
+136.5% since first listed15 events — show timeline
- 2026-04-09 Listed $58,900 NWMLS as Distributed by MLS Grid
- 2011-06-16 Delisted — NWMLS as Distributed by MLS Grid
- 2011-06-15 Sold (MLS) $22,500 NWMLS as Distributed by MLS Grid
- 2011-06-02 Pending — NWMLS as Distributed by MLS Grid
- 2011-05-05 Price Changed $23,000 NWMLS as Distributed by MLS Grid
- 2011-05-04 Relisted — NWMLS as Distributed by MLS Grid
- 2011-05-01 Delisted — NWMLS as Distributed by MLS Grid
- 2011-01-28 Price Changed $25,000 NWMLS as Distributed by MLS Grid
- 2010-12-28 Relisted — NWMLS as Distributed by MLS Grid
- 2010-12-25 Delisted — NWMLS as Distributed by MLS Grid
- 2010-09-14 Listed $28,000 NWMLS as Distributed by MLS Grid
- 2010-03-01 Sold (MLS) $23,000 NWMLS as Distributed by MLS Grid
- 2010-02-02 Pending — NWMLS as Distributed by MLS Grid
- 2009-10-20 Listed $27,950 NWMLS as Distributed by MLS Grid
- 2001-05-17 Sold (Public Records) $24,900 Public Records
Property tax history
-2.8%/yrLatest (2022): $169 · -10.1% YoY. Source: county tax records.
Cash-flow waterfall
monthlySold comps — $/sqft
last 12 mo · ≤1 miLoading sold comps…