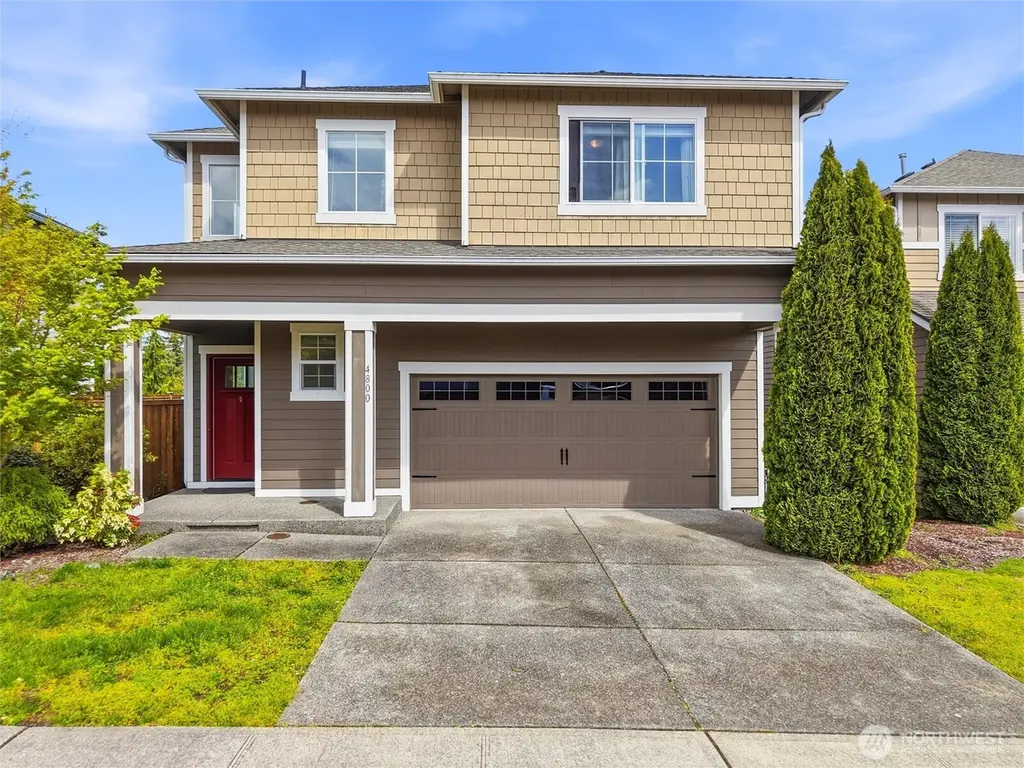
4800 4th Way SW · Olympia, WA
Flood risk 1/10 · Minimal
- FEMA flood zone
- X (unshaded)
- Chance of flooding over 30 yrs
- 0.0%
- Est. flood insurance / yr
- $507 – $1,088
Fire risk 3/10 · Minor
- Est. fire insurance / yr
- $604 – $1,122
Heat risk 3/10 · Minor
- Hot days now (above 88°F)
- 7 days/yr
- Hot days in 30 yrs
- 15 days/yr
Wind risk 1/10 · Minimal
- Chance of severe wind over 30 yrs
- —
Air-quality risk 6/10 · Moderate
- Unhealthy air days now
- 6 days/yr
- Unhealthy air days in 30 yrs
- 6 days/yr
Risk factors via First Street. Map © Google.
Why this score? — see what drove the D grade
The composite is a weighted blend of 9 inputs, each scored 0–100. Each bar is that input's sub-score; the figure is the points it added to the 100-point composite (weight × sub-score).
- ARV discount +12.7/15.0
- Appreciation +10.0/10.0
- Schools +6.2/10.0
- Livability +4.2/5.0
- Cash flow +3.6/30.0
- Rent growth +3.3/5.0
- Condition / age +2.5/5.0
- 1% rule +0.0/10.0
- DSCR +0.0/10.0
$575,000
🖨 Deal sheet 📄 Offer letter ✓ Due diligence
Listing remarks
Beautiful 4-bedroom home in sought-after Woodbury Crossing! Walking into the home, you're greeted with an open entrance, tall ceilings and lots of natural light. The entire main level offers an open-concept design, maximizing living space and creating a seamless flow. The oversized island and functional kitchen layout create a warm, inviting space that is perfect for hosting, gathering, or simply enjoying everyday living. All bedrooms are thoughtfully located upstairs, along with a versatile loft space and conveniently place oversized laundry room. The spacious primary suite features a private ensuite bathroom and walk-in closet. Situated on a premium lot backing to a retention pond, enjoy
Key facts
- Open-concept design
- Tall ceilings
- Versatile loft space
Tags
Neighborhood map
What this means for you Summary
Snapshot
- This is a 3-bed/2.5-bath single-family listed at $575k.
Deal economics
- At list price, monthly cash flow is $-2k ($-21k/yr) — negative.
- To cash-flow at today's rent, offer at most $271k (52.8% below list).
- To meet the 1% rule (rent ≥ 1% of price), the offer needs to be $269k (53.1% below list).
- Recommended offer: $269k (53.1% below list) — sets the bar for 1% rule.
Location & tenants
- Location reads 83/100 on livability (#58 in WA, #1,036 nationally) — a professional / high-income tenant draw. Strengths: amenities A+, commute A+, health & safety A+; Watch: crime F, cost of living D-.
- Olympia School District (urban): math 66% / reading 75% proficiency, ranked #17 of 291 in WA (top 6%) — strong family-tenant draw, lease renewals of 3-5y typical.
- Market conditions: Rents rising (+3.2%/yr); 304 active listings in the ZIP; 1 comparable units currently listed for rent nearby; solid renter incomes; 1,222 units permitted in Thurston County in 2024 (508 in 5+ unit buildings).
- This rent runs 35% of the median local income ($92k/yr) — at the standard rent-burdened threshold; future hikes will face affordability resistance.
Forward outlook
- In year one you build about $61k of equity ($4k loan paydown + $58k appreciation (10.0% local appreciation)).
- Thurston County population projected at +27% by 2050 — long-run rental-demand tailwind backs the buy-and-hold thesis.
- By year 2, paydown + projected appreciation supports a ~$99k cash-out refi (75% LTV) — recoverable capital for the next deal without selling this one.
Negotiation context
- Only 10 days on market — expect competitive offers; lowballing is unlikely to land.
- 3 sale attempts since 6y ago with the ask held roughly flat each time — persistent listings suggest the price (not the market) is what's stuck; bring a comps-based counter.
- Current owner paid $435k; 32% above their basis — modest negotiation headroom, anchor on the comps not their cost.
Questions for the listing agent
- What do current leases actually rent for vs. the listed asking? Can we see a recent rent roll and the last 12 months of T-12 income?
- What does the HOA fee cover, when was the last increase, and are there any pending special assessments or reserve-fund shortfalls?
- Is there a deadline driving the sale (1031 exchange, divorce, estate, relocation)? That informs how much negotiation room exists.
- Schools are A-rated — typically a magnet for longer-tenancy family renters. What's the average tenant stay here, and is there a school-zone premium baked into asking?
- Crime grade is F in this area — have there been break-ins, vandalism, or insurance claims at this property in the last 3 years? What carrier currently insures it and at what premium?
- The area grade is low — what's the realistic commute time and amenity access for the typical tenant pool here? Any planned neighborhood developments (good or bad) we should know about?
- What's the average days-on-market for RENTAL listings here right now (not sales)? A rising rental-DOM trend means longer vacancies and softer asking-rent achievability than the comps imply.
- What's the recent tenant-quality profile in this submarket — average credit score on applications, eviction rate, late-payment / NSF rate, and stable-employment percentage? A property-management company in the area should have these aggregated.
- How much new for-sale + rental construction is in the pipeline within 1–3 miles? Heavy new supply typically softens prices + rents 12–24 months out; constrained supply supports both.
Investment metrics
- 1% rule
- 0.47% ✗
- Cap rate
- 2.71%
- Cash-on-cash
- -12.81%
- DSCR
- 0.43
- GRM
- 17.8
CMA / ARV
- ARV (on-the-fly)
- $650,504
- Comps found
- 12
Show comp detail 12 sales within ~0.75 mi
| Address | Dist | Beds/Ba | Sqft | Sold | Price | $/sf | Match |
|---|---|---|---|---|---|---|---|
| 4806 3rd (Lot 17) Ave NW | 0.21mi | 4/2.5 (+1) | 2,745 (+3%) | 0mo | $699,443 | $255 | 80 |
| 449 Woodduck Dr SW | 0.03mi | 4/2.5 (+1) | 2,545 (-4%) | 10mo | $576,250 | $226 | 78 |
| 317 Nine Bark St NW | 0.46mi | 4/2.5 (+1) | 2,768 (+4%) | 3mo | $558,000 | $202 | 64 |
| 610 Meadowwood Dr SW | 0.16mi | 4/2.5 (+1) | 2,311 (-13%) | 3mo | $565,000 | $244 | 63 |
| 4717 Greenwood Dr SW | 0.23mi | 4/2.5 (+1) | 2,624 (-2%) | 23mo | $574,900 | $219 | 62 |
| 213 Serene View (Lot 4) Pl NW | 0.18mi | 4/2.5 (+1) | 2,330 (-13%) | 4mo | $599,950 | $257 | 62 |
| 617 Birchwood Dr SW | 0.17mi | 4/2.5 (+1) | 2,311 (-13%) | 4mo | $569,900 | $247 | 62 |
| 514 Woodduck Dr SW | 0.07mi | 4/2.5 (+1) | 2,501 (-6%) | 24mo | $585,000 | $234 | 62 |
| 4921 Greenwood Dr SW | 0.21mi | 4/2.5 (+1) | 2,455 (-8%) | 14mo | $560,000 | $228 | 60 |
| 4905 Greenwood Dr SW | 0.22mi | 4/2.5 (+1) | 2,382 (-11%) | 12mo | $575,000 | $241 | 57 |
| 448 Woodduck Dr SW | 0.05mi | 4/2.5 (+1) | 2,354 (-12%) | 20mo | $575,000 | $244 | 56 |
| 602 Birchwood Dr SW | 0.14mi | 4/2.5 (+1) | 2,363 (-11%) | 22mo | $579,900 | $245 | 51 |
Match score weights: distance 35% · size 25% · config 20% · recency 20%. Top-matched comps best support the ARV.
Projected returns pro-forma
10.0% appreciation · 3.16% rent growth · sell at horizon
- IRR
- 15.4%
- Equity multiple
- 2.27×
- Total profit
- $204,102
- Equity at exit
- $518,006
- IRR
- 15.0%
- Equity multiple
- 5.27×
- Total profit
- $687,936
- Equity at exit
- $1,117,099
Cash invested: $161,000 (down + closing). Projections, not guarantees.
Landlord ↔ Tenant lean methodology
- Overall (STATE)
- 28 Tenant-Leaning
- State Washington
- 28 Tenant-Leaning · D+8
- County
- — inherits STATE
- City
- — inherits STATE
ZIP-level market 98502
- Home prices YoY
- 1.8%
- Rents YoY
- 3.2%
- Active inventory
- 304
- Price-to-rent
- 17.8×
Monthly cashflow live
- Estimated rent
- $2,694 medium interval (Pro) →
- Mortgage (P&I)
- −$3,015
- Tax from tax record
- −$540 /mo · $6,482/yr
- Insurance
- −$240
- HOA
- −$52
- Vacancy / Maint / Mgmt
- −$566
- Net cashflow
- $-1,719
Break-even live
UW: 25.0% down · 7.5% · 30yr · 1.5% tax · 5.0% vac · 8.0% maint · 8.0% mgmt
Financing live
Cash to close
- Down payment
- $143,750
- Closing costs
- $17,250
- Reserves months
- —
- Total cash needed
- —
Loan-product check · same deal, 3 products live
Conventional
25% down · 7.5% · 30yr
- Down + closing
- —
- Monthly P&I
- —
- Monthly cashflow
- —
- DSCR
- —
- Eligible?
- —
Personal DTI + credit; lowest rate.
DSCR
20% down · 8.5% · 30yr
- Down + closing
- —
- Monthly P&I
- —
- Monthly cashflow
- —
- DSCR
- —
- Eligible?
- —
No personal income docs; deal must DSCR.
Hard money
10% down · 12.0% · 12mo
- Down + closing
- —
- Monthly P&I
- —
- Monthly cashflow
- —
- DSCR
- —
- Eligible?
- —
Short-term bridge; refi at stabilization.
Rent comps 1 comps
| Address | Beds | Baths | Sqft | Rent | $/sqft | DOM | Units | Dist |
|---|---|---|---|---|---|---|---|---|
| 4407 Goldcrest Dr NW Olympia, WA | 4.0 | 2.5 | 2615 | $2,950 | $1.13 | 43d | 1 | 0.95mi |
HOA detail
- Monthly dues
- $52 · $624/yr
Listing history 10 events
-
2026-04-27status Pending
-
2026-04-16$575,000 Active
-
2024-10-21historical $2,950
-
2024-10-04$2,950
-
2023-05-18historical
-
2020-07-02historical
-
2020-07-02soldstatus $434,900 Sold
-
2020-06-05status Pending
-
2020-06-01status Pending Inspection
-
2020-05-29$434,900 Active
ⓘ Source: listings_history table (triggers on properties + properties_extension) + one-shot
backfill from property_details.listing_events for pre-trigger history.
Tax reassessment forecast WA · Resets to sale price
- Current annual tax
- $6,482 · $540/mo
- Projected year-2 tax
- $6,482 · $540/mo
- Expected delta
- $0/yr ($0/mo · 0.0%)
ⓘ Screening estimate from a state-policy table — verify with the county assessor before closing.
Climate risk First Street
- Flood 1/10 Low FEMA zone X (unshaded) · 0% chance over 30 yrs
- Wildfire 3/10 Moderate
- Heat 3/10 Moderate 7 d/yr ≥88°F today · 15 d/yr by 30 yrs out
- Wind 1/10 Low
- Air quality 6/10 Major 6 unhealthy d/yr today · 6 by 30 yrs out
Nearby sold comps map
Loading sold comps map…
Walkable amenities ~0.75 mi
Loading nearby amenities…
Taxation est. · year 1
- Rental income
- $32,333
- − Mortgage interest
- −$32,209
- − Property taxes
- −$6,482
- − Insurance
- −$2,875
- − Repairs & maintenance
- −$2,587
- − Management
- −$2,587
- − HOA
- −$624
- − Depreciation
- −$16,727
- Taxable loss
- −$31,758
- Est. tax savings @ 24.0%
- +$7,622
- After-tax cash flow
- $-13,001/yr
For passive investors: Depreciation is non-cash, so a rental often shows a tax loss while cash-flowing — sheltering income. Rental losses are passive: they offset passive income freely, and up to $25,000/yr can offset ordinary (W-2) income if you actively participate and your MAGI is under $100k (phasing out to $0 by $150k); unused losses carry forward. On sale, claimed depreciation is recaptured at up to 25%, and gains may owe capital-gains tax (a 1031 exchange can defer both). Figures are a year-1 estimate at your 24.0% rate — not tax advice; consult a CPA.
Schools (NCES district)
- District
- Olympia School District
- NCES district ID
- 5306180
- Math proficiency
- 66% ▼ -2.00%
- Reading proficiency
- 75% ▼ -2.00%
- Median HH income
- $63,852
- Composite
- 62.27/100
- National rank
- #1438
- State rank
- #17 of 291 in WA
Livability — Olympia
- Score
- 83/100
- State rank
- #58
- US rank
- #1036
Category grades
Schools grade is shown separately in the Schools card above.
Census & demographics
- Census place
- Olympia, WA
- County
- Thurston County · 269,345 people
- City population
- 98,428
- Metro
- Olympia-Lacey-Tumwater, WA
- Population (ZIP)
- 35,398
- Household income
- $92,207
- Rent vs Own
- Severe rent burden
- 1811.0
Population outlook (Thurston County) Hauer SSP2
- Today (2025)
- 308,239 people
- By 2030
- 326,483 · +5.9%
- By 2040
- 359,890 · +16.8%
- By 2050
- 391,800 · +27.1%
- By 2075
- 468,024 · +51.8%
- By 2100
- 519,890 · +68.7%
Race, ethnicity, and origin ACS 2023
- Neighborhood character
- Predominantly White (71%)
- Race & ethnicity
- White 71% Two or more races 13% Hispanic / Latino 11% Asian 6% Black 3% Native American 1%
- Hispanic origin (detail)
- Mexican 3% Puerto Rican 4%
- Common ancestry
- Italian 5% Portuguese 4% Iranian 3%
- Foreign-born
- 8% · Vietnam, Canada, China
- Languages at home
- 90% English-only · Spanish 3% Vietnamese 2% Other Asian/Pacific 1%
Political lean MEDSL · Thurston
- 2024 margin
- Strong D (+20.4) · D 58.5% · R 38.1% · Other 3.5%
- 2008→2024 swing
- -1.3pp toward R · 2008: 21.7pp · 2024: 20.4pp
- All cycles
- 2024: D+20.4 2020: D+18.6 2016: D+15.4 2012: D+19.0 2008: D+21.7
Not yet ingested
- Civics
- —
Market trends
- HPI YoY
- ▲ 18.49%
- Current HPI
- 1056.49
- Rent YoY
- ▲ 3.16%
- Metro
- Olympia-Lacey-Tumwater, WA
- State GDP YoY
- ▲ 4.65%
- F500 in state
- 22
Industry mix (Fortune 500 HQ in WA)
| Industry | F500 HQs | Revenue |
|---|---|---|
| Retail | 2 | $269B |
|
||
| Technology / Retail | 1 | $638B |
|
||
| Technology | 1 | $245B |
|
||
| Telecommunications | 1 | $38B |
|
||
| Food / Beverage | 1 | $36B |
|
||
| Automotive / Trucks | 1 | $34B |
|
||
Price history
+32.2% since first listed10 events — show timeline
- 2026-04-27 Pending — NWMLS as Distributed by MLS Grid
- 2026-04-16 Listed $575,000 NWMLS as Distributed by MLS Grid
- 2024-10-21 Rental Removed $2,950 BUILDIUM
- 2024-10-04 Listed for Rent $2,950 BUILDIUM
- 2023-05-18 Rental Removed — BUILDIUM
- 2020-07-02 Delisted — NWMLS as Distributed by MLS Grid
- 2020-07-02 Sold (MLS) $434,900 NWMLS as Distributed by MLS Grid
- 2020-06-05 Pending — NWMLS as Distributed by MLS Grid
- 2020-06-01 Pending — NWMLS as Distributed by MLS Grid
- 2020-05-29 Listed $434,900 NWMLS as Distributed by MLS Grid
Property tax history
+23.7%/yrLatest (2026): $6,482 · +4.2% YoY. Source: county tax records.
Cash-flow waterfall
monthlySold comps — $/sqft
last 12 mo · ≤1 miLoading sold comps…