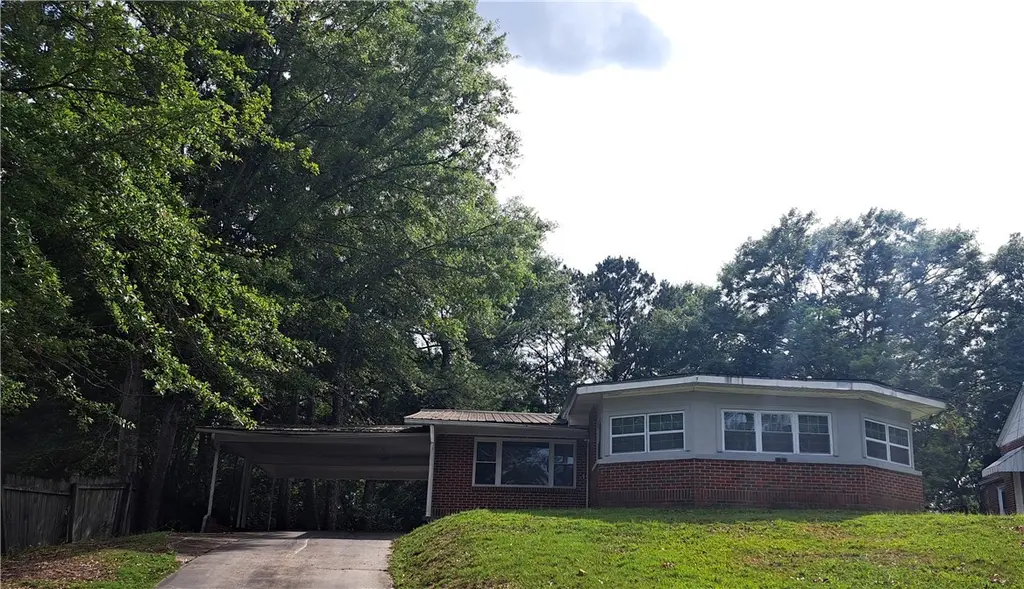
1103 Bibb St · Tuskegee, AL
Flood risk 1/10 · Minimal
- FEMA flood zone
- X (unshaded)
- Chance of flooding over 30 yrs
- 0.0%
- Est. flood insurance / yr
- $507 – $1,088
Fire risk 4/10 · Minor
- Est. fire insurance / yr
- $916 – $1,700
Heat risk 6/10 · Moderate
- Hot days now (above 106°F)
- 7 days/yr
- Hot days in 30 yrs
- 19 days/yr
Wind risk 6/10 · Moderate
- Chance of severe wind over 30 yrs
- 73.0%
Air-quality risk 2/10 · Minimal
- Unhealthy air days now
- 1 days/yr
- Unhealthy air days in 30 yrs
- 1 days/yr
Risk factors via First Street. Map © Google.
Why this score? — see what drove the D grade
The composite is a weighted blend of 9 inputs, each scored 0–100. Each bar is that input's sub-score; the figure is the points it added to the 100-point composite (weight × sub-score).
- Cash flow +13.3/30.0
- ARV discount +7.5/15.0
- Appreciation +5.1/10.0
- DSCR +4.0/10.0
- Livability +2.9/5.0
- 1% rule +2.6/10.0
- Rent growth +2.5/5.0
- Condition / age +2.5/5.0
- Schools +0.7/10.0
$255,000
🖨 Deal sheet (PDF) 📄 Offer letter ✓ Due diligence
Listing remarks
This beautifully renovated home has been transformed inside and out, offering a fresh, modern feel throughout. The interior has undergone extensive updates, beginning remodeling of the living room, hallways, three bedrooms, and two bathrooms. New sheetrock, finishes, and trim create a clean, polished look, while every room—including the bedrooms, living room, family room, hallway, bathrooms, and kitchen—has been freshly painted from walls to ceilings and trim. Both bathrooms have been fully remodeled with tiled showers and floors, new vanity cabinets, mirrors, toilets, lighting, and hardware. The hallway bathtub has been refinished and glazed for a like-new appearance. The kitch
Key facts
- Renovated home
- Tiled showers
- Extensive updates
Tags
Property features AI
Finance
- HOA & community: No association amenities
Exterior
- Parking: Carport (1 space)
- Utilities: Water available
- Home design: Single-story residential home; Brick construction; Slab foundation
- Construction: Brick exterior; Slab foundation
- Exterior features: No fencing; Approximately 0.45-acre lot
Interior
- Kitchen: Cooktop; Electric range; Refrigerator
- Bathrooms: Three full bathrooms (all on the main level)
- Heating & cooling: Electric heating; Central air conditioning; Ceiling fans for cooling
- Interior features: Ceiling fans
- Laundry & utility: Washer; Dryer
Neighborhood map
What this means for you Summary
Snapshot
- This is a 3-bed/2.0-bath single-family listed at $255k.
Deal economics
- At list price, monthly cash flow is $2 ($22/yr) — positive.
- The deal already cash-flows at list — no discount required.
- To meet the 1% rule (rent ≥ 1% of price), the offer needs to be $195k (23.5% below list).
- Recommended offer: $195k (23.5% below list) — sets the bar for 1% rule.
Location & tenants
- Location reads 57/100 on livability (#375 in AL) — a working-class tenant base; expect higher turnover. Strengths: cost of living A+, housing A; Watch: crime F, amenities F, commute F.
- Macon County (town): math 2% / reading 17% proficiency, ranked #123 of 129 in AL (top 95%) — low school quality limits family demand, transient renter base, plan for 1-2y turnover; 97% free/reduced lunch — lower-income household profile, screen leases tightly.
- Zoned schools: Tuskegee Public Elementary (math 2% / reading 12%, grade F, #245 of 257 statewide, top 96%, 265 students, 98% FRL) — zoned schools at 98% FRL track the district average.
- Market conditions: 10 active listings in the ZIP; 1 comparable units currently listed for rent nearby; 5 units permitted in Macon County in 2024 (0 in 5+ unit buildings).
Forward outlook
- In year one you build about $2k of equity ($2k loan paydown + $395 appreciation (0.1% local appreciation)).
- Macon County population projected at -42% by 2050 — secular population decline; favor cash flow + early exit over multi-decade hold.
Negotiation context
- Only 11 days on market — expect competitive offers; lowballing is unlikely to land.
- Current owner paid $75k; list at $255k implies a 240% gain — meaningful room to come down on a strong offer.
Risks & watch-outs
- Watch-outs: built in 1952 — expect roof / HVAC / electrical / plumbing capex.
- Climate carrying-cost: major wind risk, 73% chance of damaging wind over 30y; extreme-heat days projected 7→19/yr by 2055 (HVAC capex compounding) — expect insurance premiums to compound above CPI over the hold.
Questions for the listing agent
- Built in 1952 — when were the roof, HVAC, electrical panel, plumbing, and water heater last replaced?
- Is there a deadline driving the sale (1031 exchange, divorce, estate, relocation)? That informs how much negotiation room exists.
- Schools are F-rated, which usually means shorter tenancies and higher turnover. Who's the typical renter profile here, and what's been the actual vacancy rate?
- Crime grade is F in this area — have there been break-ins, vandalism, or insurance claims at this property in the last 3 years? What carrier currently insures it and at what premium?
- The area grade is low — what's the realistic commute time and amenity access for the typical tenant pool here? Any planned neighborhood developments (good or bad) we should know about?
- What's the average days-on-market for RENTAL listings here right now (not sales)? A rising rental-DOM trend means longer vacancies and softer asking-rent achievability than the comps imply.
- What's the recent tenant-quality profile in this submarket — average credit score on applications, eviction rate, late-payment / NSF rate, and stable-employment percentage? A property-management company in the area should have these aggregated.
- How much new for-sale + rental construction is in the pipeline within 1–3 miles? Heavy new supply typically softens prices + rents 12–24 months out; constrained supply supports both.
Investment metrics
- 1% rule
- 0.76% ✗
- Cap rate
- 6.30%
- Cash-on-cash
- 0.03%
- DSCR
- 1.00
- GRM
- 10.9
CMA / ARV
- ARV (on-the-fly)
- $144,160
- Comps found
- 3
Show comp detail 3 sales within ~0.75 mi
| Address | Dist | Beds/Ba | Sqft | Sold | Price | $/sf | Match |
|---|---|---|---|---|---|---|---|
| 1809 W Montgomery Rd | 0.17mi | 3/2.0 | 1,472 (-13%) | 12mo | $175,000 | $119 | 59 |
| 2309 Alabama Ave | 0.66mi | 3/2.0 | 1,632 (-4%) | 7mo | $138,000 | $85 | 57 |
| 804 Gaillard Dr | 0.71mi | 3/2.0 | 1,479 (-13%) | 14mo | $80,000 | $54 | 34 |
Match score weights: distance 35% · size 25% · config 20% · recency 20%. Top-matched comps best support the ARV.
Projected returns pro-forma
0.15% appreciation · 3.0% rent growth · sell at horizon
- IRR
- -1.6%
- Equity multiple
- 0.92×
- Total profit
- $-5,588
- Equity at exit
- $76,025
- IRR
- 3.9%
- Equity multiple
- 1.43×
- Total profit
- $30,417
- Equity at exit
- $92,982
Cash invested: $71,400 (down + closing). Projections, not guarantees.
Landlord ↔ Tenant lean methodology
- Overall (STATE)
- 90 Strongly Landlord-Friendly
- State Alabama
- 90 Strongly Landlord-Friendly · R+15
- County
- — inherits STATE
- City
- — inherits STATE
ZIP-level market 36088
- Home prices YoY
- 0.1%
- Active inventory
- 10
- Price-to-rent
- 10.9×
Monthly cashflow live
- Estimated rent
- $1,950 medium interval (Pro) →
- Mortgage (P&I)
- −$1,337
- Tax from tax record
- −$95 /mo · $1,142/yr
- Insurance
- −$106
- HOA
- −$0
- Vacancy / Maint / Mgmt
- −$410
- Net cashflow
- $2
Break-even live
Sensitivity live
| Price | -10% $146 | -5% $74 | +0% $2 | +5% $-70 | +10% $-143 |
|---|---|---|---|---|---|
| Rent | -10% $-152 | -5% $-75 | +0% $2 | +5% $79 | +10% $156 |
| Rate | -1.0pp $130 | -0.5pp $67 | base $2 | +0.5pp $-64 | +1.0pp $-131 |
UW: 25.0% down · 7.5% · 30yr · 1.5% tax · 5.0% vac · 8.0% maint · 8.0% mgmt
Financing live
Cash to close
- Down payment
- $63,750
- Closing costs
- $7,650
- Reserves months
- —
- Total cash needed
- —
Loan-product check · same deal, 3 products live
Conventional
25% down · 7.5% · 30yr
- Down + closing
- —
- Monthly P&I
- —
- Monthly cashflow
- —
- DSCR
- —
- Eligible?
- —
Personal DTI + credit; lowest rate.
DSCR
20% down · 8.5% · 30yr
- Down + closing
- —
- Monthly P&I
- —
- Monthly cashflow
- —
- DSCR
- —
- Eligible?
- —
No personal income docs; deal must DSCR.
Hard money
10% down · 12.0% · 12mo
- Down + closing
- —
- Monthly P&I
- —
- Monthly cashflow
- —
- DSCR
- —
- Eligible?
- —
Short-term bridge; refi at stabilization.
Rent comps 1 comps
| Address | Beds | Baths | Sqft | Rent | $/sqft | DOM | Units | Dist |
|---|---|---|---|---|---|---|---|---|
| 1101 New St Tuskegee, AL | 3.0 | 3.0 | 1528 | $1,950 | $1.28 | 44d | 1 | 0.71mi |
Listing history 10 events
-
2026-06-19days on market $255,000 Active 11 DOM
-
2026-06-18days on market $255,000 Active 10 DOM
-
2026-06-17days on market $255,000 Active 9 DOM
-
2026-06-16days on market $255,000 Active 8 DOM
-
2026-06-15days on market $255,000 Active 7 DOM
-
2026-06-14days on market $255,000 Active 5 DOM
-
2026-06-13days on market $255,000 Active 4 DOM
-
2026-06-10days on market $255,000 Active 2 DOM
-
2026-06-09remarks 687-char remark
-
2026-06-09$255,000 Active 1 DOM
ⓘ Source: listings_history table (triggers on properties + properties_extension) + one-shot
backfill from property_details.listing_events for pre-trigger history.
Tax reassessment forecast AL · Resets to sale price
- Current annual tax
- $1,142 · $95/mo
- Projected year-2 tax
- $1,142 · $95/mo
- Expected delta
- $0/yr ($0/mo · 0.0%)
ⓘ Screening estimate from a state-policy table — verify with the county assessor before closing.
Climate risk First Street
- Flood 1/10 Low FEMA zone X (unshaded) · 0% chance over 30 yrs
- Wildfire 4/10 Moderate
- Heat 6/10 Major 7 d/yr ≥106°F today · 19 d/yr by 30 yrs out
- Wind 6/10 Major 73% chance of damaging wind over 30 yrs
- Air quality 2/10 Low 1 unhealthy d/yr today · 1 by 30 yrs out
Nearby sold comps map
Loading sold comps map…
Walkable amenities ~0.75 mi
Loading nearby amenities…
Taxation est. · year 1
- Rental income
- $23,400
- − Mortgage interest
- −$14,284
- − Property taxes
- −$1,142
- − Insurance
- −$1,275
- − Repairs & maintenance
- −$1,872
- − Management
- −$1,872
- − Depreciation
- −$7,418
- Taxable loss
- −$4,463
- Est. tax savings @ 24.0%
- +$1,071
- After-tax cash flow
- $1,093/yr
For passive investors: Depreciation is non-cash, so a rental often shows a tax loss while cash-flowing — sheltering income. Rental losses are passive: they offset passive income freely, and up to $25,000/yr can offset ordinary (W-2) income if you actively participate and your MAGI is under $100k (phasing out to $0 by $150k); unused losses carry forward. On sale, claimed depreciation is recaptured at up to 25%, and gains may owe capital-gains tax (a 1031 exchange can defer both). Figures are a year-1 estimate at your 24.0% rate — not tax advice; consult a CPA.
Schools (NCES district)
- District
- Macon County
- NCES district ID
- 0102190
- Math proficiency
- 2% ▼ -18.00%
- Reading proficiency
- 17% ▼ -8.00%
- Median HH income
- $30,012
- Composite
- 7.24/100
- National rank
- #9958
- State rank
- #123 of 129 in AL
Livability — Tuskegee
- Score
- 57/100
- State rank
- #375
- US rank
- #21590
Category grades
Schools grade is shown separately in the Schools card above.
Census & demographics
- Census place
- Tuskegee, AL
- City population
- 3,493
- Population (ZIP)
- 3,493
Population outlook (Macon County) Hauer SSP2
- Today (2025)
- 15,805 people
- By 2030
- 14,101 · -10.8%
- By 2040
- 11,244 · -28.9%
- By 2050
- 9,088 · -42.5%
- By 2075
- 6,606 · -58.2%
- By 2100
- 6,309 · -60.1%
Race, ethnicity, and origin ACS 2023
- Neighborhood character
- Predominantly Black (83%)
- Race & ethnicity
- Black 83% White 10% Two or more races 3% Hispanic / Latino 2% Asian 1%
- Foreign-born
- 2% · Canada
- Languages at home
- 98% English-only · Other Indo-European 1% Spanish 1%
Political lean MEDSL · Macon
- 2024 margin
- Solid D (+56.3) · D 77.8% · R 21.5%
- 2008→2024 swing
- -17.8pp toward R · 2008: 74.0pp · 2024: 56.3pp
- All cycles
- 2024: D+56.3 2020: D+63.8 2016: D+66.8 2012: D+74.4 2008: D+74.0
Not yet ingested
- Civics
- —
Market trends
- HPI YoY
- ▲ 0.15%
- Current HPI
- 149.1572
- Rent YoY
- —
- Metro
- —
- State GDP YoY
- ▲ 2.94%
- F500 in state
- 4
Industry mix (Fortune 500 HQ in AL)
| Industry | F500 HQs | Revenue |
|---|---|---|
| Financial Services | 1 | $8B |
|
||
| Healthcare | 1 | $5B |
|
||
Price history
+240.0% since first listed2 events — show timeline
- 2026-06-08 Listed $255,000 LCMLS
- 2024-05-07 Sold (Public Records) $75,000 Public Records
Property tax history
+5.2%/yrLatest (2025): $1,142 · +40.8% YoY. Source: county tax records.
Cash-flow waterfall
monthlySold comps — $/sqft
last 12 mo · ≤1 miLoading sold comps…