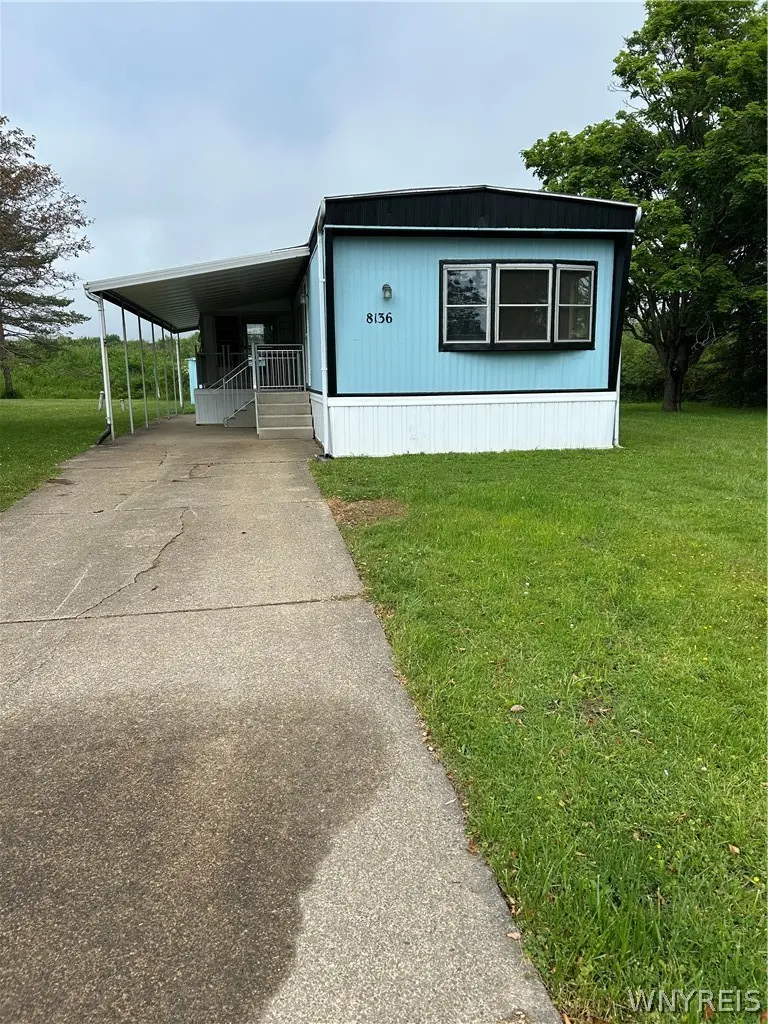
8136 Amy Jenn Dr · Angola on the Lake, NY
Flood risk 1/10 · Minimal
- FEMA flood zone
- X (unshaded)
- Chance of flooding over 30 yrs
- 0.0%
- Est. flood insurance / yr
- $507 – $1,088
Fire risk 3/10 · Minor
- Est. fire insurance / yr
- $691 – $1,283
Heat risk 2/10 · Minimal
- Hot days now (above 93°F)
- 7 days/yr
- Hot days in 30 yrs
- 17 days/yr
Wind risk 1/10 · Minimal
- Chance of severe wind over 30 yrs
- —
Air-quality risk 3/10 · Minor
- Unhealthy air days now
- 2 days/yr
- Unhealthy air days in 30 yrs
- 5 days/yr
Risk factors via First Street. Map © Google.
Why this score? — see what drove the B- grade
The composite is a weighted blend of 9 inputs, each scored 0–100. Each bar is that input's sub-score; the figure is the points it added to the 100-point composite (weight × sub-score).
- Cash flow +30.0/30.0
- 1% rule +10.0/10.0
- DSCR +10.0/10.0
- ARV discount +7.5/15.0
- Schools +4.1/10.0
- Livability +3.0/5.0
- Rent growth +2.5/5.0
- Condition / age +2.5/5.0
- Appreciation +0.0/10.0
$36,900
🖨 Deal sheet 📄 Offer letter ✓ Due diligence
Listing remarks MLS
Nicely maintained 2 bedroom, enclosed porch entry, spacious living room, dining with built in hutch. Galley style kitchen with plenty of cabinets, counter space, stove and refrigerator. Front bedroom with large closet, bay window. Master bedroom has built in dresser, spacious bath with garden tub, walk in shower, vanity, linen closet. Laundry room with cabinets. Storage shed. Located on wooded lot, well maintained community, star tax credit eligible. Great opportunity for home ownership.
Key facts
- Parking
- Built 1977
- Listed 7 days
Property features AI
Finance
- Financial info: Land lease payment of $716
- HOA & community: Has land lease
Exterior
- Parking: Carport
- Utilities: Public water connected; Sewer connected; Circuit breaker electrical service
- Home design: Single-wide mobile home; One story; Existing structure; Faces private road
- Construction: Aluminum siding; PEX plumbing; Flat roof; Pillar/post/pier foundation; Manufactured by Astro
- Exterior features: Concrete driveway; Porch (screened); Shed(s) / storage
Interior
- Kitchen: Galley-style kitchen; Gas oven and gas range; Refrigerator
- Bedrooms: Two main-level bedrooms
- Flooring: Carpet; Luxury vinyl; Varied flooring
- Bathrooms: Two full bathrooms (both on the main level)
- Heating & cooling: Gas forced-air heating
- Interior features: Separate/formal living room; Galley kitchen; Bath in primary bedroom; Main level primary bedroom
- Laundry & utility: Main-level laundry; Dryer; Electric water heater
Neighborhood map
What this means for you Summary
Snapshot
- This is a 2-bed/2.0-bath single-family listed at $37k.
Deal economics
- At list price, monthly cash flow is $614 ($7k/yr) — positive.
- The deal already cash-flows at list — no discount required.
- Meets the 1% rule at list price ($1k rent vs $37k).
Location & tenants
- Location reads 60/100 on livability (#1,000 in NY) — a middle-class / working-renter tenant base. Strengths: housing A+, crime A, cost of living B+; Watch: employment D, schools F, amenities F.
- Evans-Brant Central School District (Lake Shore) (suburban): math 43% / reading 51% proficiency, ranked #424 of 590 in NY (top 72%) — families likely to look elsewhere, expect single-tenant / working-renter base with shorter leases.
- Market conditions: 100 active listings in the ZIP; 1 comparable units currently listed for rent nearby; 1,244 units permitted in Erie County in 2024 (563 in 5+ unit buildings).
Forward outlook
- Local home prices are declining (-3.0%/yr); year-one equity from $255 of loan paydown is wiped out by about $1k of value loss. Plan a longer hold.
- At projected returns (-3.0% appreciation + 3.0% rent growth), your $10k cash investment doubles in ~2 years — after that, you're playing with house money.
Negotiation context
- Only 7 days on market — expect competitive offers; lowballing is unlikely to land.
- 2 sale attempts since 7y ago with the ask held roughly flat each time — persistent listings suggest the price (not the market) is what's stuck; bring a comps-based counter.
- Current owner paid $7k; list at $37k implies a 427% gain — meaningful room to come down on a strong offer.
Questions for the listing agent
- Built in 1977 — when were the roof, HVAC, electrical panel, plumbing, and water heater last replaced?
- Is there a deadline driving the sale (1031 exchange, divorce, estate, relocation)? That informs how much negotiation room exists.
- Schools are F-rated, which usually means shorter tenancies and higher turnover. Who's the typical renter profile here, and what's been the actual vacancy rate?
- What's the average days-on-market for RENTAL listings here right now (not sales)? A rising rental-DOM trend means longer vacancies and softer asking-rent achievability than the comps imply.
- What's the recent tenant-quality profile in this submarket — average credit score on applications, eviction rate, late-payment / NSF rate, and stable-employment percentage? A property-management company in the area should have these aggregated.
- How much new for-sale + rental construction is in the pipeline within 1–3 miles? Heavy new supply typically softens prices + rents 12–24 months out; constrained supply supports both.
Investment metrics
- 1% rule
- 2.98% ✓
- Cap rate
- 26.26%
- Cash-on-cash
- 71.31%
- DSCR
- 4.17
- GRM
- 2.8
CMA / ARV
No comps found within radius.
Projected returns pro-forma
-3.0% appreciation · 3.0% rent growth · sell at horizon
- IRR
- 70.9%
- Equity multiple
- 4.21×
- Total profit
- $33,143
- Equity at exit
- $5,502
- IRR
- 74.9%
- Equity multiple
- 8.67×
- Total profit
- $79,282
- Equity at exit
- $3,190
Cash invested: $10,332 (down + closing). Projections, not guarantees.
Landlord ↔ Tenant lean methodology
- Overall (STATE)
- 15 Strongly Tenant-Friendly
- State New York
- 15 Strongly Tenant-Friendly · D+10
- County
- — inherits STATE
- City
- — inherits STATE
ZIP-level market 14006
- Home prices YoY
- -16.8%
- Active inventory
- 100
- Price-to-rent
- 2.8×
Monthly cashflow live
- Estimated rent
- $1,100 medium interval (Pro) →
- Mortgage (P&I)
- −$194
- Tax est. 1.5%
- −$46 /mo · $554/yr
- Insurance
- −$15
- HOA
- −$0
- Vacancy / Maint / Mgmt
- −$231
- Net cashflow
- $614
Break-even live
UW: 25.0% down · 7.5% · 30yr · 1.5% tax · 5.0% vac · 8.0% maint · 8.0% mgmt
Financing live
Cash to close
- Down payment
- $9,225
- Closing costs
- $1,107
- Reserves months
- —
- Total cash needed
- —
Loan-product check · same deal, 3 products live
Conventional
25% down · 7.5% · 30yr
- Down + closing
- —
- Monthly P&I
- —
- Monthly cashflow
- —
- DSCR
- —
- Eligible?
- —
Personal DTI + credit; lowest rate.
DSCR
20% down · 8.5% · 30yr
- Down + closing
- —
- Monthly P&I
- —
- Monthly cashflow
- —
- DSCR
- —
- Eligible?
- —
No personal income docs; deal must DSCR.
Hard money
10% down · 12.0% · 12mo
- Down + closing
- —
- Monthly P&I
- —
- Monthly cashflow
- —
- DSCR
- —
- Eligible?
- —
Short-term bridge; refi at stabilization.
Rent comps 1 comps
| Address | Beds | Baths | Sqft | Rent | $/sqft | DOM | Units | Dist |
|---|---|---|---|---|---|---|---|---|
| 26 Orchard Ave Unit 1 Angola, NY | 1.0 | 1.0 | 900 | $1,100 | $1.22 | 43d | 1 | 1.44mi |
Listing history 7 events
-
2026-06-17status $36,900 Pending 7 DOM
-
2026-06-17days on market $36,900 Active 7 DOM
-
2026-06-16days on market $36,900 Active 6 DOM
-
2026-06-15days on market $36,900 Active 5 DOM
-
2026-06-13days on market $36,900 Active 3 DOM
-
2026-06-12remarks 12-char remark
-
2026-06-12$36,900 Active 2 DOM
ⓘ Source: listings_history table (triggers on properties + properties_extension) + one-shot
backfill from property_details.listing_events for pre-trigger history.
Climate risk First Street
- Flood 1/10 Low FEMA zone X (unshaded) · 0% chance over 30 yrs
- Wildfire 3/10 Moderate
- Heat 2/10 Low 7 d/yr ≥93°F today · 17 d/yr by 30 yrs out
- Wind 1/10 Low
- Air quality 3/10 Moderate 2 unhealthy d/yr today · 5 by 30 yrs out
Nearby sold comps map
Loading sold comps map…
Walkable amenities ~0.75 mi
Loading nearby amenities…
Taxation est. · year 1
- Rental income
- $13,200
- − Mortgage interest
- −$2,067
- − Property taxes
- −$554
- − Insurance
- −$184
- − Repairs & maintenance
- −$1,056
- − Management
- −$1,056
- − Depreciation
- −$1,073
- Taxable income
- $7,210
- Est. tax owed @ 24.0%
- −$1,730
- After-tax cash flow
- $5,638/yr
For passive investors: Depreciation is non-cash, so a rental often shows a tax loss while cash-flowing — sheltering income. Rental losses are passive: they offset passive income freely, and up to $25,000/yr can offset ordinary (W-2) income if you actively participate and your MAGI is under $100k (phasing out to $0 by $150k); unused losses carry forward. On sale, claimed depreciation is recaptured at up to 25%, and gains may owe capital-gains tax (a 1031 exchange can defer both). Figures are a year-1 estimate at your 24.0% rate — not tax advice; consult a CPA.
Schools (NCES district)
- District
- Evans-Brant Central School District (Lake Shore)
- NCES district ID
- 3616560
- Math proficiency
- 43% ▼ -9.00%
- Reading proficiency
- 51% ▲ 6.00%
- Median HH income
- $56,433
- Composite
- 40.89/100
- National rank
- #3619
- State rank
- #424 of 590 in NY
Livability — Angola on the Lake
- Score
- 60/100
- State rank
- #1000
- US rank
- #19506
Category grades
Schools grade is shown separately in the Schools card above.
Census & demographics
- Population (ZIP)
- 9,354
Population outlook (Erie County) Hauer SSP2
- Today (2025)
- 933,037 people
- By 2030
- 935,181 · +0.2%
- By 2040
- 928,531 · -0.5%
- By 2050
- 905,725 · -2.9%
- By 2075
- 834,037 · -10.6%
- By 2100
- 708,033 · -24.1%
Race, ethnicity, and origin ACS 2023
- Neighborhood character
- Predominantly White (92%)
- Race & ethnicity
- White 92% Two or more races 3% Black 2% Asian 1% Hispanic / Latino 1%
- Common ancestry
- Romanian 16% Italian 4% Lithuanian 2%
- Foreign-born
- 3% · Canada, China
- Languages at home
- 96% English-only · French/Haitian/Cajun 1% Spanish 1% Other Asian/Pacific 1%
Political lean MEDSL · Erie
- 2024 margin
- Lean D (+9.7) · D 54.8% · R 45.2%
- 2008→2024 swing
- -7.9pp toward R · 2008: 17.5pp · 2024: 9.7pp
- All cycles
- 2024: D+9.7 2020: D+14.7 2016: D+4.8 2012: D+15.6 2008: D+17.5
Not yet ingested
- Civics
- —
Market trends
- HPI YoY
- ▼ -80.95%
- Current HPI
- 401.7461
- Rent YoY
- —
- Metro
- —
- State GDP YoY
- ▲ 2.60%
- F500 in state
- 92
Industry mix (Fortune 500 HQ in NY)
| Industry | F500 HQs | Revenue |
|---|---|---|
| Financial Services | 10 | $950B |
|
||
| Consumer Goods | 9 | $162B |
|
||
| Insurance | 4 | $225B |
|
||
| Telecommunications | 2 | $144B |
|
||
| Pharmaceuticals | 2 | $112B |
|
||
| Media / Entertainment | 2 | $69B |
|
||
Price history
+238.5% since first listed4 events — show timeline
- 2026-06-10 Listed $36,900 WNYREIS
- 2019-10-14 Sold (MLS) $7,000 WNYREIS
- 2019-10-01 Pending — WNYREIS
- 2019-08-14 Listed $10,900 WNYREIS
Cash-flow waterfall
monthlySold comps — $/sqft
last 12 mo · ≤1 miLoading sold comps…