 Triplex
23090 N Bald Mountain Rd · Phoenix Lake, CA
Flood risk 1/10 · Minimal
- FEMA flood zone
- X (unshaded)
- Chance of flooding over 30 yrs
- 0.0%
- Est. flood insurance / yr
- $507 – $1,088
Fire risk 9/10 · Severe
- Est. fire insurance / yr
- $659 – $1,223
Heat risk 3/10 · Minor
- Hot days now (above threshold)
- —
- Hot days in 30 yrs
- —
Wind risk 1/10 · Minimal
- Chance of severe wind over 30 yrs
- —
Air-quality risk 10/10 · Severe
- Unhealthy air days now
- 29 days/yr
- Unhealthy air days in 30 yrs
- 33 days/yr
Risk factors via First Street. Map © Google.
Why this score? — see what drove the C grade
The composite is a weighted blend of 9 inputs, each scored 0–100. Each bar is that input's sub-score; the figure is the points it added to the 100-point composite (weight × sub-score).
- Cash flow +24.9/30.0
- DSCR +8.1/10.0
- ARV discount +7.5/15.0
- 1% rule +6.4/10.0
- Schools +2.7/10.0
- Rent growth +2.5/5.0
- Livability +2.5/5.0
- Condition / age +2.5/5.0
- Appreciation +0.0/10.0
$369,000
🖨 Deal sheet 📄 Offer letter ✓ Due diligence
Multi-family units
County records classify this as Multi-Family (2-4 Unit). Listing-text estimate: 3 units. confirmed
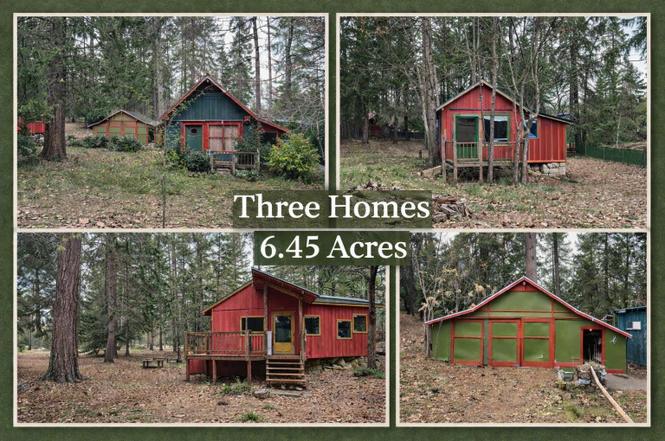
Listing remarks
Great opportunity for rental investment, multi-family cabin retreat, or full time living! This 3 unit property sits on 6.45 acres of wooded land offering privacy in a unique mountain atmosphere. The units include a 2-bed 1-bath, with two additional 1-bed 1-bath units. A strong well producing 15 gallons per minute serves all three homes. There is ample space on the 6.45 acres for more development and outdoor enjoyment. A bonus is the driveway path to a lookout point with views that span far into the distance. This is a one-of-a-kind property. See it today!
Key facts
- Strong well
- Views
- Lookout point
Tags
Property features AI
Finance
- Other: Large lot of about 6.45 acres
- Financial info: Multiple-unit income property (3 units)
Exterior
- Parking: Parking lot with 6 parking spaces
- Utilities: Has heating; Wall/window unit(s) for cooling
- Home design: Residential income property with three houses on one lot; Approximately 2,000 total building area; Secluded setting with front yard
- Construction: Vinyl siding construction; Year built not specified
- Exterior features: Garden/play area; Private entrances; Shed(s)
Interior
- Flooring: Linoleum; Partial carpeting; Tile; Wood
- Bathrooms: Three 1-bath units (one bathroom in each unit)
- Heating & cooling: Wood stove heating; Wall/window cooling units
- Interior features: Storage; Private entrances for units; Garden/play area
- Laundry & utility: Washer; Dryer
Neighborhood map
What this means for you Summary
Snapshot
- This is a 1×2bd/1ba + 2×1bd/1ba units multifamily listed at $369k.
Deal economics
- At list price, monthly cash flow is $787 ($9k/yr) — positive. Per door: $262/mo.
- The deal already cash-flows at list — no discount required.
- Meets the 1% rule at list price ($4k rent vs $369k).
- Recommended offer: $325k (12.0% below list) — sets the bar for market timing.
- Cap rate 8.9% vs local median 2.6% in Phoenix Lake — top-decile yield for the area; either an underpriced asset or a hidden risk that comps aren't pricing in. Stress-test before assuming the spread holds.
Location & tenants
- Location reads 50/100 on livability (#1,105 in CA) — a working-class tenant base; expect higher turnover. Strengths: crime B; Watch: schools D, amenities F, commute F.
- Belleview Elementary (rural): math 20% / reading 35% proficiency, ranked #1,087 of 1,400 in CA (top 78%) — low school quality limits family demand, transient renter base, plan for 1-2y turnover.
- Market conditions: 299 active listings in the ZIP; 60 units permitted in Tuolumne County in 2024 (0 in 5+ unit buildings).
Forward outlook
- Local home prices are declining (-3.0%/yr); year-one equity from $3k of loan paydown is wiped out by about $11k of value loss. Plan a longer hold.
- Tuolumne County population projected at -15% by 2050 — secular population decline; favor cash flow + early exit over multi-decade hold.
Negotiation context
- It's been on market 129 days — a 12% lower offer ($325k) is reasonable based on typical stale-listing flexibility.
Risks & watch-outs
- Climate carrying-cost: severe wildfire risk — expect insurance premiums to compound above CPI over the hold.
Questions for the listing agent
- It's been on market 129 days. Have you received any prior offers? Is the seller open to a 12% concession, seller financing, or rate buy-down credit?
- Can we see the unit-by-unit rent roll, current vacancy, and any below-market leases? What's the average tenancy length?
- What capital expenditures (roof, boiler, parking lot, exteriors) have been made in the last 5 years, and what's planned in the next 2?
- Why hasn't it sold? Are there any deal-killer items the seller is aware of (foundation, flood, title, zoning, code violations)?
- Is there a deadline driving the sale (1031 exchange, divorce, estate, relocation)? That informs how much negotiation room exists.
- Schools are D-rated, which usually means shorter tenancies and higher turnover. Who's the typical renter profile here, and what's been the actual vacancy rate?
- What's the average days-on-market for RENTAL listings here right now (not sales)? A rising rental-DOM trend means longer vacancies and softer asking-rent achievability than the comps imply.
- What's the recent tenant-quality profile in this submarket — average credit score on applications, eviction rate, late-payment / NSF rate, and stable-employment percentage? A property-management company in the area should have these aggregated.
- How much new apartment / multifamily construction is in the pipeline within 1–3 miles? Heavy new supply (>2% of stock underway) typically softens rents 12–24 months out; light construction supports rent growth.
Investment metrics
- 1% rule
- 1.14% ✓
- Cap rate
- 8.85%
- Cash-on-cash
- 9.14%
- DSCR
- 1.41
- GRM
- 7.3
CMA / ARV
No comps found within radius.
Projected returns pro-forma
-3.0% appreciation · 3.0% rent growth · sell at horizon
- IRR
- -2.5%
- Equity multiple
- 0.91×
- Total profit
- $-9,613
- Equity at exit
- $55,019
- IRR
- 7.2%
- Equity multiple
- 1.55×
- Total profit
- $56,422
- Equity at exit
- $31,904
Cash invested: $103,320 (down + closing). Projections, not guarantees.
Landlord ↔ Tenant lean methodology
- Overall (STATE)
- 18 Strongly Tenant-Friendly
- State California
- 18 Strongly Tenant-Friendly · D+13
- County
- — inherits STATE
- City
- — inherits STATE
ZIP-level market 95370
- Active inventory
- 299
- Price-to-rent
- 20.8×
Monthly cashflow live
- Estimated rent
- $4,224 medium interval (Pro) →
- Mortgage (P&I)
- −$1,935
- Tax est. 1.5%
- −$461 /mo · $5,535/yr
- Insurance
- −$154
- HOA
- −$0
- Vacancy / Maint / Mgmt
- −$887
- Net cashflow
- $787
Break-even live
3-unit breakdown (identical units grouped — click to expand)
| Units | Beds | Baths | Est. rent |
|---|---|---|---|
| 1× unit | 2 | 1 | $1,475 |
| 2× units | 1 | 1 | $2,750 |
| #2 | 1 | 1 | $1,375 |
| #3 | 1 | 1 | $1,375 |
| Total (3 units) | $4,224 | ||
UW: 25.0% down · 7.5% · 30yr · 1.5% tax · 5.0% vac · 8.0% maint · 8.0% mgmt
Financing live
Cash to close
- Down payment
- $92,250
- Closing costs
- $11,070
- Reserves months
- —
- Total cash needed
- —
Loan-product check · same deal, 3 products live
Conventional
25% down · 7.5% · 30yr
- Down + closing
- —
- Monthly P&I
- —
- Monthly cashflow
- —
- DSCR
- —
- Eligible?
- —
Personal DTI + credit; lowest rate.
DSCR
20% down · 8.5% · 30yr
- Down + closing
- —
- Monthly P&I
- —
- Monthly cashflow
- —
- DSCR
- —
- Eligible?
- —
No personal income docs; deal must DSCR.
Hard money
10% down · 12.0% · 12mo
- Down + closing
- —
- Monthly P&I
- —
- Monthly cashflow
- —
- DSCR
- —
- Eligible?
- —
Short-term bridge; refi at stabilization.
Listing history 18 events
-
2026-06-19days on market $369,000 Active 129 DOM
-
2026-06-18days on market $369,000 Active 128 DOM
-
2026-06-17days on market $369,000 Active 127 DOM
-
2026-06-16days on market $369,000 Active 126 DOM
-
2026-06-15days on market $369,000 Active 125 DOM
-
2026-06-14days on market $369,000 Active 123 DOM
-
2026-06-12days on market $369,000 Active 122 DOM
-
2026-06-10days on market $369,000 Active 120 DOM
-
2026-06-09days on market $369,000 Active 119 DOM
-
2026-06-08days on market $369,000 Active 118 DOM
-
2026-06-07days on market $369,000 Active 117 DOM
-
2026-06-05days on market $369,000 Active 114 DOM
-
2026-06-03days on market $369,000 Active 113 DOM
-
2026-06-02days on market $369,000 Active 112 DOM
-
2026-06-01days on market $369,000 Active 111 DOM
-
2026-05-31days on market $369,000 Active 110 DOM
-
2026-05-30days on market $369,000 Active 109 DOM
-
2026-02-10$389,000 Active
ⓘ Source: listings_history table (triggers on properties + properties_extension) + one-shot
backfill from property_details.listing_events for pre-trigger history.
Climate risk First Street
- Flood 1/10 Low FEMA zone X (unshaded) · 0% chance over 30 yrs
- Wildfire 9/10 Extreme
- Heat 3/10 Moderate
- Wind 1/10 Low
- Air quality 10/10 Extreme 29 unhealthy d/yr today · 33 by 30 yrs out
Nearby sold comps map
Loading sold comps map…
Walkable amenities ~0.75 mi
Loading nearby amenities…
Taxation est. · year 1
- Rental income
- $50,688
- − Mortgage interest
- −$20,670
- − Property taxes
- −$5,535
- − Insurance
- −$1,845
- − Repairs & maintenance
- −$4,055
- − Management
- −$4,055
- − Depreciation
- −$10,735
- Taxable income
- $3,794
- Est. tax owed @ 24.0%
- −$910
- After-tax cash flow
- $8,532/yr
For passive investors: Depreciation is non-cash, so a rental often shows a tax loss while cash-flowing — sheltering income. Rental losses are passive: they offset passive income freely, and up to $25,000/yr can offset ordinary (W-2) income if you actively participate and your MAGI is under $100k (phasing out to $0 by $150k); unused losses carry forward. On sale, claimed depreciation is recaptured at up to 25%, and gains may owe capital-gains tax (a 1031 exchange can defer both). Figures are a year-1 estimate at your 24.0% rate — not tax advice; consult a CPA.
Schools (NCES district)
- District
- Belleview Elementary
- NCES district ID
- 0604500
- Math proficiency
- 20% ▬ 0.00%
- Reading proficiency
- 35% ▼ -10.00%
- Median HH income
- $53,472
- Composite
- 27.37/100
- National rank
- #12405
- State rank
- #1087 of 1400 in CA
Livability — Phoenix Lake
- Score
- 50/100
- State rank
- #1105
- US rank
- #25551
Category grades
Schools grade is shown separately in the Schools card above.
Census & demographics
- Population (ZIP)
- 28,373
Population outlook (Tuolumne County) Hauer SSP2
- Today (2025)
- 50,349 people
- By 2030
- 48,708 · -3.3%
- By 2040
- 45,284 · -10.1%
- By 2050
- 42,575 · -15.4%
- By 2075
- 36,827 · -26.9%
- By 2100
- 30,369 · -39.7%
Race, ethnicity, and origin ACS 2023
- Neighborhood character
- Predominantly White (82%)
- Race & ethnicity
- White 82% Hispanic / Latino 11% Two or more races 9% Asian 1% Native American 1%
- Hispanic origin (detail)
- Mexican 7% Puerto Rican 1%
- Common ancestry
- Italian 5% Russian 4% Slovak 3%
- Foreign-born
- 5% · Canada
- Languages at home
- 95% English-only · Spanish 3%
Political lean MEDSL · Tuolumne
- 2024 margin
- Strong R (+21.9) · D 37.9% · R 59.7% · Other 2.4%
- 2008→2024 swing
- -9.2pp toward R · 2008: -12.7pp · 2024: -21.9pp
- All cycles
- 2024: R+21.9 2020: R+18.8 2016: R+20.9 2012: R+15.9 2008: R+12.7
Not yet ingested
- Civics
- —
Market trends
- HPI YoY
- ▼ -322.67%
- Current HPI
- 130.9637
- Rent YoY
- —
- Metro
- —
- State GDP YoY
- ▲ 3.21%
- F500 in state
- 116
Industry mix (Fortune 500 HQ in CA)
| Industry | F500 HQs | Revenue |
|---|---|---|
| Technology | 27 | $1,492B |
|
||
| Financial Services | 3 | $174B |
|
||
| Retail | 3 | $44B |
|
||
| Insurance | 3 | $26B |
|
||
| Media / Entertainment | 2 | $115B |
|
||
| Pharmaceuticals / Biotech | 2 | $62B |
|
||
Price history
1 event — show timeline
- 2026-02-10 Listed $389,000 bridgeMLS, Bay East AOR, or Contra Costa AOR
Cash-flow waterfall
monthlySold comps — $/sqft
last 12 mo · ≤1 miLoading sold comps…