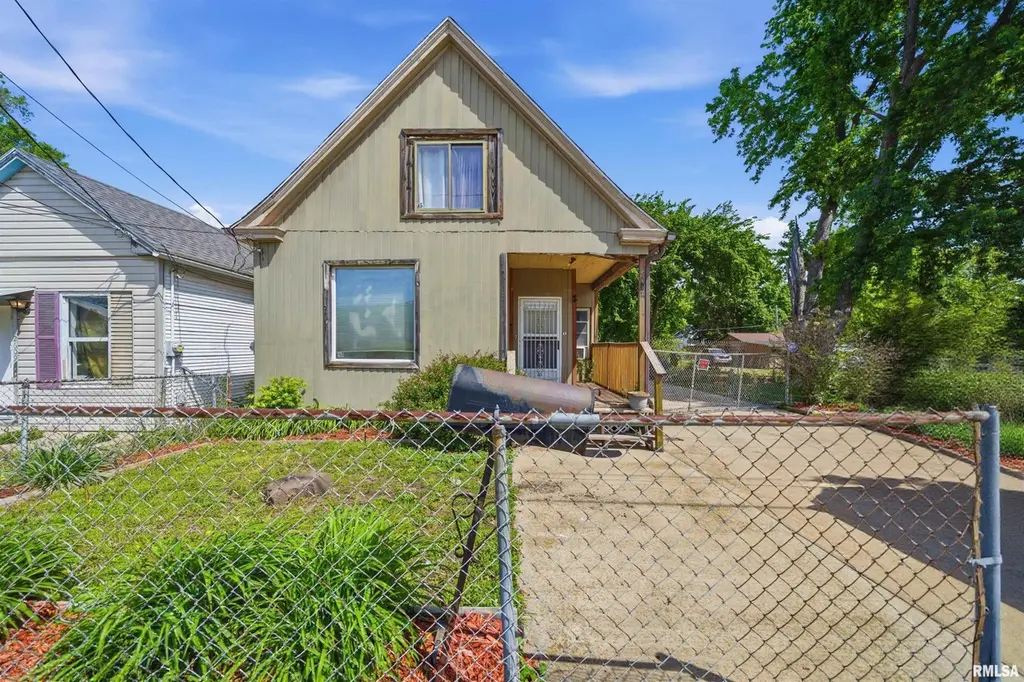
2607 W Lincoln Ave · Peoria, IL
Flood risk 1/10 · Minimal
- FEMA flood zone
- X
- Chance of flooding over 30 yrs
- 0.0%
- Est. flood insurance / yr
- $473 – $860
Fire risk 1/10 · Minimal
- Est. fire insurance / yr
- $804 – $1,492
Heat risk 3/10 · Minor
- Hot days now (above 105°F)
- 7 days/yr
- Hot days in 30 yrs
- 18 days/yr
Wind risk 2/10 · Minimal
- Chance of severe wind over 30 yrs
- 1.0%
Air-quality risk 3/10 · Minor
- Unhealthy air days now
- 1 days/yr
- Unhealthy air days in 30 yrs
- 3 days/yr
Risk factors via First Street. Map © Google.
Why this score? — see what drove the B grade
The composite is a weighted blend of 9 inputs, each scored 0–100. Each bar is that input's sub-score; the figure is the points it added to the 100-point composite (weight × sub-score).
- Cash flow +30.0/30.0
- 1% rule +10.0/10.0
- DSCR +10.0/10.0
- ARV discount +7.5/15.0
- Appreciation +5.3/10.0
- Livability +3.7/5.0
- Rent growth +2.5/5.0
- Condition / age +2.5/5.0
- Schools +1.1/10.0
$47,900
🖨 Deal sheet (PDF) 📄 Offer letter ✓ Due diligence
Listing remarks
Great opportunity for a first time home buyer or to add to your investment portfolio. Well maintained 3 bedroom, 2 full bathroom on a large fenced lot. Spacious living room features large picture window and newer carpet. Dining space has new laminate flooring and enough room for hosting gatherings. Laundry hookups have been moved to main floor for convenience. Relax and unwind on the covered back porch complete with a wet bar. Plenty of room for parking or outdoor activities, come take a look today!
Key facts
- 9,147 sq ft lot
- Parking
- Built 1930
Property features AI
Finance
- HOA & community: No association fee
Exterior
- Parking: Paved parking pad
- Utilities: Public water; Septic system; Public power
- Home design: Single family residence; Built in 1930
- Construction: Shingle roof; 1930 construction
- Exterior features: Fenced yard; Level lot; Paved road access; Back porch (additional room listed as back porch)
Interior
- Kitchen: Dishwasher; Refrigerator; Tile kitchen floor
- Bedrooms: Three bedrooms (two upper level bedrooms; one main level bedroom)
- Flooring: Carpet in bedrooms and additional room; Laminate in dining area; Tile in kitchen
- Bathrooms: Two full bathrooms
- Heating & cooling: Forced air heating; Central air conditioning
- Interior features: Attic storage; Cable available; Partial, unfinished basement; Basement has egress window
- Laundry & utility: Gas water heater
Neighborhood map
What this means for you Summary
Snapshot
- This is a 2-bed/1.0-bath single-family listed at $48k.
Deal economics
- At list price, monthly cash flow is $542 ($7k/yr) — positive.
- The deal already cash-flows at list — no discount required.
- Meets the 1% rule at list price ($1k rent vs $48k).
- Recommended offer: $46k (3.0% below list) — sets the bar for market timing.
- Cap rate 19.9% vs local median 5.6% in Peoria — top-decile yield for the area; either an underpriced asset or a hidden risk that comps aren't pricing in. Stress-test before assuming the spread holds.
Location & tenants
- Location reads 73/100 on livability (#270 in IL) — a middle-class / working-renter tenant base. Strengths: commute A+, cost of living A+, housing A+; Watch: employment D+, crime F.
- Peoria SD 150 (urban): math 11% / reading 14% proficiency, ranked #554 of 620 in IL (top 89%) — low school quality limits family demand, transient renter base, plan for 1-2y turnover; 70% free/reduced lunch — lower-income household profile, screen leases tightly.
- Zoned schools: Manual High School (math 2% / reading 2%, grade F, #659 of 693 statewide, top 100%, 656 students, 0% FRL) — zoned schools average 0% FRL vs 70% district-wide (70 pts lower); this property's tenant base skews higher-income than the district average.
- Market conditions: 42 active listings in the ZIP; 20 comparable units currently listed for rent nearby; rentals at typical pace (median 14d on market — plan ~3-4 weeks tenant-placement turnaround); lower-income renter base — watch delinquency; 73 units permitted in Peoria County in 2024 (0 in 5+ unit buildings).
- At $1,076/mo this rent would consume 49% of the median local household income ($26k/yr) (locally 1385% of renters already pay >50% of income on rent) — very limited rent-growth headroom before tenants either downsize or default.
Forward outlook
- In year one you build about $634 of equity ($331 loan paydown + $303 appreciation (0.6% local appreciation)).
- Peoria County population projected at -11% by 2050 — secular population decline; favor cash flow + early exit over multi-decade hold.
- At projected returns (0.6% appreciation + 3.0% rent growth), your $13k cash investment doubles in ~2 years — after that, you're playing with house money.
Negotiation context
- It's been on market 43 days — a 3% lower offer ($46k) is reasonable based on typical stale-listing flexibility.
- 2 sale attempts since 17y ago with the ask held roughly flat each time — persistent listings suggest the price (not the market) is what's stuck; bring a comps-based counter.
- Current owner paid $11k; list at $48k implies a 335% gain — meaningful room to come down on a strong offer.
Risks & watch-outs
- Watch-outs: built in 1930 — expect roof / HVAC / electrical / plumbing capex.
Questions for the listing agent
- It's been on market 43 days. Have you received any prior offers? Is the seller open to a 3% concession, seller financing, or rate buy-down credit?
- Built in 1930 — when were the roof, HVAC, electrical panel, plumbing, and water heater last replaced?
- Is there a deadline driving the sale (1031 exchange, divorce, estate, relocation)? That informs how much negotiation room exists.
- Schools are F-rated, which usually means shorter tenancies and higher turnover. Who's the typical renter profile here, and what's been the actual vacancy rate?
- Crime grade is F in this area — have there been break-ins, vandalism, or insurance claims at this property in the last 3 years? What carrier currently insures it and at what premium?
- What's the average days-on-market for RENTAL listings here right now (not sales)? A rising rental-DOM trend means longer vacancies and softer asking-rent achievability than the comps imply.
- What's the recent tenant-quality profile in this submarket — average credit score on applications, eviction rate, late-payment / NSF rate, and stable-employment percentage? A property-management company in the area should have these aggregated.
- How much new for-sale + rental construction is in the pipeline within 1–3 miles? Heavy new supply typically softens prices + rents 12–24 months out; constrained supply supports both.
Investment metrics
- 1% rule
- 2.25% ✓
- Cap rate
- 19.88%
- Cash-on-cash
- 48.52%
- DSCR
- 3.16
- GRM
- 3.7
CMA / ARV
- ARV (median comp)
- $27,809
- List price
- $47,900
- Delta
- 72.25%
- Verdict
- OVERPRICED
- Comps
- 20 within 1.0 mi
Show comp detail 12 sales within ~0.75 mi
| Address | Dist | Beds/Ba | Sqft | Sold | Price | $/sf | Match |
|---|---|---|---|---|---|---|---|
| 2123 W Antoinette St | 0.43mi | 2/1.0 | 1,036 (-3%) | 1mo | $22,000 | $21 | 75 |
| 2320 W Garden St | 0.46mi | 2/1.0 | 1,096 (+3%) | 3mo | $20,000 | $18 | 71 |
| 2115 W Proctor St | 0.42mi | 3/1.0 (+1) | 1,050 (-1%) | 5mo | $5,900 | $6 | 69 |
| 907 S Manual Ave | 0.33mi | 3/2.0 (+1) | 1,084 (+2%) | 6mo | $103,900 | $96 | 68 |
| 2722 W Marquette St | 0.36mi | 3/1.0 (+1) | 1,008 (-5%) | 6mo | $35,000 | $35 | 64 |
| 3021 W Malone St | 0.57mi | 2/1.0 | 1,000 (-6%) | 1mo | $17,000 | $17 | 62 |
| 2027 W Malone Ave | 0.62mi | 3/1.0 (+1) | 1,079 (+1%) | 4mo | $27,000 | $25 | 60 |
| 2802 W Malone St | 0.49mi | 3/1.0 (+1) | 1,180 (+11%) | 2mo | $39,900 | $34 | 52 |
| 2000 W Antoinette St | 0.56mi | 2/1.0 | 924 (-13%) | 2mo | $57,500 | $62 | 50 |
| 2507 W Moss Ave | 0.62mi | 2/1.0 | 944 (-11%) | 3mo | $120,000 | $127 | 50 |
| 3135 W Starr St | 0.73mi | 3/1.0 (+1) | 960 (-10%) | 1mo | $100,000 | $104 | 44 |
| 2506 W Humboldt St | 0.65mi | 3/1.0 (+1) | 908 (-15%) | 2mo | $10,000 | $11 | 38 |
Match score weights: distance 35% · size 25% · config 20% · recency 20%. Top-matched comps best support the ARV.
Projected returns pro-forma
0.63% appreciation · 3.0% rent growth · sell at horizon
- IRR
- 50.7%
- Equity multiple
- 3.58×
- Total profit
- $34,580
- Equity at exit
- $15,443
- IRR
- 52.7%
- Equity multiple
- 7.16×
- Total profit
- $82,552
- Equity at exit
- $19,837
Cash invested: $13,412 (down + closing). Projections, not guarantees.
Landlord ↔ Tenant lean methodology
- Overall (STATE)
- 43 Moderately Tenant-Leaning
- State Illinois
- 43 Moderately Tenant-Leaning · D+7
- County
- — inherits STATE
- City
- — inherits STATE
ZIP-level market 61605
- Home prices YoY
- 0.4%
- Active inventory
- 42
- Price-to-rent
- 3.7×
Monthly cashflow live
- Estimated rent
- $1,076 high interval (Pro) →
- Mortgage (P&I)
- −$251
- Tax from tax record
- −$37 /mo · $443/yr
- Insurance
- −$20
- HOA
- −$0
- Vacancy / Maint / Mgmt
- −$226
- Net cashflow
- $542
Break-even live
Sensitivity live
| Price | -10% $569 | -5% $556 | +0% $542 | +5% $529 | +10% $515 |
|---|---|---|---|---|---|
| Rent | -10% $457 | -5% $500 | +0% $542 | +5% $585 | +10% $627 |
| Rate | -1.0pp $566 | -0.5pp $554 | base $542 | +0.5pp $530 | +1.0pp $517 |
UW: 25.0% down · 7.5% · 30yr · 1.5% tax · 5.0% vac · 8.0% maint · 8.0% mgmt
Financing live
Cash to close
- Down payment
- $11,975
- Closing costs
- $1,437
- Reserves months
- —
- Total cash needed
- —
Loan-product check · same deal, 3 products live
Conventional
25% down · 7.5% · 30yr
- Down + closing
- —
- Monthly P&I
- —
- Monthly cashflow
- —
- DSCR
- —
- Eligible?
- —
Personal DTI + credit; lowest rate.
DSCR
20% down · 8.5% · 30yr
- Down + closing
- —
- Monthly P&I
- —
- Monthly cashflow
- —
- DSCR
- —
- Eligible?
- —
No personal income docs; deal must DSCR.
Hard money
10% down · 12.0% · 12mo
- Down + closing
- —
- Monthly P&I
- —
- Monthly cashflow
- —
- DSCR
- —
- Eligible?
- —
Short-term bridge; refi at stabilization.
Rent comps 20 comps
| Address | Beds | Baths | Sqft | Rent | $/sqft | DOM | Units | Dist |
|---|---|---|---|---|---|---|---|---|
| 2807 W Howett St Peoria, IL | 3.0 | 2.0 | 1388 | $1,550 | $1.12 | 44d | 1 | 0.05mi |
| 2317 W Martin Luther King Junior Dr Unit 2-214 Peoria, IL | 2.0 | 1.0 | 807 | $800 | $0.99 | 44d | 1 | 0.30mi |
| 2317 W Martin Luther King Junior Dr Peoria, IL | 1.0–2.0 | 1.0 | 697 | $800 | $1.15 | 14d | 3 | 0.30mi |
| 3001 W Wiswall St Peoria, IL | 2.0 | 1.0 | 1000 | $1,100 | $1.10 | 14d | 1 | 0.33mi |
| 2822 W Antoinette St Peoria, IL | 2.0 | 1.0 | 720 | $1,149 | $1.60 | 22d | 1 | 0.37mi |
| 3031 W Wiswall St Peoria, IL | 2.0 | 1.0 | 1100 | $1,100 | $1.00 | 14d | 1 | 0.41mi |
| 2116 W Proctor St Peoria, IL | 2.0 | 1.0 | 912 | $879 | $0.96 | 14d | 1 | 0.43mi |
| 2320 W Garden St Peoria, IL | 2.0 | 1.0 | 1096 | $1,000 | $0.91 | 44d | 1 | 0.48mi |
| 906 S Tonti Cir Peoria, IL | 2.0 | 1.0 | 780 | $950 | $1.22 | 14d | 1 | 0.50mi |
| 2804 W Humboldt St Peoria, IL | 3.0 | 1.0 | 1060 | $995 | $0.94 | 14d | 1 | 0.70mi |
| 1507 S Livingston St Peoria, IL | 2.0 | 1.0 | 842 | $946 | $1.12 | 44d | 1 | 0.76mi |
| 928 S Matthew St Peoria, IL | 2.0 | 1.0 | 1080 | $748 | $0.69 | 14d | 1 | 0.82mi |
| 1540 W Kettelle St Peoria, IL | 3.0 | 1.0 | 1001 | $748 | $0.75 | 14d | 1 | 0.85mi |
| 945 S Shelley St Peoria, IL | 1.0–3.0 | 1.0–2.0 | 929 | $910 | $0.98 | 14d | 1 | 0.91mi |
| 2601 W Kenwood Ave West Peoria, IL | 3.0 | 1.5 | 1405 | $1,500 | $1.07 | 14d | 1 | 1.03mi |
| 1825 S Kneer Ave Peoria, IL | 2.0 | 1.0 | 858 | $858 | $1.00 | 14d | 1 | 1.07mi |
| 1401 W Adrian G Hinton Ave Peoria, IL | 2.0 | 1.0 | 1100 | $775 | $0.70 | 44d | 1 | 1.13mi |
| 1220 W John H Gwynn Jr Ave Peoria, IL | 2.0 | 1.0 | 853 | $745 | $0.87 | 22d | 1 | 1.22mi |
| 2916 W Meidroth St Peoria, IL | 2.0 | 1.0 | 1125 | $1,049 | $0.93 | 22d | 1 | 1.22mi |
| 1019 N Farmington Rd Unit 1017 Peoria, IL | 3.0 | 1.0 | 1304 | $1,600 | $1.23 | 44d | 1 | 1.45mi |
Listing history 22 events
-
2026-06-19days on market $47,900 Active 43 DOM
-
2026-06-18days on market $47,900 Active 42 DOM
-
2026-06-17days on market $47,900 Active 41 DOM
-
2026-06-16days on market $47,900 Active 40 DOM
-
2026-06-15days on market $47,900 Active 39 DOM
-
2026-06-14days on market $47,900 Active 37 DOM
-
2026-06-13days on market $47,900 Active 36 DOM
-
2026-06-10days on market $47,900 Active 34 DOM
-
2026-06-09days on market $47,900 Active 33 DOM
-
2026-06-08days on market $47,900 Active 32 DOM
-
2026-06-07pricedays on market $47,900 Active 31 DOM
-
2026-06-03days on market $49,900 Active 27 DOM
-
2026-06-02days on market $49,900 Active 26 DOM
-
2026-06-01days on market $49,900 Active 25 DOM
-
2026-05-31days on market $49,900 Active 24 DOM
-
2026-05-30days on market $49,900 Active 23 DOM
-
2026-05-06$49,900 Active 504-char remark
-
2021-08-06historical
-
2021-08-06historical
-
2010-01-18soldstatus $11,000
-
2009-09-22$11,900
-
2005-09-30soldstatus $312,500
ⓘ Source: listings_history table (triggers on properties + properties_extension) + one-shot
backfill from property_details.listing_events for pre-trigger history.
Tax reassessment forecast IL · Partial reset (capped growth)
- Current annual tax
- $443 · $37/mo
- Projected year-2 tax
- $765 · $64/mo
- Expected delta
- +$322/yr (+$27/mo · 72.6%)
ⓘ Screening estimate from a state-policy table — verify with the county assessor before closing.
Climate risk First Street
- Flood 1/10 Low FEMA zone X · 0% chance over 30 yrs
- Wildfire 1/10 Low
- Heat 3/10 Moderate 7 d/yr ≥105°F today · 18 d/yr by 30 yrs out
- Wind 2/10 Low 100% chance of damaging wind over 30 yrs
- Air quality 3/10 Moderate 1 unhealthy d/yr today · 3 by 30 yrs out
Nearby sold comps map
Loading sold comps map…
Walkable amenities ~0.75 mi
Loading nearby amenities…
Taxation est. · year 1
- Rental income
- $12,917
- − Mortgage interest
- −$2,683
- − Property taxes
- −$443
- − Insurance
- −$240
- − Repairs & maintenance
- −$1,033
- − Management
- −$1,033
- − Depreciation
- −$1,393
- Taxable income
- $6,091
- Est. tax owed @ 24.0%
- −$1,462
- After-tax cash flow
- $5,045/yr
For passive investors: Depreciation is non-cash, so a rental often shows a tax loss while cash-flowing — sheltering income. Rental losses are passive: they offset passive income freely, and up to $25,000/yr can offset ordinary (W-2) income if you actively participate and your MAGI is under $100k (phasing out to $0 by $150k); unused losses carry forward. On sale, claimed depreciation is recaptured at up to 25%, and gains may owe capital-gains tax (a 1031 exchange can defer both). Figures are a year-1 estimate at your 24.0% rate — not tax advice; consult a CPA.
Schools (NCES district)
- District
- Peoria SD 150
- NCES district ID
- 1731230
- Math proficiency
- 11% ▼ -5.00%
- Reading proficiency
- 14% ▼ -4.00%
- Median HH income
- $41,951
- Composite
- 10.92/100
- National rank
- #9751
- State rank
- #554 of 620 in IL
Livability — Peoria
- Score
- 73/100
- State rank
- #270
- US rank
- #5096
Category grades
Schools grade is shown separately in the Schools card above.
Census & demographics
- Census place
- Peoria, IL
- County
- Peoria County · 120,495 people
- City population
- 114,670
- Metro
- Peoria, IL
- Population (ZIP)
- 13,424
- Household income
- $26,392
- Rent vs Own
- Severe rent burden
- 1385.0
Population outlook (Peoria County) Hauer SSP2
- Today (2025)
- 183,007 people
- By 2030
- 179,643 · -1.8%
- By 2040
- 171,782 · -6.1%
- By 2050
- 163,508 · -10.7%
- By 2075
- 140,178 · -23.4%
- By 2100
- 114,493 · -37.4%
Race, ethnicity, and origin ACS 2023
- Neighborhood character
- Diverse neighborhood (Simpson 0.61)
- Race & ethnicity
- Black 56% White 27% Hispanic / Latino 12% Two or more races 7% Native American 1%
- Hispanic origin (detail)
- Mexican 8%
- Common ancestry
- Lithuanian 1% Iranian 1% Portuguese 1%
- Foreign-born
- 4% · Canada, Vietnam
- Languages at home
- 92% English-only · Spanish 7%
Political lean MEDSL · Peoria
- 2024 margin
- Toss-up / Even · D 51.5% · R 46.9% · Other 1.6%
- 2008→2024 swing
- -9.2pp toward R · 2008: 13.9pp · 2024: 4.7pp
- All cycles
- 2024: D+4.7 2020: D+6.3 2016: D+2.8 2012: D+4.4 2008: D+13.9
Not yet ingested
- Civics
- —
Market trends
- HPI YoY
- ▲ 0.63%
- Current HPI
- 170.5814
- Rent YoY
- —
- Metro
- Peoria, IL
- State GDP YoY
- ▲ 1.59%
- F500 in state
- 60
Industry mix (Fortune 500 HQ in IL)
| Industry | F500 HQs | Revenue |
|---|---|---|
| Insurance | 4 | $201B |
|
||
| Consumer Goods | 4 | $87B |
|
||
| Industrial Machinery | 3 | $64B |
|
||
| Healthcare | 2 | $55B |
|
||
| Retail / Pharmacy | 1 | $148B |
|
||
| Agriculture / Food | 1 | $86B |
|
||
Price history
-84.7% since first listed7 events — show timeline
- 2026-06-05 Price Changed $47,900 RMLSA as Distributed by MLS Grid
- 2026-05-06 Listed $49,900 RMLSA as Distributed by MLS Grid
- 2021-08-06 Listing Removed — RMLSA as Distributed by MLS Grid
- 2021-08-06 Listing Removed — RMLSA as Distributed by MLS Grid
- 2010-01-18 Sold (MLS) $11,000 RMLSA as Distributed by MLS Grid
- 2009-09-22 Listed $11,900 RMLSA as Distributed by MLS Grid
- 2005-09-30 Sold (Public Records) $312,500 Public Records
Property tax history
-0.2%/yrLatest (2025): $443 · -2.4% YoY. Source: county tax records.
Cash-flow waterfall
monthlySold comps — $/sqft
last 12 mo · ≤1 miLoading sold comps…