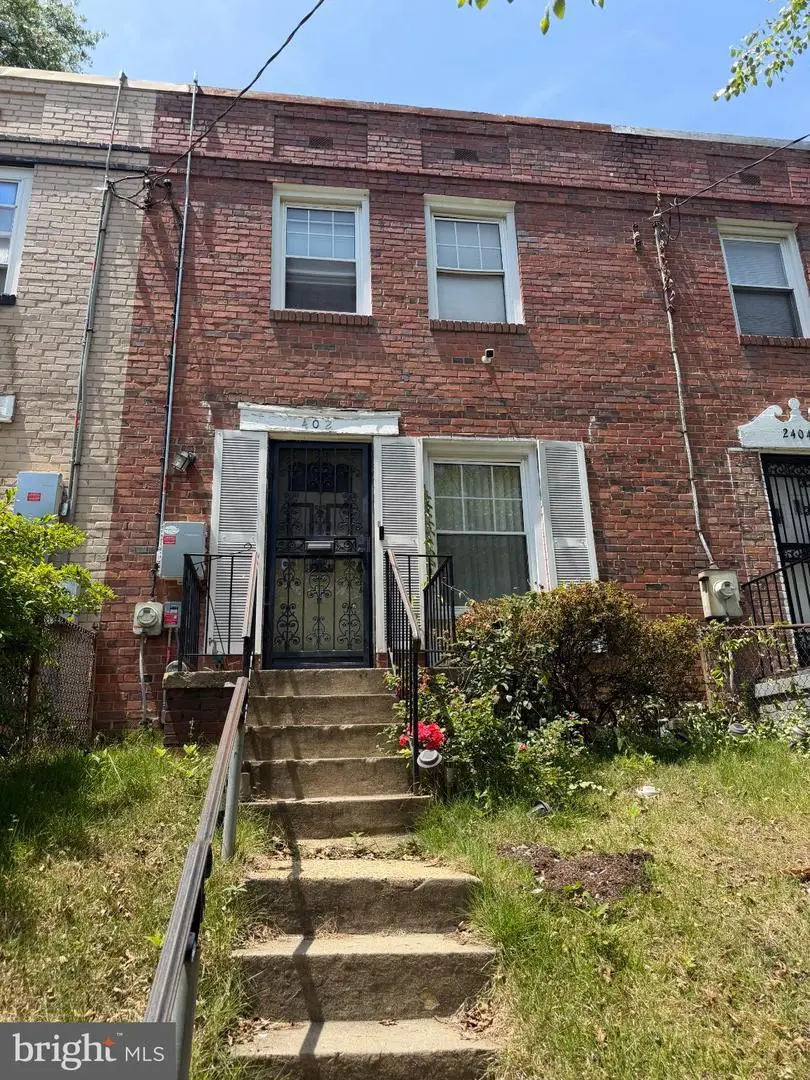
2402 Southern Ave SE · Washington, DC
Flood risk 1/10 · Minimal
- FEMA flood zone
- X (unshaded)
- Chance of flooding over 30 yrs
- 0.0%
- Est. flood insurance / yr
- $473 – $860
Fire risk 1/10 · Minimal
- Est. fire insurance / yr
- $631 – $1,173
Heat risk 7/10 · Major
- Hot days now (above 103°F)
- 7 days/yr
- Hot days in 30 yrs
- 16 days/yr
Wind risk 4/10 · Minor
- Chance of severe wind over 30 yrs
- 21.0%
Air-quality risk 3/10 · Minor
- Unhealthy air days now
- 2 days/yr
- Unhealthy air days in 30 yrs
- 3 days/yr
Risk factors via First Street. Map © Google.
Why this score? — see what drove the B- grade
The composite is a weighted blend of 9 inputs, each scored 0–100. Each bar is that input's sub-score; the figure is the points it added to the 100-point composite (weight × sub-score).
- Cash flow +25.0/30.0
- ARV discount +15.0/15.0
- DSCR +8.1/10.0
- 1% rule +5.8/10.0
- Livability +3.7/5.0
- Schools +3.6/10.0
- Rent growth +3.5/5.0
- Condition / age +2.5/5.0
- Appreciation +0.0/10.0
$199,000
🖨 Deal sheet 📄 Offer letter ✓ Due diligence
Listing remarks
Discover the potential of this charming brick townhouse in the heart of Southeast Washington, DC! Whether you're an investor seeking your next value-add opportunity or a buyer ready to create your dream home, 2402 Southern Ave SE offers endless possibilities in a rapidly growing and well-connected neighborhood. Featuring a traditional floor plan, private fenced backyard, and classic rowhome character, this property presents an excellent opportunity to build equity and personalize a home in one of DC's evolving communities. Ideally located in the Shipley Terrace area, residents enjoy convenient access to shopping, dining, grocery stores, recreation centers, and everyday conveniences. Just mi
Key facts
- Brick townhouse
- Built 1947
- Listed 12 days
Tags
Property features AI
Finance
- Other: Property condition listed as average; Pets allowed with no restrictions
Exterior
- Parking: On-street parking
- Utilities: Public water; Public sewer; No municipal trash
- Home design: Interior townhouse/rowhouse; Ownership: Fee simple
- Construction: Brick construction; Block foundation; Above-grade and below-grade structures; Year built estimated
- Exterior features: Chain link and privacy fencing; Not in a federal flood zone; Ground rent paid annually
Interior
- Bedrooms: Three bedrooms on the upper level
- Bathrooms: Two full bathrooms (one on upper level, one on lower level)
- Heating & cooling: Central heating (forced air) fueled by natural gas; Central air conditioning (electric); Natural gas hot water
- Interior features: Estimated living area; Full, fully finished basement
Neighborhood map
What this means for you Summary
Snapshot
- This is a 3-bed/1.0-bath townhouse listed at $199k.
Deal economics
- At list price, monthly cash flow is $431 ($5k/yr) — positive.
- The deal already cash-flows at list — no discount required.
- Meets the 1% rule at list price ($2k rent vs $199k).
- Cap rate 8.9% vs local median 2.5% in Washington — top-decile yield for the area; either an underpriced asset or a hidden risk that comps aren't pricing in. Stress-test before assuming the spread holds.
Location & tenants
- Location reads 73/100 on livability (#1 in DC) — a middle-class / working-renter tenant base. Strengths: amenities A+, commute A+, employment A+; Watch: crime F, cost of living F.
- District Of Columbia Public Schools (urban): math 33% / reading 40% proficiency, ranked #8 of 32 in DC (top 25%) — families likely to look elsewhere, expect single-tenant / working-renter base with shorter leases; 65% free/reduced lunch — lower-income household profile, screen leases tightly.
- Market conditions: Rents rising (+3.9%/yr); 296 active listings in the ZIP; 40 comparable units currently listed for rent nearby; rentals at typical pace (median 25d on market — plan ~3-4 weeks tenant-placement turnaround); 1,737 units permitted in District of Columbia in 2024 (1,506 in 5+ unit buildings).
- At $2,144/mo this rent would consume 48% of the median local household income ($54k/yr) (locally 5148% of renters already pay >50% of income on rent) — very limited rent-growth headroom before tenants either downsize or default.
Forward outlook
- Local home prices are declining (-3.0%/yr); year-one equity from $1k of loan paydown is wiped out by about $6k of value loss. Plan a longer hold.
- District of Columbia County population projected at +50% by 2050 — long-run rental-demand tailwind backs the buy-and-hold thesis.
Negotiation context
- Only 13 days on market — expect competitive offers; lowballing is unlikely to land.
Risks & watch-outs
- Watch-outs: built in 1947 — expect roof / HVAC / electrical / plumbing capex.
- Climate carrying-cost: extreme-heat days projected 7→16/yr by 2055 (HVAC capex compounding) — expect insurance premiums to compound above CPI over the hold.
Questions for the listing agent
- Built in 1947 — when were the roof, HVAC, electrical panel, plumbing, and water heater last replaced?
- Is there a deadline driving the sale (1031 exchange, divorce, estate, relocation)? That informs how much negotiation room exists.
- Crime grade is F in this area — have there been break-ins, vandalism, or insurance claims at this property in the last 3 years? What carrier currently insures it and at what premium?
- What's the average days-on-market for RENTAL listings here right now (not sales)? A rising rental-DOM trend means longer vacancies and softer asking-rent achievability than the comps imply.
- What's the recent tenant-quality profile in this submarket — average credit score on applications, eviction rate, late-payment / NSF rate, and stable-employment percentage? A property-management company in the area should have these aggregated.
- How much new for-sale + rental construction is in the pipeline within 1–3 miles? Heavy new supply typically softens prices + rents 12–24 months out; constrained supply supports both.
Investment metrics
- 1% rule
- 1.08% ✓
- Cap rate
- 8.89%
- Cash-on-cash
- 9.29%
- DSCR
- 1.41
- GRM
- 7.7
CMA / ARV
- ARV (on-the-fly)
- $315,392
- Comps found
- 12
Show comp detail 12 sales within ~0.75 mi
| Address | Dist | Beds/Ba | Sqft | Sold | Price | $/sf | Match |
|---|---|---|---|---|---|---|---|
| 3474 23rd St SE | 0.07mi | 2/2.0 (-1) | 1,002 (-2%) | 1mo | $173,850 | $174 | 83 |
| 3453 23rd St SE | 0.09mi | 3/2.0 | 1,024 (0%) | 17mo | $419,000 | $409 | 78 |
| 3321 18th Pl SE | 0.42mi | 2/2.0 (-1) | 1,006 (-2%) | 1mo | $310,000 | $308 | 68 |
| 2727 Bellbrook St | 0.61mi | 4/2.0 (+1) | 988 (-4%) | 1mo | $380,000 | $385 | 56 |
| 3435 24th St SE | 0.09mi | 3/2.0 | 1,150 (+12%) | 18mo | $390,000 | $339 | 56 |
| 2713 Bellbrook St | 0.56mi | 3/1.5 | 988 (-4%) | 16mo | $300,000 | $304 | 53 |
| 2235 Afton St | 0.32mi | 3/2.0 | 1,128 (+10%) | 15mo | $320,000 | $284 | 51 |
| 3508 Dixon St | 0.38mi | 3/1.5 | 1,128 (+10%) | 17mo | $279,850 | $248 | 50 |
| 2917 Oxon Park St | 0.72mi | 4/2.0 (+1) | 988 (-4%) | 8mo | $343,000 | $347 | 45 |
| 2813 Oxon Park St | 0.63mi | 4/2.0 (+1) | 988 (-4%) | 15mo | $375,000 | $380 | 43 |
| 2805 Terrace Rd SE Unit 408B | 0.73mi | 2/1.0 (-1) | 932 (-9%) | 19mo | $87,100 | $93 | 30 |
| 1456 Congress Pl SE | 0.72mi | 2/2.0 (-1) | 1,150 (+12%) | 18mo | $214,000 | $186 | 22 |
Match score weights: distance 35% · size 25% · config 20% · recency 20%. Top-matched comps best support the ARV.
Projected returns pro-forma
-3.0% appreciation · 3.86% rent growth · sell at horizon
- IRR
- -1.4%
- Equity multiple
- 0.95×
- Total profit
- $-2,953
- Equity at exit
- $29,672
- IRR
- 9.1%
- Equity multiple
- 1.73×
- Total profit
- $40,453
- Equity at exit
- $17,206
Cash invested: $55,720 (down + closing). Projections, not guarantees.
Landlord ↔ Tenant lean methodology
- Overall (CITY)
- 0 Strongly Tenant-Friendly
- State District of Columbia
- 12 Strongly Tenant-Friendly · D+43
- County
- — inherits STATE
- City Washington
- 0 Strongly Tenant-Friendly · D+43
ZIP-level market 20020
- Rents YoY
- 3.9%
- Active inventory
- 296
- Price-to-rent
- 7.7×
Monthly cashflow live
- Estimated rent
- $2,144 high interval (Pro) →
- Mortgage (P&I)
- −$1,044
- Tax from tax record
- −$137 /mo · $1,638/yr
- Insurance
- −$83
- HOA
- −$0
- Vacancy / Maint / Mgmt
- −$450
- Net cashflow
- $431
Break-even live
UW: 25.0% down · 7.5% · 30yr · 1.5% tax · 5.0% vac · 8.0% maint · 8.0% mgmt
Financing live
Cash to close
- Down payment
- $49,750
- Closing costs
- $5,970
- Reserves months
- —
- Total cash needed
- —
Loan-product check · same deal, 3 products live
Conventional
25% down · 7.5% · 30yr
- Down + closing
- —
- Monthly P&I
- —
- Monthly cashflow
- —
- DSCR
- —
- Eligible?
- —
Personal DTI + credit; lowest rate.
DSCR
20% down · 8.5% · 30yr
- Down + closing
- —
- Monthly P&I
- —
- Monthly cashflow
- —
- DSCR
- —
- Eligible?
- —
No personal income docs; deal must DSCR.
Hard money
10% down · 12.0% · 12mo
- Down + closing
- —
- Monthly P&I
- —
- Monthly cashflow
- —
- DSCR
- —
- Eligible?
- —
Short-term bridge; refi at stabilization.
Rent comps 40 comps
| Address | Beds | Baths | Sqft | Rent | $/sqft | DOM | Units | Dist |
|---|---|---|---|---|---|---|---|---|
| 3459 23rd St SE Washington, DC | 2.0 | 1.0 | 1200 | $2,100 | $1.75 | 5d | 1 | 0.10mi |
| 2603 Southern Ave SE Hillcrest Heights, MD | 1.0–2.0 | 1.0 | 646 | $1,375 | $2.13 | 1d | 7 | 0.17mi |
| 2627 Jasper St SE Washington, DC | 1.0–2.0 | 1.0–1.5 | 838 | $1,729 | $2.06 | 24d | 1 | 0.30mi |
| 3212 28th St SE Unit D Washington, DC | 3.0 | 1.0 | 790 | $2,100 | $2.66 | 24d | 1 | 0.34mi |
| 3158 Buena Vista Ter SE Unit 1 Washington, DC | 3.0 | 1.0 | 800 | $2,900 | $3.62 | 24d | 1 | 0.38mi |
| 3150 Buena Vista Ter SE Apt 6 Washington, DC | 4.0 | 1.0 | 1398 | $4,250 | $3.04 | 24d | 1 | 0.40mi |
| 2000 Ridgecrest Ct SE Washington, DC | 2.0–3.0 | 1.0 | 900 | $1,923 | $2.14 | 2d | 6 | 0.41mi |
| 2000 Ridgecrest Ct SE Washington, DC | 3.0 | 1.0 | 850 | $1,486 | $1.75 | 2d | 1 | 0.41mi |
| 3130 Buena Vista Ter SE Unit 6 Washington, DC | 3.0 | 1.0 | 855 | $1,980 | $2.32 | 17d | 1 | 0.44mi |
| 3035 30th St SE Unit 3B Washington, DC | 2.0 | 1.0 | 950 | $1,575 | $1.66 | 24d | 1 | 0.47mi |
| 2336 Anvil Ln Temple Hills, MD | 3.0 | 2.5 | 1320 | $2,300 | $1.74 | 44d | 1 | 0.51mi |
| 3030 30th St SE Washington, DC | 1.0–2.0 | 1.0 | 887 | $1,500 | $1.69 | 24d | 3 | 0.51mi |
| 2472 Alabama Ave SE Unit B2 Washington, DC | 3.0 | 1.0 | 827 | $2,500 | $3.02 | 24d | 1 | 0.52mi |
| 3009 Southern Ave SE Temple Hills, MD | 3.0 | 1.0 | 909 | $1,650 | $1.82 | 44d | 1 | 0.53mi |
| 3103 Naylor Rd SE Washington, DC | 2.0 | 1.0 | 768 | $1,650 | $2.15 | 24d | 1 | 0.57mi |
| 2816 Hartford St SE Washington, DC | 3.0 | 1.0 | 760 | $9,000 | $11.84 | 4d | 1 | 0.60mi |
| 2838 Hartford St SE Washington, DC | 2.0 | 1.0 | 785 | $1,538 | $1.96 | 18d | 2 | 0.61mi |
| 2838 Hartford St SE #304 Washington, DC | 2.0 | 1.0 | 775 | $1,500 | $1.94 | 3d | 1 | 0.61mi |
| 2021 Chadwick Ter Unit 1 Temple Hills, MD | 2.0 | 1.0 | 1460 | $1,100 | $0.75 | 24d | 1 | 0.62mi |
| 2841 Gainesville St SE #201 Washington, DC | 2.0 | 1.0 | 784 | $1,900 | $2.42 | 3d | 1 | 0.64mi |
| 2847 Gainesville St SE Unit 303 Washington, DC | 3.0 | 1.0 | 902 | $2,400 | $2.66 | 24d | 1 | 0.64mi |
| 2847 Gainesville St SE Unit B2 Washington, DC | 2.0 | 1.0 | 710 | $1,700 | $2.39 | 24d | 1 | 0.64mi |
| 2833 28th St SE Unit 4 Washington, DC | 3.0 | 1.0 | 820 | $2,200 | $2.68 | 24d | 1 | 0.70mi |
| 3103 Good Hope Ave Hillcrest Heights, MD | 3.0 | 1.0–2.0 | 851 | $2,709 | $3.18 | 2d | 12 | 0.70mi |
| 3275 15th Pl SE #101 Washington, DC | 3.0 | 1.0 | 984 | $2,250 | $2.29 | 24d | 1 | 0.70mi |
| 3281 15th Pl SE Washington, DC | 3.0 | 1.0 | 1012 | $1,750 | $1.73 | 7d | 1 | 0.71mi |
| 3243 15th Pl SE Washington, DC | 2.0 | 2.0 | 1248 | $2,500 | $2.00 | 24d | 1 | 0.71mi |
| 2495 Alabama Ave SE Unit 302 Washington, DC | 3.0 | 1.0 | 825 | $2,600 | $3.15 | 22d | 1 | 0.73mi |
| 2716 29th St SE Washington, DC | 2.0 | 1.0 | 850 | $2,000 | $2.35 | 24d | 1 | 0.74mi |
| 2805 28th St SE Unit 1 Washington, DC | 2.0 | 1.0 | 800 | $1,690 | $2.11 | 24d | 1 | 0.74mi |
| 3001 Branch Ave Temple Hills, MD | 2.0 | 1.0 | 769 | $2,043 | $2.66 | 1d | 43 | 0.75mi |
| 3505 Everest Dr Temple Hills, MD | 4.0 | 2.0 | 1372 | $2,600 | $1.90 | 18d | 1 | 0.91mi |
| 1309 Congress St SE Washington, DC | 1.0–2.0 | 1.0 | 625 | $1,250 | $2.00 | 15d | 1 | 0.92mi |
| 1439 Southern Ave SE Oxon Hill, MD | 2.0–3.0 | 1.0–2.0 | 1080 | $2,342 | $2.17 | 44d | 1 | 0.93mi |
| 2621 30th St SE Unit 1 Washington, DC | 2.0 | 1.0 | 800 | $1,750 | $2.19 | 24d | 1 | 0.95mi |
| 2707 Fairlawn St Temple Hills, MD | 3.0 | 3.0 | 1362 | $2,750 | $2.02 | 22d | 1 | 0.97mi |
| 3903 25th Ave Hillcrest Heights, MD | 2.0 | 1.0 | 768 | $1,500 | $1.95 | 4d | 1 | 1.02mi |
| 3909 25th Ave Hillcrest Heights, MD | 2.0 | 1.0 | 768 | $1,500 | $1.95 | 4d | 1 | 1.04mi |
| 3325 13th St SE Apt 1 Washington, DC | 3.0 | 1.0 | 902 | $2,500 | $2.77 | 2d | 1 | 1.05mi |
| 3325 13th St SE Apt 12 Washington, DC | 3.0 | 1.0 | 901 | $2,500 | $2.77 | 24d | 1 | 1.05mi |
Listing history 9 events
-
2026-06-18days on market $199,000 Active 13 DOM
-
2026-06-17days on market $199,000 Active 12 DOM
-
2026-06-16days on market $199,000 Active 11 DOM
-
2026-06-15days on market $199,000 Active 10 DOM
-
2026-06-13days on market $199,000 Active 8 DOM
-
2026-06-09days on market $199,000 Active 4 DOM
-
2026-06-08days on market $199,000 Active 3 DOM
-
2026-06-07remarks 699-char remark
-
2026-06-07$199,000 Active 2 DOM
ⓘ Source: listings_history table (triggers on properties + properties_extension) + one-shot
backfill from property_details.listing_events for pre-trigger history.
Tax reassessment forecast DC · Partial reset (capped growth)
- Current annual tax
- $1,638 · $137/mo
- Projected year-2 tax
- $1,638 · $137/mo
- Expected delta
- $0/yr ($0/mo · 0.0%)
ⓘ Screening estimate from a state-policy table — verify with the county assessor before closing.
Climate risk First Street
- Flood 1/10 Low FEMA zone X (unshaded) · 0% chance over 30 yrs
- Wildfire 1/10 Low
- Heat 7/10 Severe 7 d/yr ≥103°F today · 16 d/yr by 30 yrs out
- Wind 4/10 Moderate 21% chance of damaging wind over 30 yrs
- Air quality 3/10 Moderate 2 unhealthy d/yr today · 3 by 30 yrs out
Nearby sold comps map
Loading sold comps map…
Walkable amenities ~0.75 mi
Loading nearby amenities…
Taxation est. · year 1
- Rental income
- $25,734
- − Mortgage interest
- −$11,147
- − Property taxes
- −$1,638
- − Insurance
- −$995
- − Repairs & maintenance
- −$2,059
- − Management
- −$2,059
- − Depreciation
- −$5,789
- Taxable income
- $2,047
- Est. tax owed @ 24.0%
- −$491
- After-tax cash flow
- $4,682/yr
For passive investors: Depreciation is non-cash, so a rental often shows a tax loss while cash-flowing — sheltering income. Rental losses are passive: they offset passive income freely, and up to $25,000/yr can offset ordinary (W-2) income if you actively participate and your MAGI is under $100k (phasing out to $0 by $150k); unused losses carry forward. On sale, claimed depreciation is recaptured at up to 25%, and gains may owe capital-gains tax (a 1031 exchange can defer both). Figures are a year-1 estimate at your 24.0% rate — not tax advice; consult a CPA.
Schools (NCES district)
- District
- District Of Columbia Public Schools
- NCES district ID
- 1100030
- Math proficiency
- 33% ▲ 3.00%
- Reading proficiency
- 40% ▲ 5.00%
- Median HH income
- $67,671
- Composite
- 35.84/100
- National rank
- #9606
- State rank
- #8 of 32 in DC
Livability — Washington
- Score
- 73/100
- State rank
- #1
- US rank
- #5327
Category grades
Schools grade is shown separately in the Schools card above.
Census & demographics
- Census place
- Washington, DC
- County
- District of Columbia · 671,873 people
- City population
- 671,873
- Metro
- Washington-Arlington-Alexandria, DC-VA-MD-WV
- Population (ZIP)
- 53,005
- Household income
- $54,032
- Rent vs Own
- Severe rent burden
- 5148.0
Population outlook (District of Columbia County) Hauer SSP2
- Today (2025)
- 821,926 people
- By 2030
- 899,517 · +9.4%
- By 2040
- 1,061,162 · +29.1%
- By 2050
- 1,231,493 · +49.8%
- By 2075
- 1,603,312 · +95.1%
- By 2100
- 1,847,141 · +124.7%
Race, ethnicity, and origin ACS 2023
- Neighborhood character
- Predominantly Black (90%)
- Race & ethnicity
- Black 90% Two or more races 3% Hispanic / Latino 3% White 3%
- Common ancestry
- Lithuanian 1%
- Foreign-born
- 3% · Canada
- Languages at home
- 95% English-only · Spanish 2% French/Haitian/Cajun 1%
Political lean MEDSL · District of Columbia
- 2024 margin
- Solid D (+86.1) · D 91.2% · R 5.1% · Other 3.8%
- 2008→2024 swing
- +0.1pp no change · 2008: 85.9pp · 2024: 86.1pp
- All cycles
- 2024: D+86.1 2020: D+86.8 2016: D+88.7 2012: D+84.2 2008: D+85.9
Not yet ingested
- Civics
- —
Market trends
- HPI YoY
- ▼ -415.44%
- Current HPI
- 306.5068
- Rent YoY
- ▲ 3.86%
- Metro
- Washington-Arlington-Alexandria, DC-VA-MD-WV
- State GDP YoY
- ▲ 1.33%
- F500 in state
- 6
Industry mix (Fortune 500 HQ in DC)
| Industry | F500 HQs | Revenue |
|---|---|---|
| Financial Services | 1 | $153B |
|
||
| Life Sciences / Industrials | 1 | $25B |
|
||
| Industrial Machinery | 1 | $8B |
|
||
Price history
1 event — show timeline
- 2026-06-05 Listed $199,000 BRIGHT MLS
Property tax history
+11.9%/yrLatest (2025): $1,638 · +7.2% YoY. Source: county tax records.
Cash-flow waterfall
monthlySold comps — $/sqft
last 12 mo · ≤1 miLoading sold comps…