 Duplex
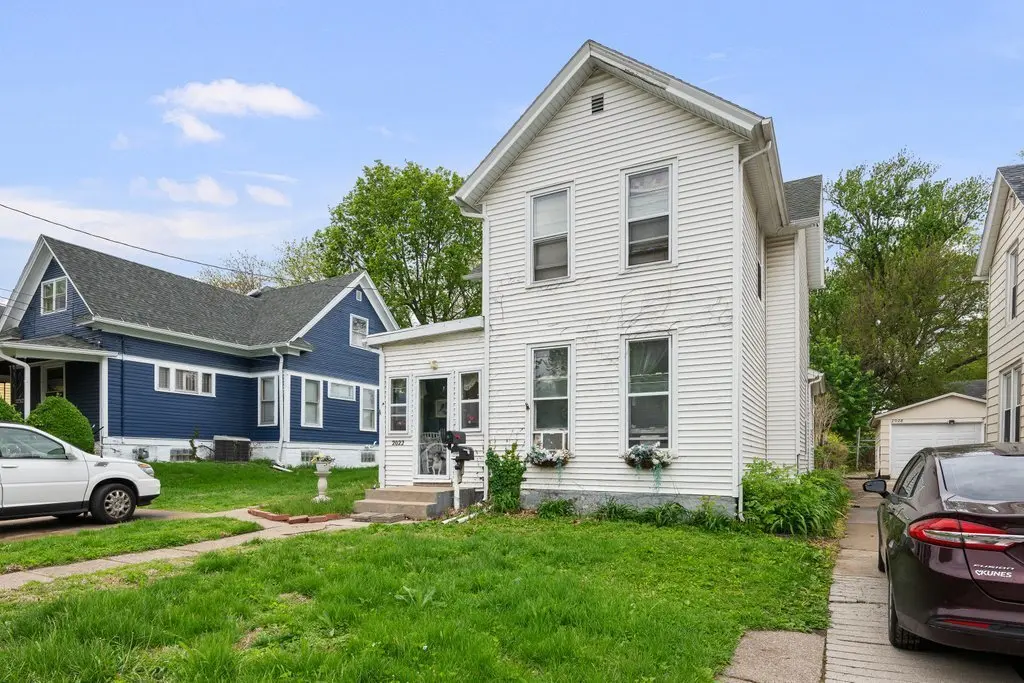
2022 Iowa St · Davenport, IA
Flood risk 1/10 · Minimal
- FEMA flood zone
- X (unshaded)
- Chance of flooding over 30 yrs
- 0.0%
- Est. flood insurance / yr
- $473 – $860
Fire risk 1/10 · Minimal
- Est. fire insurance / yr
- $902 – $1,676
Heat risk 3/10 · Minor
- Hot days now (above 103°F)
- 7 days/yr
- Hot days in 30 yrs
- 16 days/yr
Wind risk 2/10 · Minimal
- Chance of severe wind over 30 yrs
- —
Air-quality risk 3/10 · Minor
- Unhealthy air days now
- 2 days/yr
- Unhealthy air days in 30 yrs
- 3 days/yr
Risk factors via First Street. Map © Google.
Why this score? — see what drove the B+ grade
The composite is a weighted blend of 9 inputs, each scored 0–100. Each bar is that input's sub-score; the figure is the points it added to the 100-point composite (weight × sub-score).
- Cash flow +30.0/30.0
- ARV discount +15.0/15.0
- 1% rule +10.0/10.0
- DSCR +10.0/10.0
- Livability +4.0/5.0
- Schools +3.9/10.0
- Rent growth +3.6/5.0
- Condition / age +2.5/5.0
- Appreciation +0.0/10.0
$85,000
🖨 Deal sheet (PDF) 📄 Offer letter ✓ Due diligence
Multi-family units
County records classify this as Multi-Family (2-4 Unit). Listing-text estimate: 2 units. confirmed
Listing remarks MLS
Rental property with steady income with same tenants since 2019. Upper/lower duplex conversion. First floor has laundry hook ups. Window units for air conditioning. Nice property for those starting investment in rental real estate or for those adding to existing rental units. New furnace in 2019. 24 hour notice to show.
Key facts
- 6,250 sq ft lot
- 2 parking spots
- Built 1920
Property features AI
Finance
- Other: Some tenant rights/possession restrictions; Estimated annual expenses reported for utilities and insurance
- Financial info: Gross scheduled income: $17,040; Current combined rents shown for units
Exterior
- Parking: 2 off-street parking spaces (total)
- Utilities: Public water; Public sewer; Cable available
- Home design: Two- to four-unit property (2 units total); Fee simple ownership; Over 100 years old; Built before 1978
- Construction: Vinyl siding exterior; Asphalt roof; Stone foundation
- Exterior features: Level lot; Lot dimensions approximately 50 x 125
Interior
- Kitchen: Each unit includes a stove and refrigerator
- Bedrooms: Two 1-bedroom units (one on first floor, one on second floor)
- Bathrooms: Two full bathrooms (one in each unit)
- Heating & cooling: Forced air heating (natural gas)
- Interior features: Unfinished full basement with block walls
- Laundry & utility: Tenants pay electric, gas, and heat
Neighborhood map
What this means for you Summary
Snapshot
- This is a 2 × 2-bed/2.0-bath units multifamily listed at $85k.
Deal economics
- At list price, monthly cash flow is $908 ($11k/yr) — positive. Per door: $454/mo.
- The deal already cash-flows at list — no discount required.
- Meets the 1% rule at list price ($2k rent vs $85k).
- Recommended offer: $82k (3.0% below list) — sets the bar for market timing.
- Cap rate 19.1% vs local median 4.4% in Davenport — top-decile yield for the area; either an underpriced asset or a hidden risk that comps aren't pricing in. Stress-test before assuming the spread holds.
Location & tenants
- Location reads 79/100 on livability (#126 in IA, #2,312 nationally) — a middle-class / working-renter tenant base. Strengths: cost of living A+, housing A+, health & safety A+; Watch: employment C-, crime F.
- Davenport Community School District (urban): math 43% / reading 50% proficiency, ranked #288 of 289 in IA (top 100%) — families likely to look elsewhere, expect single-tenant / working-renter base with shorter leases.
- Zoned schools: Madison Elementary School (math 28% / reading 25%, grade F, #611 of 616 statewide, top 99%, 379 students, 73% FRL); Central High School (math 45% / reading 64%, grade C-, #290 of 336 statewide, top 87%, 1,505 students, 47% FRL) — zoned schools at 60% FRL track the district average.
- Market conditions: Rents rising fast (+4.6%/yr); 165 active listings in the ZIP; 34 comparable units currently listed for rent nearby; rentals lingering (median 46d on market — plan ~5-8 weeks vacancy on turnover, expect pricing pressure); 59% of comp listings sitting > 30 days — soft ceiling on asking rent; 805 units permitted in Scott County in 2024 (479 in 5+ unit buildings).
- This rent runs 35% of the median local income ($65k/yr) — at the standard rent-burdened threshold; future hikes will face affordability resistance.
Forward outlook
- Local home prices are declining (-3.0%/yr); year-one equity from $588 of loan paydown is wiped out by about $3k of value loss. Plan a longer hold.
- Scott County population projected at +19% by 2050 — long-run rental-demand tailwind backs the buy-and-hold thesis.
- At projected returns (-3.0% appreciation + 4.6% rent growth), your $24k cash investment doubles in ~3 years — after that, you're playing with house money.
Negotiation context
- It's been on market 31 days — a 3% lower offer ($82k) is reasonable based on typical stale-listing flexibility.
- 5 sale attempts since 8y ago with the ask held roughly flat each time — persistent listings suggest the price (not the market) is what's stuck; bring a comps-based counter.
Risks & watch-outs
- Watch-outs: built in 1920 — expect roof / HVAC / electrical / plumbing capex.
Questions for the listing agent
- It's been on market 31 days. Have you received any prior offers? Is the seller open to a 3% concession, seller financing, or rate buy-down credit?
- Can we see the unit-by-unit rent roll, current vacancy, and any below-market leases? What's the average tenancy length?
- What capital expenditures (roof, boiler, parking lot, exteriors) have been made in the last 5 years, and what's planned in the next 2?
- Built in 1920 — when were the roof, HVAC, electrical panel, plumbing, and water heater last replaced?
- Is there a deadline driving the sale (1031 exchange, divorce, estate, relocation)? That informs how much negotiation room exists.
- Crime grade is F in this area — have there been break-ins, vandalism, or insurance claims at this property in the last 3 years? What carrier currently insures it and at what premium?
- What's the average days-on-market for RENTAL listings here right now (not sales)? A rising rental-DOM trend means longer vacancies and softer asking-rent achievability than the comps imply.
- What's the recent tenant-quality profile in this submarket — average credit score on applications, eviction rate, late-payment / NSF rate, and stable-employment percentage? A property-management company in the area should have these aggregated.
- How much new apartment / multifamily construction is in the pipeline within 1–3 miles? Heavy new supply (>2% of stock underway) typically softens rents 12–24 months out; light construction supports rent growth.
Investment metrics
- 1% rule
- 2.22% ✓
- Cap rate
- 19.11%
- Cash-on-cash
- 45.76%
- DSCR
- 3.04
- GRM
- 3.8
CMA / ARV
- ARV (median comp)
- $163,528
- List price
- $85,000
- Delta
- -48.02%
- Verdict
- UNDERPRICED
- Comps
- 20 within 1.0 mi
Projected returns pro-forma
-3.0% appreciation · 4.57% rent growth · sell at horizon
- IRR
- 44.7%
- Equity multiple
- 2.98×
- Total profit
- $47,083
- Equity at exit
- $12,674
- IRR
- 51.3%
- Equity multiple
- 6.39×
- Total profit
- $128,357
- Equity at exit
- $7,349
Cash invested: $23,800 (down + closing). Projections, not guarantees.
Landlord ↔ Tenant lean methodology
- Overall (STATE)
- 83 Strongly Landlord-Friendly
- State Iowa
- 83 Strongly Landlord-Friendly · R+6
- County
- — inherits STATE
- City
- — inherits STATE
ZIP-level market 52803
- Home prices YoY
- -34.5%
- Rents YoY
- 4.6%
- Active inventory
- 165
- Price-to-rent
- 7.5×
Monthly cashflow live
- Estimated rent
- $1,886 high interval (Pro) →
- Mortgage (P&I)
- −$446
- Tax from tax record
- −$101 /mo · $1,214/yr
- Insurance
- −$35
- HOA
- −$0
- Vacancy / Maint / Mgmt
- −$396
- Net cashflow
- $908
Break-even live
Sensitivity live
| Price | -10% $956 | -5% $932 | +0% $908 | +5% $884 | +10% $859 |
|---|---|---|---|---|---|
| Rent | -10% $759 | -5% $833 | +0% $908 | +5% $982 | +10% $1,057 |
| Rate | -1.0pp $950 | -0.5pp $929 | base $908 | +0.5pp $886 | +1.0pp $863 |
2-unit breakdown (identical units grouped — click to expand)
| Units | Beds | Baths | Est. rent |
|---|---|---|---|
| 2× units | 2 | 2 | $1,886 |
| #1 | 2 | 2 | $943 |
| #2 | 2 | 2 | $943 |
| Total (2 units) | $1,886 | ||
UW: 25.0% down · 7.5% · 30yr · 1.5% tax · 5.0% vac · 8.0% maint · 8.0% mgmt
Financing live
Cash to close
- Down payment
- $21,250
- Closing costs
- $2,550
- Reserves months
- —
- Total cash needed
- —
Loan-product check · same deal, 3 products live
Conventional
25% down · 7.5% · 30yr
- Down + closing
- —
- Monthly P&I
- —
- Monthly cashflow
- —
- DSCR
- —
- Eligible?
- —
Personal DTI + credit; lowest rate.
DSCR
20% down · 8.5% · 30yr
- Down + closing
- —
- Monthly P&I
- —
- Monthly cashflow
- —
- DSCR
- —
- Eligible?
- —
No personal income docs; deal must DSCR.
Hard money
10% down · 12.0% · 12mo
- Down + closing
- —
- Monthly P&I
- —
- Monthly cashflow
- —
- DSCR
- —
- Eligible?
- —
Short-term bridge; refi at stabilization.
Rent comps 34 comps
| Address | Beds | Baths | Sqft | Rent | $/sqft | DOM | Units | Dist |
|---|---|---|---|---|---|---|---|---|
| 2224 Iowa St Unit 2224 Davenport, IA | 2.0 | 1.0 | 1214 | $925 | $0.76 | 45d | 1 | 0.16mi |
| 2224 Iowa St Davenport, IA | 2.0 | 1.0 | 1214 | $895 | $0.74 | 45d | 1 | 0.16mi |
| 2209 Farnam St Unit 2211 Davenport, IA | 3.0 | 1.0 | 1138 | $1,050 | $0.92 | 22d | 1 | 0.23mi |
| 317 Kirkwood Blvd Davenport, IA | 2.0 | 1.0 | 1300 | $950 | $0.73 | 45d | 1 | 0.28mi |
| 1421 N Main St #2 Davenport, IA | 3.0 | 1.0 | 1350 | $1,095 | $0.81 | 45d | 1 | 0.47mi |
| 119 E 13th St Davenport, IA | 3.0 | 1.0 | 1728 | $1,495 | $0.87 | 45d | 1 | 0.52mi |
| 1519 N Ripley St Davenport, IA | 2.0 | 1.0 | 1144 | $1,100 | $0.96 | 15d | 1 | 0.52mi |
| 537 W 16th St Davenport, IA | 3.0 | 1.0 | 1311 | $1,400 | $1.07 | 45d | 1 | 0.66mi |
| 320 E 29th St Davenport, IA | 2.0 | 2.5 | 1450 | $1,750 | $1.21 | 45d | 1 | 0.68mi |
| 1017 E 13th St Unit 1017 Davenport, IA | 2.0 | 1.0 | 1335 | $950 | $0.71 | 22d | 1 | 0.72mi |
| 1315 Brown St Unit 2 Davenport, IA | 3.0 | 1.0 | 1300 | $1,250 | $0.96 | 22d | 1 | 0.86mi |
| 915 W 14th St Davenport, IA | 3.0 | 1.0 | 1390 | $900 | $0.65 | 45d | 1 | 0.96mi |
| 511 Pershing Ave Unit 202W Davenport, IA | 2.0 | 1.0 | 1201 | $1,601 | $1.33 | 45d | 1 | 1.04mi |
| 511 Pershing Ave Unit 301E Davenport, IA | 3.0 | 2.0 | 1429 | $2,126 | $1.49 | 45d | 1 | 1.04mi |
| 511 Pershing Ave Unit 407W Davenport, IA | 2.0 | 2.0 | 1175 | $1,568 | $1.33 | 45d | 1 | 1.04mi |
| 511 Pershing Ave Unit 102W Davenport, IA | 2.0 | 1.0 | 1173 | $1,506 | $1.28 | 45d | 1 | 1.04mi |
| 511 Pershing Ave Unit 402W Davenport, IA | 2.0 | 2.0 | 1106 | $1,478 | $1.34 | 45d | 1 | 1.04mi |
| 511 Pershing Ave Unit 106E Davenport, IA | 3.0 | 2.0 | 1349 | $1,996 | $1.48 | 45d | 1 | 1.04mi |
| 511 Pershing Ave Unit 101W Davenport, IA | 2.0 | 1.0 | 1280 | $1,704 | $1.33 | 45d | 1 | 1.04mi |
| 511 Pershing Ave Unit 105E Davenport, IA | 2.0 | 2.0 | 1100 | $1,635 | $1.49 | 45d | 1 | 1.04mi |
| 102 W 35th St Unit 119W_35R Davenport, IA | 2.0 | 2.0 | 1200 | $1,050 | $0.88 | 45d | 1 | 1.06mi |
| 102 W 35th St Unit 104E_35R Davenport, IA | 2.0 | 2.0 | 1200 | $1,050 | $0.88 | 22d | 1 | 1.06mi |
| 102 W 35th St Unit 130E_35R Davenport, IA | 2.0 | 2.0 | 1200 | $1,100 | $0.92 | 15d | 1 | 1.06mi |
| 102 W 35th St Unit 105W_35 Davenport, IA | 3.0 | 2.0 | 1500 | $1,150 | $0.77 | 45d | 1 | 1.06mi |
| 102 W 35th St Unit 128E_35R Davenport, IA | 2.0 | 2.0 | 1200 | $1,100 | $0.92 | 22d | 1 | 1.06mi |
| 736 Federal St Davenport, IA | 1.0–3.0 | 1.0–2.0 | 1186 | $1,559 | $1.31 | 22d | 1 | 1.07mi |
| 427 Pershing Ave Davenport, IA | 3.0 | 2.0 | 1438 | $2,288 | $1.59 | 15d | 3 | 1.08mi |
| 427 N Brady St Unit 1 Davenport, IA | 3.0 | 1.5 | 1126 | $1,359 | $1.21 | 45d | 1 | 1.10mi |
| 401 Brady St Davenport, IA | 1.0–3.0 | 1.0–2.0 | 870 | $1,625 | $1.87 | 15d | 2 | 1.15mi |
| 200 E 3rd St Davenport, IA | 1.0–2.0 | 1.0–2.0 | 900 | $1,700 | $1.89 | 15d | 2 | 1.20mi |
| 212 N Brady St Davenport, IA | 2.0–3.0 | 2.0–3.0 | 1428 | $1,900 | $1.33 | 15d | 4 | 1.28mi |
| 324 S Brady St Davenport, IA | 1.0–2.0 | 1.0–2.0 | 965 | $1,700 | $1.76 | 22d | 2 | 1.31mi |
| 2220 E Lombard St Davenport, IA | 3.0 | 2.0 | 1500 | $1,620 | $1.08 | 45d | 1 | 1.31mi |
| 3705 College Ave Davenport, IA | 2.0 | 1.0 | 800 | $1,095 | $1.37 | 15d | 7 | 1.48mi |
Listing history 22 events
-
2026-06-09status $85,000 Pending 31 DOM
-
2026-06-08days on market $85,000 Active 31 DOM
-
2026-06-07days on market $85,000 Active 30 DOM
-
2026-06-03days on market $85,000 Active 26 DOM
-
2026-06-02days on market $85,000 Active 25 DOM
-
2026-06-01days on market $85,000 Active 24 DOM
-
2026-05-31days on market $85,000 Active 23 DOM
-
2026-05-30days on market $85,000 Active 22 DOM
-
2026-05-08$85,000 Active 325-char remark
-
2022-10-05historical
-
2022-05-03soldstatus $75,000
-
2022-03-25soldstatus $75,000
Show marketing remark (325 chars)
Rental property with steady income with same tenants since 2019. Upper/lower duplex conversion. First floor has laundry hook ups. Window units for air conditioning. Nice property for those starting investment in rental real estate or for those adding to existing rental units. New furnace in 2019. 24 hour notice to show.
-
2022-02-14$75,000
Show marketing remark (325 chars)
Rental property with steady income with same tenants since 2019. Upper/lower duplex conversion. First floor has laundry hook ups. Window units for air conditioning. Nice property for those starting investment in rental real estate or for those adding to existing rental units. New furnace in 2019. 24 hour notice to show.
-
2019-02-07soldstatus $52,000
-
2019-02-05soldstatus $52,000
-
2019-02-05soldstatus $52,000
-
2018-12-18$60,000
-
2018-12-18$60,000
-
2013-10-28soldstatus $80,000
-
2013-06-17soldstatus $44,000
ⓘ Source: listings_history table (triggers on properties + properties_extension) + one-shot
backfill from property_details.listing_events for pre-trigger history.
Tax reassessment forecast IA · Partial reset (capped growth)
- Current annual tax
- $1,214 · $101/mo
- Projected year-2 tax
- $1,274 · $106/mo
- Expected delta
- +$60/yr (+$5/mo · 5.0%)
ⓘ Screening estimate from a state-policy table — verify with the county assessor before closing.
Climate risk First Street
- Flood 1/10 Low FEMA zone X (unshaded) · 0% chance over 30 yrs
- Wildfire 1/10 Low
- Heat 3/10 Moderate 7 d/yr ≥103°F today · 16 d/yr by 30 yrs out
- Wind 2/10 Low
- Air quality 3/10 Moderate 2 unhealthy d/yr today · 3 by 30 yrs out
Nearby sold comps map
Loading sold comps map…
Walkable amenities ~0.75 mi
Loading nearby amenities…
Taxation est. · year 1
- Rental income
- $22,632
- − Mortgage interest
- −$4,761
- − Property taxes
- −$1,214
- − Insurance
- −$425
- − Repairs & maintenance
- −$1,811
- − Management
- −$1,811
- − Depreciation
- −$2,473
- Taxable income
- $10,138
- Est. tax owed @ 24.0%
- −$2,433
- After-tax cash flow
- $8,458/yr
For passive investors: Depreciation is non-cash, so a rental often shows a tax loss while cash-flowing — sheltering income. Rental losses are passive: they offset passive income freely, and up to $25,000/yr can offset ordinary (W-2) income if you actively participate and your MAGI is under $100k (phasing out to $0 by $150k); unused losses carry forward. On sale, claimed depreciation is recaptured at up to 25%, and gains may owe capital-gains tax (a 1031 exchange can defer both). Figures are a year-1 estimate at your 24.0% rate — not tax advice; consult a CPA.
Schools (NCES district)
- District
- Davenport Community School District
- NCES district ID
- 1908580
- Math proficiency
- 43% ▼ -11.00%
- Reading proficiency
- 50% ▼ -3.00%
- Median HH income
- $46,157
- Composite
- 39.49/100
- National rank
- #3951
- State rank
- #288 of 289 in IA
Livability — Davenport
- Score
- 79/100
- State rank
- #126
- US rank
- #2312
Category grades
Schools grade is shown separately in the Schools card above.
Census & demographics
- Census place
- Davenport, IA
- County
- Scott County · 144,583 people
- City population
- 103,319
- Metro
- Davenport-Moline-Rock Island, IA-IL
- Population (ZIP)
- 22,742
- Household income
- $64,543
- Rent vs Own
- Severe rent burden
- 630.0
Population outlook (Scott County) Hauer SSP2
- Today (2025)
- 188,878 people
- By 2030
- 196,648 · +4.1%
- By 2040
- 210,860 · +11.6%
- By 2050
- 224,359 · +18.8%
- By 2075
- 258,884 · +37.1%
- By 2100
- 286,447 · +51.7%
Race, ethnicity, and origin ACS 2023
- Neighborhood character
- Predominantly White (69%)
- Race & ethnicity
- White 69% Black 14% Two or more races 10% Hispanic / Latino 9%
- Hispanic origin (detail)
- Mexican 7%
- Common ancestry
- Romanian 2% Portuguese 2% Iranian 2%
- Foreign-born
- 5% · Canada, United Kingdom, South Korea
- Languages at home
- 93% English-only · Spanish 4% French/Haitian/Cajun 1%
Political lean MEDSL · Scott
- 2024 margin
- Toss-up / Even · D 47.3% · R 51.2% · Other 1.4%
- 2008→2024 swing
- -18.4pp toward R · 2008: 14.6pp · 2024: -3.9pp
- All cycles
- 2024: R+3.9 2020: D+3.5 2016: D+1.4 2012: D+13.8 2008: D+14.6
Not yet ingested
- Civics
- —
Market trends
- HPI YoY
- ▼ -96.00%
- Current HPI
- 182.0976
- Rent YoY
- ▲ 4.57%
- Metro
- Davenport-Moline-Rock Island, IA-IL
- State GDP YoY
- ▲ 2.48%
- F500 in state
- 4
Industry mix (Fortune 500 HQ in IA)
| Industry | F500 HQs | Revenue |
|---|---|---|
| Financial Services | 1 | $16B |
|
||
| Retail / Convenience | 1 | $15B |
|
||
Price history
+93.2% since first listed15 events — show timeline
- 2026-06-09 Pending — MRED as Distributed by MLS Grid
- 2026-05-08 Listed $85,000 MRED as Distributed by MLS Grid
- 2022-10-05 Listing Removed — RMLSA as Distributed by MLS Grid
- 2022-05-03 Sold (Public Records) $75,000 Public Records
- 2022-03-25 Sold (MLS) $75,000 MRED as Distributed by MLS Grid
- 2022-03-25 Sold (MLS) $75,000 RMLSA as Distributed by MLS Grid
- 2022-02-14 Listed $75,000 MRED as Distributed by MLS Grid
- 2022-02-14 Listed $75,000 RMLSA as Distributed by MLS Grid
- 2019-02-07 Sold (Public Records) $52,000 Public Records
- 2019-02-05 Sold (MLS) $52,000 RMLSA as Distributed by MLS Grid
- 2019-02-05 Sold (MLS) $52,000 MRED as Distributed by MLS Grid
- 2018-12-18 Listed $60,000 RMLSA as Distributed by MLS Grid
- 2018-12-18 Listed $60,000 MRED as Distributed by MLS Grid
- 2013-10-28 Sold (Public Records) $80,000 Public Records
- 2013-06-17 Sold (Public Records) $44,000 Public Records
Property tax history
-0.4%/yrLatest (2025): $1,214 · +2.5% YoY. Source: county tax records.
Cash-flow waterfall
monthlySold comps — $/sqft
last 12 mo · ≤1 miLoading sold comps…