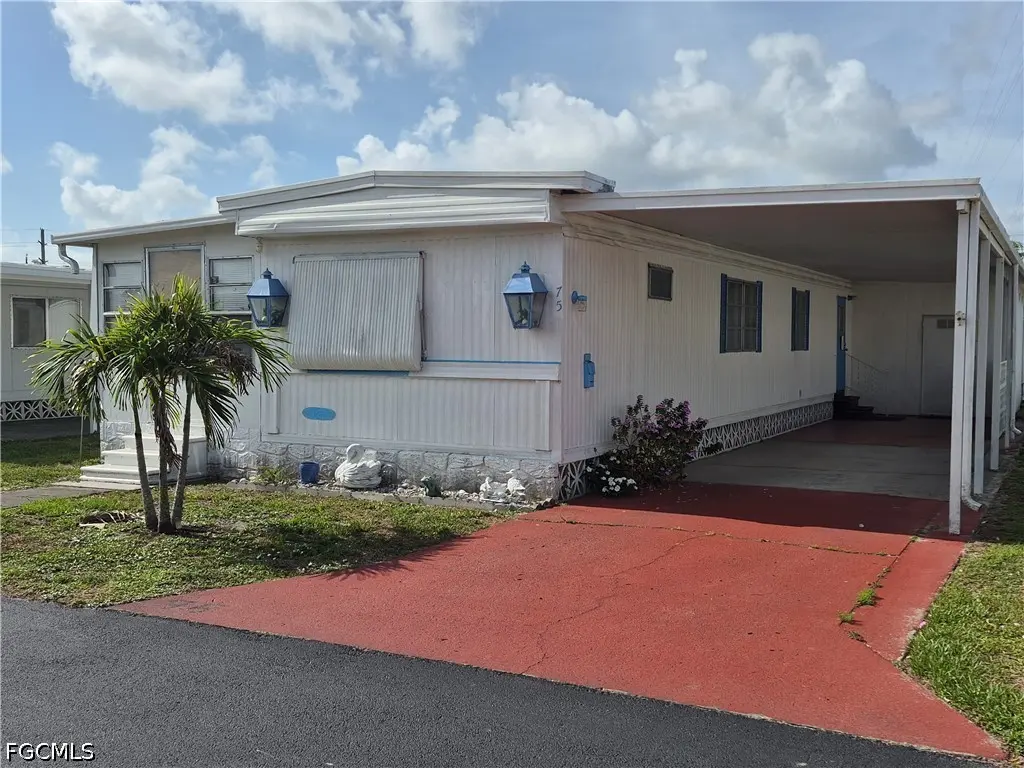
75 Hacienda Blvd · Fort Myers, FL
Flood risk 1/10 · Minimal
- FEMA flood zone
- X (unshaded)
- Chance of flooding over 30 yrs
- 0.0%
- Est. flood insurance / yr
- $507 – $1,088
Fire risk 3/10 · Minor
- Est. fire insurance / yr
- $947 – $1,759
Heat risk 10/10 · Severe
- Hot days now (above 107°F)
- 7 days/yr
- Hot days in 30 yrs
- 29 days/yr
Wind risk 10/10 · Severe
- Chance of severe wind over 30 yrs
- 99.0%
Air-quality risk 2/10 · Minimal
- Unhealthy air days now
- 1 days/yr
- Unhealthy air days in 30 yrs
- 1 days/yr
Risk factors via First Street. Map © Google.
Why this score? — see what drove the B grade
The composite is a weighted blend of 9 inputs, each scored 0–100. Each bar is that input's sub-score; the figure is the points it added to the 100-point composite (weight × sub-score).
- Cash flow +30.0/30.0
- 1% rule +10.0/10.0
- DSCR +10.0/10.0
- ARV discount +7.5/15.0
- Livability +4.3/5.0
- Schools +4.1/10.0
- Condition / age +2.5/5.0
- Rent growth +1.8/5.0
- Appreciation +0.0/10.0
$82,500
🖨 Deal sheet 📄 Offer letter ✓ Due diligence
Listing remarks
Welcome to Your Next Chapter in Paradise! Discover the perfect blend of comfort, community, and convenience in this charming 2-bedroom, 2-bath manufactured home located in the heart of our vibrant 55+ active lifestyle community. Step inside to find: Bright, open living space with large windows and plenty of natural light. Comfortable kitchen with modern appliances and plenty of seating. Spacious master suite with built-in desk/vanity. Screened-in lanai — perfect for morning coffee or evening breezes. Community perks include: Heated pool & Tiki Hut for year-round enjoyment and social gatherings. Clubhouse with pool tables, event stage, game room, and library. Shuffleboard, pick
Key facts
- Shuffleboard courts
- Clubhouse
- Pickleball courts
Tags
Property features AI
Finance
- Financial info: Part of a 300-unit community; Pets allowed with conditions (call for details)
- HOA & community: Monthly association fee; Association covers laundry, grounds maintenance, and recreation facilities; Community amenities: clubhouse, fitness center, pool, bocce court, pickleball, tennis courts, shuffleboard, billiards/billiard room, library, business center, cabana, management on site
Exterior
- Parking: Attached covered carport; 1 carport space
- Security: Smoke detectors
- Utilities: Public water; Public sewer; Cable available; High-speed internet available
- Home design: Manufactured home; 1 story; Entry level: 1; North-facing
- Construction: Vinyl siding; Shingle roof; Manufactured construction
- Exterior features: Glass-enclosed porch; Porch; Manual exterior shutters; Community pool; Rectangular lot; South exposure
Interior
- Kitchen: Electric cooktop; Microwave; Dishwasher; Garbage disposal; Refrigerator
- Bedrooms: Bedrooms on entry level
- Flooring: Vinyl flooring
- Bathrooms: 1 full bathroom; 1 half bathroom
- Heating & cooling: Central heating (electric); Central air conditioning (electric); Ceiling fans
- Interior features: Eat-in kitchen; Living/Dining room; Pantry; Tub with shower; Window treatments; Double-hung and single-hung windows; Shutters (interior); Unfurnished
- Laundry & utility: Washer and dryer included; Laundry inside; Common area laundry available
Neighborhood map
What this means for you Summary
Snapshot
- This is a 2-bed/2.0-bath condo listed at $82k.
Deal economics
- At list price, monthly cash flow is $314 ($4k/yr) — positive.
- The deal already cash-flows at list — no discount required.
- Meets the 1% rule at list price ($1k rent vs $82k).
- Recommended offer: $81k (1.5% below list) — sets the bar for market timing.
- Cap rate 10.9% vs local median 3.0% in Fort Myers — top-decile yield for the area; either an underpriced asset or a hidden risk that comps aren't pricing in. Stress-test before assuming the spread holds.
Location & tenants
- Location reads 86/100 on livability (#14 in FL, #383 nationally) — a professional / high-income tenant draw. Strengths: amenities A+, commute A+, housing A+.
- Lee (suburban): math 47% / reading 50% proficiency, ranked #42 of 73 in FL (top 58%) — families likely to look elsewhere, expect single-tenant / working-renter base with shorter leases.
- Market conditions: Rents soft (-3.0%/yr); 763 active listings in the ZIP; 10 comparable units currently listed for rent nearby; rentals at typical pace (median 24d on market — plan ~3-4 weeks tenant-placement turnaround); 15,411 units permitted in Lee County in 2024 (4,686 in 5+ unit buildings).
Forward outlook
- Local home prices are declining (-3.0%/yr); year-one equity from $570 of loan paydown is wiped out by about $2k of value loss. Plan a longer hold.
- Lee County population projected at +44% by 2050 — long-run rental-demand tailwind backs the buy-and-hold thesis.
Negotiation context
- It's been on market 22 days — a 2% lower offer ($81k) is reasonable based on typical stale-listing flexibility.
- 4 sale attempts since 5y ago with the ask held roughly flat each time — persistent listings suggest the price (not the market) is what's stuck; bring a comps-based counter.
Risks & watch-outs
- Climate carrying-cost: severe wind risk, 99% chance of damaging wind over 30y; extreme-heat days projected 7→29/yr by 2055 (HVAC capex compounding) — expect insurance premiums to compound above CPI over the hold.
Questions for the listing agent
- Built in 1974 — when were the roof, HVAC, electrical panel, plumbing, and water heater last replaced?
- What does the HOA fee cover, when was the last increase, and are there any pending special assessments or reserve-fund shortfalls?
- Any open or pending special assessments — roof, HVAC, plumbing, elevator, façade? What's the per-unit balance and payoff schedule, and is the seller paying it off at close or rolling it to the buyer?
- Is there a deadline driving the sale (1031 exchange, divorce, estate, relocation)? That informs how much negotiation room exists.
- What's the average days-on-market for RENTAL listings here right now (not sales)? A rising rental-DOM trend means longer vacancies and softer asking-rent achievability than the comps imply.
- What's the recent tenant-quality profile in this submarket — average credit score on applications, eviction rate, late-payment / NSF rate, and stable-employment percentage? A property-management company in the area should have these aggregated.
- How much new apartment / multifamily construction is in the pipeline within 1–3 miles? Heavy new supply (>2% of stock underway) typically softens rents 12–24 months out; light construction supports rent growth.
Investment metrics
- 1% rule
- 1.69% ✓
- Cap rate
- 10.86%
- Cash-on-cash
- 16.30%
- DSCR
- 1.73
- GRM
- 4.9
CMA / ARV
No comps found within radius.
Projected returns pro-forma
-3.0% appreciation · 0.0% rent growth · sell at horizon
- IRR
- 3.1%
- Equity multiple
- 1.12×
- Total profit
- $2,678
- Equity at exit
- $12,301
- IRR
- 8.8%
- Equity multiple
- 1.56×
- Total profit
- $12,887
- Equity at exit
- $7,133
Cash invested: $23,100 (down + closing). Projections, not guarantees.
Landlord ↔ Tenant lean methodology
- Overall (STATE)
- 87 Strongly Landlord-Friendly
- State Florida
- 87 Strongly Landlord-Friendly · R+3
- County
- — inherits STATE
- City
- — inherits STATE
ZIP-level market 33905
- Home prices YoY
- -31.4%
- Rents YoY
- -3.0%
- Active inventory
- 763
- Price-to-rent
- 4.9×
Monthly cashflow live
- Estimated rent
- $1,395 high interval (Pro) →
- Mortgage (P&I)
- −$433
- Tax from tax record
- −$65 /mo · $776/yr
- Insurance
- −$34
- HOA
- −$257
- Vacancy / Maint / Mgmt
- −$293
- Net cashflow
- $314
Break-even live
UW: 25.0% down · 7.5% · 30yr · 1.5% tax · 5.0% vac · 8.0% maint · 8.0% mgmt
Financing live
Cash to close
- Down payment
- $20,625
- Closing costs
- $2,475
- Reserves months
- —
- Total cash needed
- —
Loan-product check · same deal, 3 products live
Conventional
25% down · 7.5% · 30yr
- Down + closing
- —
- Monthly P&I
- —
- Monthly cashflow
- —
- DSCR
- —
- Eligible?
- —
Personal DTI + credit; lowest rate.
DSCR
20% down · 8.5% · 30yr
- Down + closing
- —
- Monthly P&I
- —
- Monthly cashflow
- —
- DSCR
- —
- Eligible?
- —
No personal income docs; deal must DSCR.
Hard money
10% down · 12.0% · 12mo
- Down + closing
- —
- Monthly P&I
- —
- Monthly cashflow
- —
- DSCR
- —
- Eligible?
- —
Short-term bridge; refi at stabilization.
Rent comps 10 comps
| Address | Beds | Baths | Sqft | Rent | $/sqft | DOM | Units | Dist |
|---|---|---|---|---|---|---|---|---|
| 3870 Calle De Jardin Fort Myers, FL | 1.0–3.0 | 1.0–2.0 | 952 | $1,229 | $1.29 | 23d | 1 | 0.25mi |
| 3875 E Michigan Ave Fort Myers, FL | 1.0–2.0 | 1.0 | 710 | $1,621 | $2.28 | 14d | 1 | 0.34mi |
| 4104 Desoto Ave Fort Myers, FL | 2.0 | 1.0 | 700 | $1,195 | $1.71 | 23d | 1 | 1.18mi |
| 4900 Tice St Unit 5 Fort Myers, FL | 2.0 | 1.0 | 700 | $800 | $1.14 | 23d | 1 | 1.21mi |
| 227 Maria St Fort Myers, FL | 2.0 | 1.0 | 720 | $1,095 | $1.52 | 23d | 1 | 1.27mi |
| 221 Maria St Unit 225 Fort Myers, FL | 2.0 | 1.0 | 720 | $1,095 | $1.52 | 23d | 1 | 1.28mi |
| 464 Carolina Ave Unit A Fort Myers, FL | 2.0 | 1.0 | 714 | $1,150 | $1.61 | 3d | 1 | 1.32mi |
| 464 Carolina Ave Fort Myers, FL | 2.0 | 1.0 | 750 | $975 | $1.30 | 19d | 1 | 1.32mi |
| 9145 Flying Eagle DR Tice, FL | 1.0–3.0 | 1.0–2.5 | 1072 | $2,174 | $2.03 | 3d | 14 | 1.38mi |
| 3814 Desoto Ave Fort Myers, FL | 1.0 | 1.0 | 700 | $959 | $1.37 | 3d | 1 | 1.49mi |
HOA detail condo
- Monthly dues
- $257 · $3,084/yr
- Likely covers
- pool
- Assessments
- None detected in remarks — confirm with the listing agent.
Listing history 13 events
-
2026-06-18days on market $82,500 Active 22 DOM
-
2026-06-17days on market $82,500 Active 21 DOM
-
2026-06-16days on market $82,500 Active 20 DOM
-
2026-06-15days on market $82,500 Active 19 DOM
-
2026-06-13days on market $82,500 Active 17 DOM
-
2026-06-10days on market $82,500 Active 14 DOM
-
2026-06-09days on market $82,500 Active 13 DOM
-
2026-06-08days on market $82,500 Active 12 DOM
-
2026-06-07days on market $82,500 Active 11 DOM
-
2026-06-03days on market $82,500 Active 7 DOM
-
2026-06-02days on market $82,500 Active 6 DOM
-
2026-06-01days on market $82,500 Active 5 DOM
-
2026-05-31days on market $82,500 Active 4 DOM
ⓘ Source: listings_history table (triggers on properties + properties_extension) + one-shot
backfill from property_details.listing_events for pre-trigger history.
Tax reassessment forecast FL · Resets to sale price
- Current annual tax
- $776 · $65/mo
- Projected year-2 tax
- $776 · $65/mo
- Expected delta
- $0/yr ($0/mo · 0.0%)
ⓘ Screening estimate from a state-policy table — verify with the county assessor before closing.
Climate risk First Street
- Flood 1/10 Low FEMA zone X (unshaded) · 0% chance over 30 yrs
- Wildfire 3/10 Moderate
- Heat 10/10 Extreme 7 d/yr ≥107°F today · 29 d/yr by 30 yrs out
- Wind 10/10 Extreme 99% chance of damaging wind over 30 yrs
- Air quality 2/10 Low 1 unhealthy d/yr today · 1 by 30 yrs out
Nearby sold comps map
Loading sold comps map…
Walkable amenities ~0.75 mi
Loading nearby amenities…
Taxation est. · year 1
- Rental income
- $16,746
- − Mortgage interest
- −$4,621
- − Property taxes
- −$776
- − Insurance
- −$412
- − Repairs & maintenance
- −$1,340
- − Management
- −$1,340
- − HOA
- −$3,084
- − Depreciation
- −$2,400
- Taxable income
- $2,772
- Est. tax owed @ 24.0%
- −$665
- After-tax cash flow
- $3,099/yr
For passive investors: Depreciation is non-cash, so a rental often shows a tax loss while cash-flowing — sheltering income. Rental losses are passive: they offset passive income freely, and up to $25,000/yr can offset ordinary (W-2) income if you actively participate and your MAGI is under $100k (phasing out to $0 by $150k); unused losses carry forward. On sale, claimed depreciation is recaptured at up to 25%, and gains may owe capital-gains tax (a 1031 exchange can defer both). Figures are a year-1 estimate at your 24.0% rate — not tax advice; consult a CPA.
Schools (NCES district)
- District
- Lee
- NCES district ID
- 1201080
- Math proficiency
- 47% ▼ -11.00%
- Reading proficiency
- 50% ▼ -4.00%
- Median HH income
- $49,518
- Composite
- 41.49/100
- National rank
- #3458
- State rank
- #42 of 73 in FL
Livability — Fort Myers
- Score
- 86/100
- State rank
- #14
- US rank
- #383
Category grades
Schools grade is shown separately in the Schools card above.
Census & demographics
- Census place
- Fort Myers, FL
- County
- Lee County · 788,662 people
- City population
- 278,598
- Metro
- Cape Coral-Fort Myers, FL
- Population (ZIP)
- 41,381
- Household income
- $71,987
- Rent vs Own
- Severe rent burden
- 1358.0
Population outlook (Lee County) Hauer SSP2
- Today (2025)
- 871,946 people
- By 2030
- 955,468 · +9.6%
- By 2040
- 1,113,587 · +27.7%
- By 2050
- 1,256,891 · +44.1%
- By 2075
- 1,560,270 · +78.9%
- By 2100
- 1,726,848 · +98.0%
Race, ethnicity, and origin ACS 2023
- Neighborhood character
- Diverse neighborhood (Simpson 0.59)
- Race & ethnicity
- White 53% Hispanic / Latino 34% Two or more races 17% Black 9% Native American 4% Asian 2%
- Hispanic origin (detail)
- Mexican 11% Puerto Rican 5% Cuban 2%
- Common ancestry
- Romanian 2% Slovak 2% Lithuanian 2%
- Foreign-born
- 20% · Canada, Jamaica
- Languages at home
- 68% English-only · Spanish 29% Other Indo-European 1% German/W. Germanic 1%
Political lean MEDSL · Lee
- 2024 margin
- Strong R (+28.4) · D 35.5% · R 63.9%
- 2008→2024 swing
- -18.0pp toward R · 2008: -10.4pp · 2024: -28.4pp
- All cycles
- 2024: R+28.4 2020: R+19.2 2016: R+20.4 2012: R+16.6 2008: R+10.4
Not yet ingested
- Civics
- —
Market trends
- HPI YoY
- ▼ -122.89%
- Current HPI
- 268.4598
- Rent YoY
- ▼ -2.97%
- Metro
- Cape Coral-Fort Myers, FL
- State GDP YoY
- ▲ 3.28%
- F500 in state
- 36
Industry mix (Fortune 500 HQ in FL)
| Industry | F500 HQs | Revenue |
|---|---|---|
| Industrial Technology | 2 | $29B |
|
||
| Insurance | 2 | $17B |
|
||
| Retail | 1 | $60B |
|
||
| Technology Distribution | 1 | $58B |
|
||
| Homebuilding | 1 | $35B |
|
||
| Technology Manufacturing | 1 | $35B |
|
||
Price history
-98.8% since first listed10 events — show timeline
- 2026-05-26 Listed $82,500 FORTMLS
- 2026-04-30 Listing Removed — FORTMLS
- 2026-01-06 Price Changed $89,500 FORTMLS
- 2025-10-09 Listed $95,000 FORTMLS
- 2024-12-11 Listing Removed — FORTMLS
- 2024-09-27 Listed $99,000 FORTMLS
- 2022-01-31 Sold (MLS) $85,000 FORTMLS
- 2022-01-10 Pending — FORTMLS
- 2021-12-15 Listed $89,500 FORTMLS
- 1995-10-12 Sold (Public Records) $6,600,000 Public Records
Property tax history
+1.3%/yrLatest (2025): $776 · -51.0% YoY. Source: county tax records.
Cash-flow waterfall
monthlySold comps — $/sqft
last 12 mo · ≤1 miLoading sold comps…